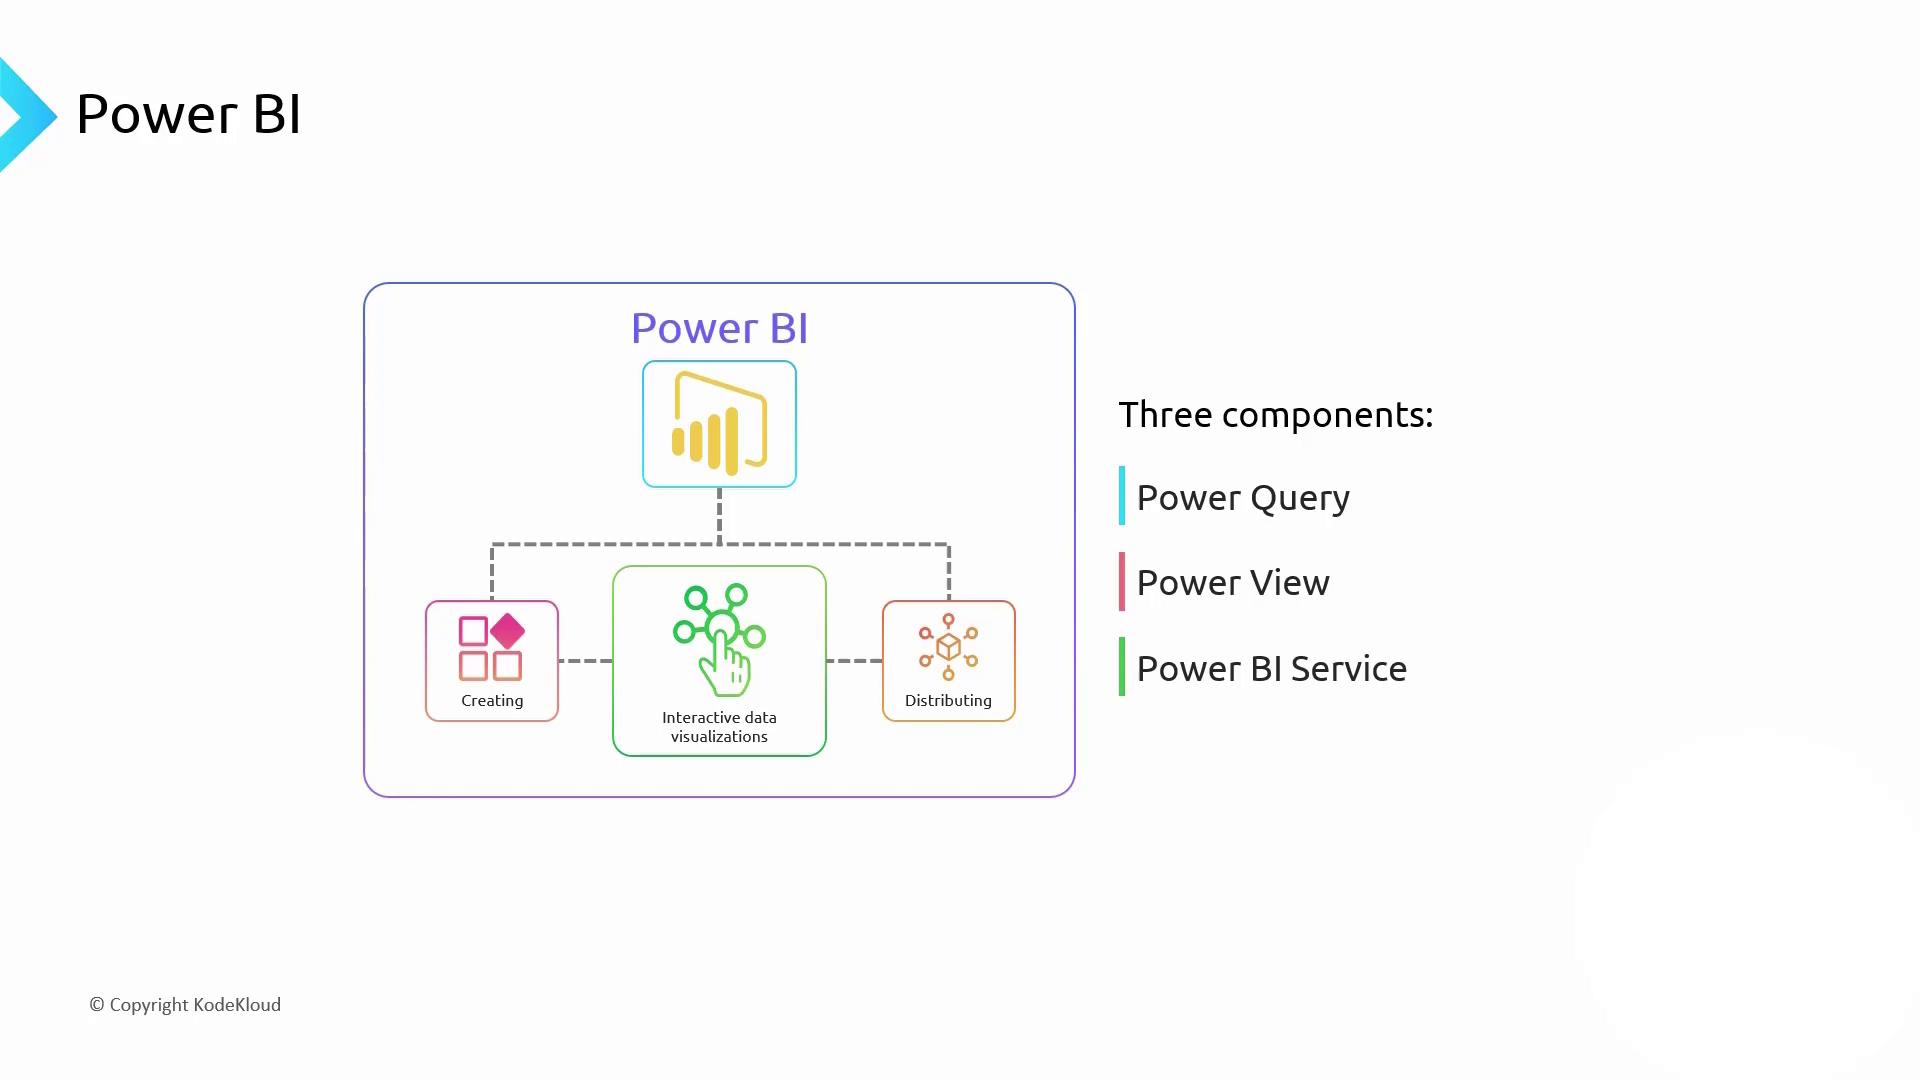
- Building interactive visualizations
- Distributing those reports to end users
Power BI Desktop: Create and Design
Power BI Desktop (formerly Power BI Designer) is the free Windows client that combines Power Query and Power View into a single workspace. Both the free and Pro versions offer full design capabilities, with Pro removing dataset size limits and adding collaboration features.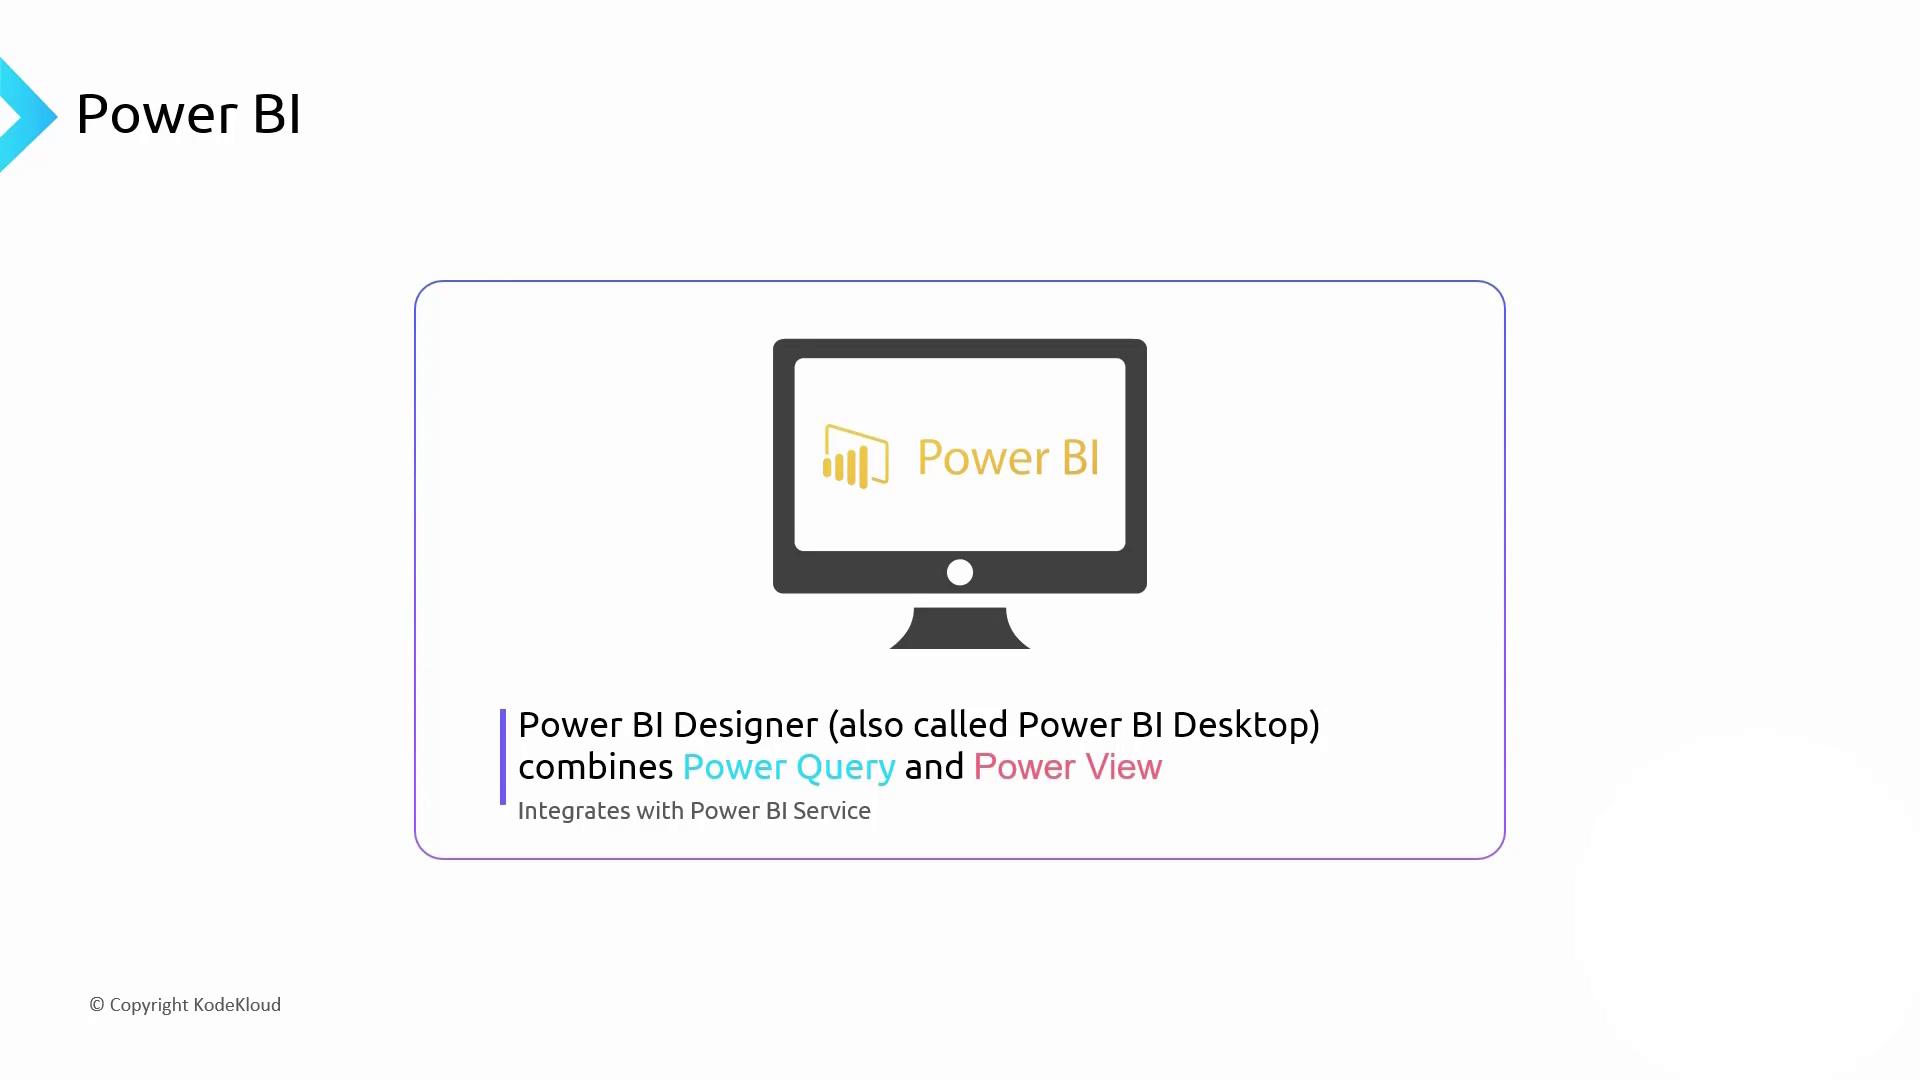
1. Power Query: Extract, Transform, Load (ETL)
Power Query is where you connect to sources, shape data, and load it into your Power BI dataset. Common transformations include:- Joining or splitting tables
- Cleaning invalid or null values
- Filtering out unneeded rows

Power Query’s step-by-step transformation ensures reproducibility. When you refresh, only the final query runs against the source.
Import vs. DirectQuery
| Mode | Characteristics | When to Use |
|---|---|---|
| Import | Data is loaded into Power BI’s in-memory engine. Fast interaction. | Datasets under size limit, offline analysis. |
| DirectQuery | Queries the source in real time. No import limits but slower visuals. | Large tables, always-up-to-date dashboards. |
DirectQuery can add query latency to visuals. Always test performance when using live connections.
2. Power View: Design Interactive Reports
Once data is loaded or connected, switch to Power View to craft visuals. Power BI Desktop offers over 40 built-in charts plus community-driven custom visuals. Visual interactions mean selecting one chart filters the rest, and date slicers dynamically slice time-series data.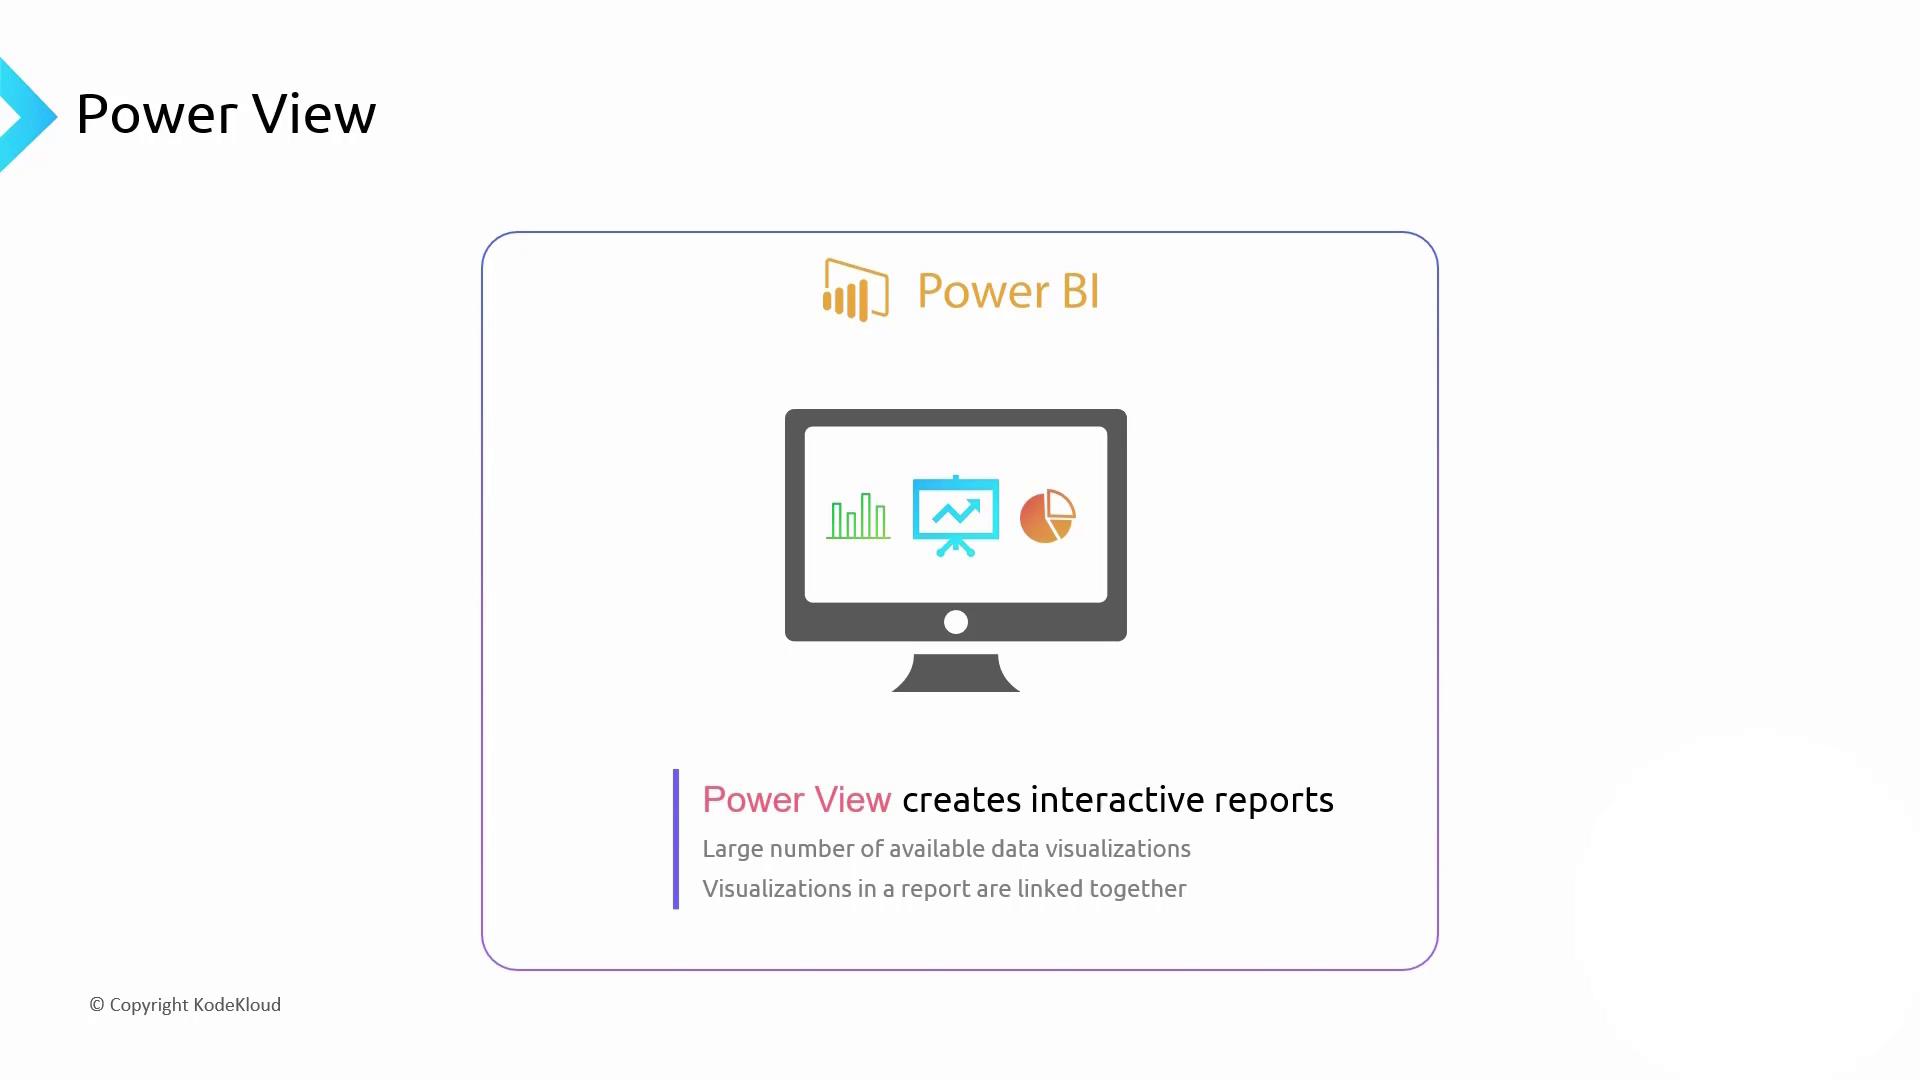
Filtering, Slicers & Hierarchies
- Slicers for on-canvas filtering
- Drill-down/up through hierarchies (Region → Country → City → Customer)
- Automatic date hierarchies (Year → Quarter → Month → Week)

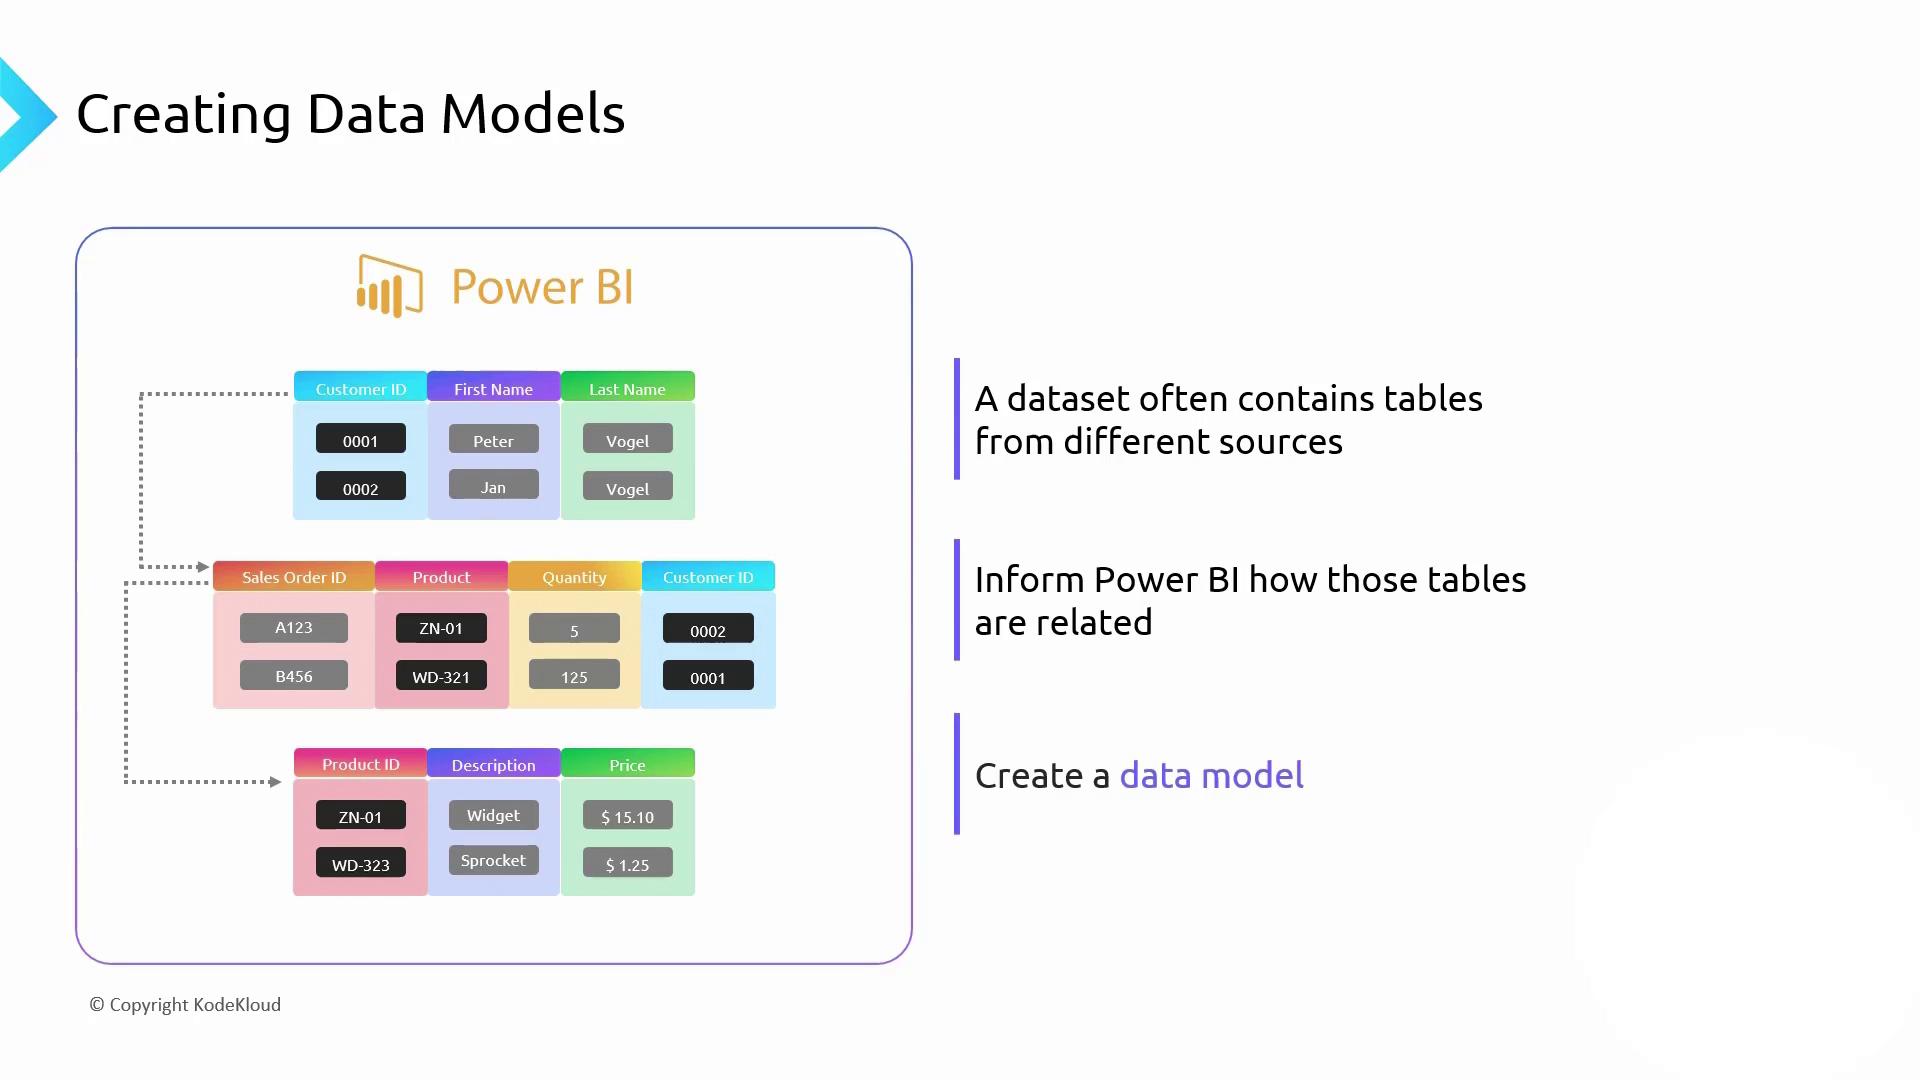
Data Modeling in Power BI
Central to unified reporting is a robust data model. Power BI lets you:- Import tables from Excel, Azure SQL Database, Cosmos DB, and more
- Auto-detect relationships by column names or define them manually
- Build star or snowflake schemas with fact and dimension tables
In modeling view, drag to create relationships or adjust cardinality and cross-filter direction for accurate joins.