Monitoring and Alerting Fundamentals
A robust monitoring setup is crucial. Popular tools include CloudWatch, Prometheus, and others like Nagios, depending on your organization’s needs. While monitoring systems collect essential data, alerting systems must be configured separately to trigger action when specific thresholds are breached. For instance, CloudWatch typically integrates with SNS (Simple Notification Service) to send emails or trigger notifications, whereas Prometheus uses Alertmanager for managing alerts. Once the monitoring system gathers key metrics from your application, alert rules evaluate this data and notify the relevant team members—often via email, Slack, or even an automated phone call. The phone call, for example, ensures immediate attention from the on-call engineer, reducing potential delays inherent in email-based notifications.Real-World Example
Imagine a front-end application deployed on various platforms like an autoscaling group, a Kubernetes cluster, or on a dedicated Amazon Elastic Compute Cloud (EC2) instance. This application emits metrics that your monitoring tool collects—for Prometheus, by scraping metrics endpoints; for CloudWatch, by pushing metrics directly. Visual dashboards such as Grafana or CloudWatch dashboards enable continuous observation of system health. Based on predetermined thresholds, if an error or missing metric is detected, alerts are dispatched via Slack, email, or a phone call.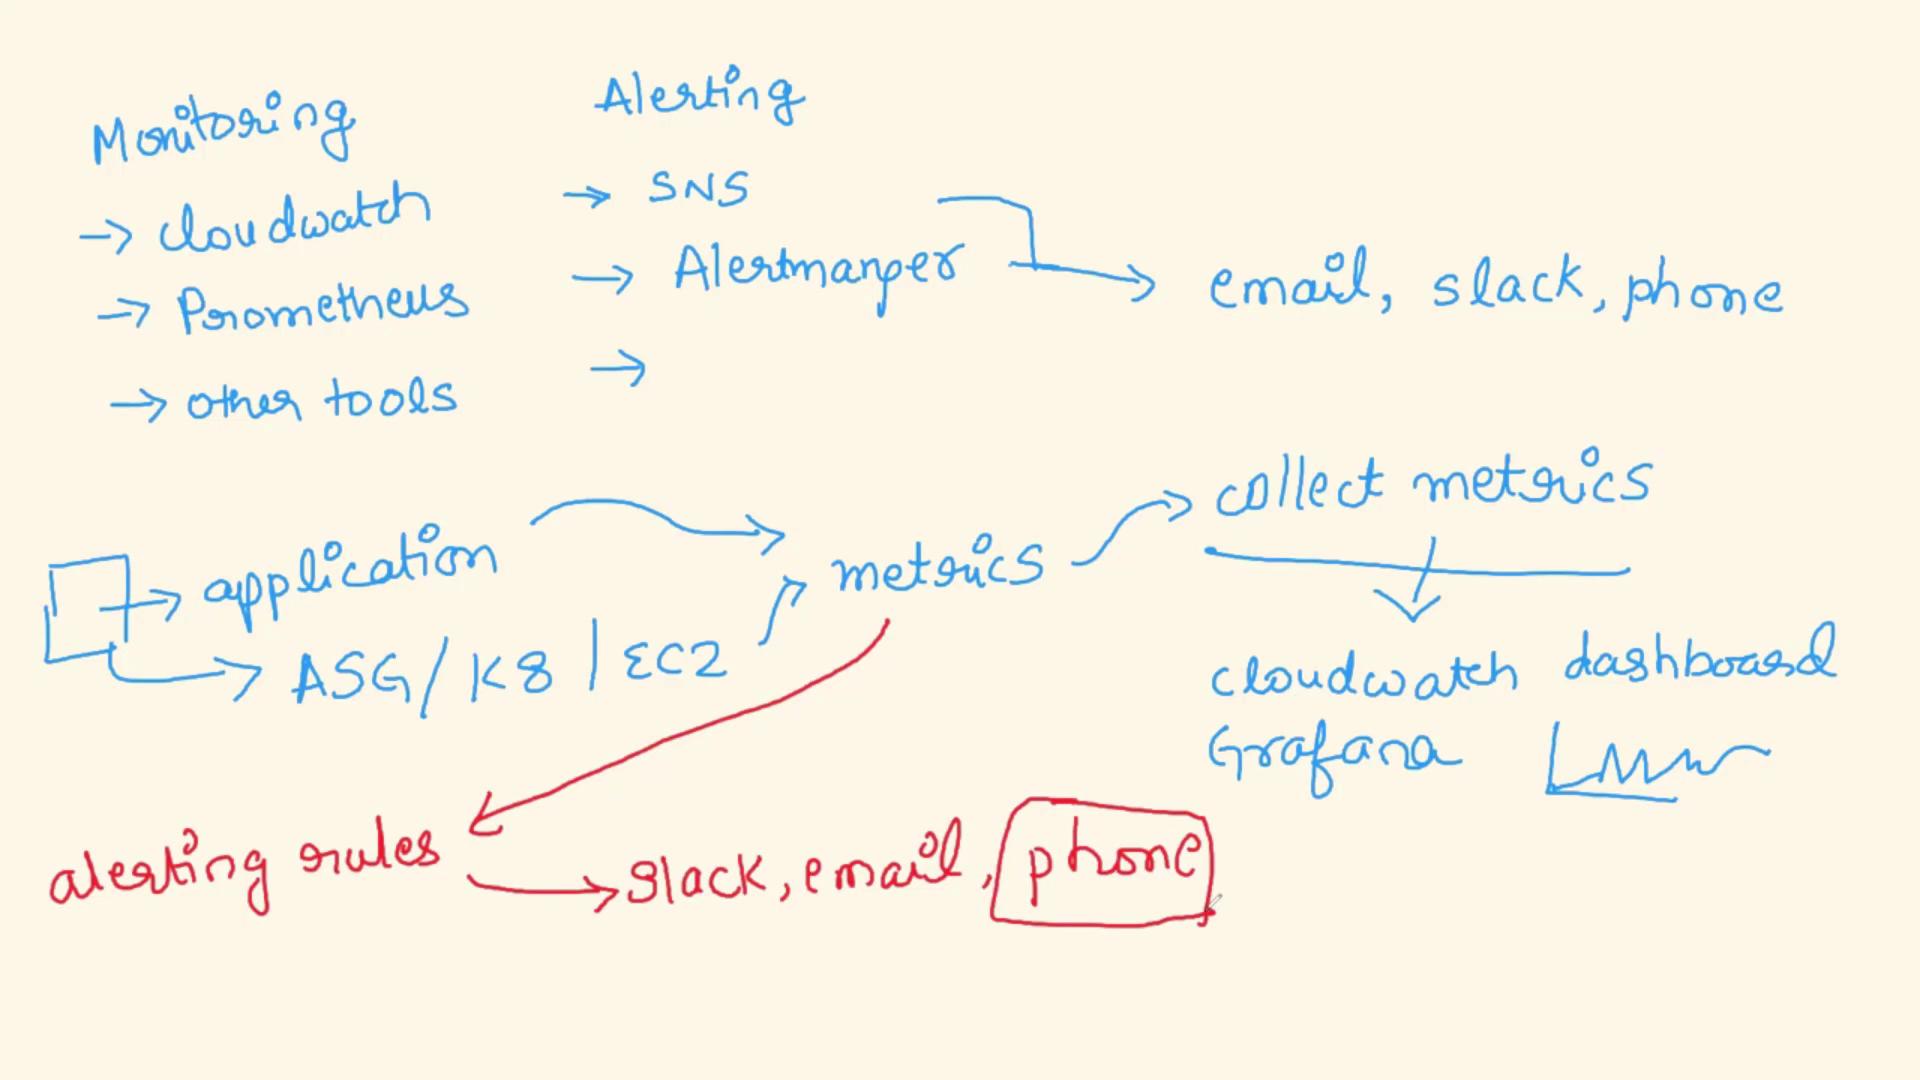
Incident Management Process Overview
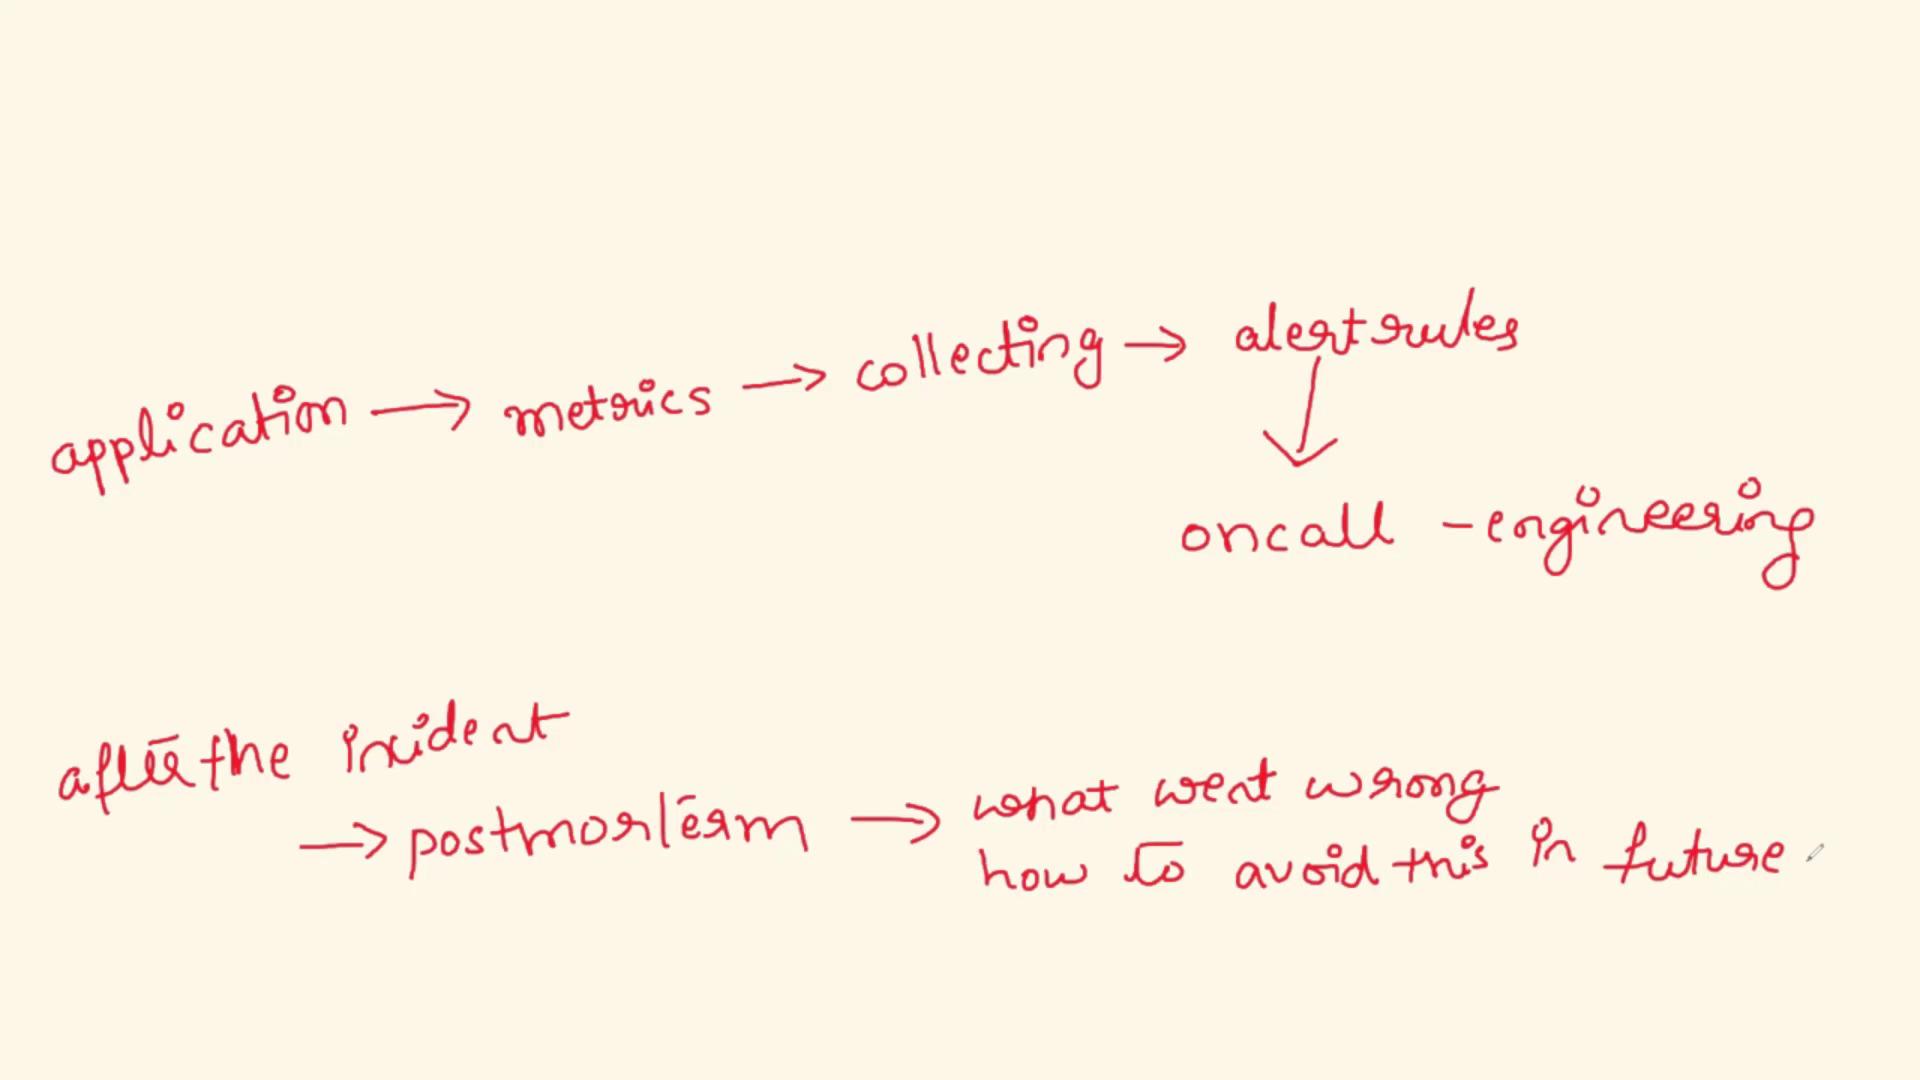
Follow these key steps for handling incidents:- Metric Emission: The application emits relevant performance and health metrics.
- Data Collection: The monitoring tool collects these metrics.
- Alert Evaluation: Predefined rules evaluate the metrics against set thresholds.
- Notification: Upon detecting an issue, the system alerts the on-call engineer via email, Slack, or a phone call.
- Incident Response: The on-call engineer responds to address and resolve the incident.
In an interview, you might explain it this way:“In our organization, our applications emit metrics that are captured by our monitoring systems, such as CloudWatch or Prometheus. We have set up alert rules that promptly detect failures or anomalies. When these rules trigger an alert, the on-call engineer is notified immediately, typically via a phone call, with supplemental notifications on email and Slack. Following incident resolution, we conduct detailed postmortems to refine our processes and enhance future incident response.”