

Basic Debugging Experience
We start with a minimal C library that calculates the factorial of a non-negative integer:.wasm):
var0. However, mapping these low-level variables back to your C source can be tedious.
Low-level WASM debugging displays raw opcodes (
local.get, i32.mul, etc.) and generic local names. To see your original C/C++ code directly, you need DWARF debug symbols.Source-Level Debugging with DWARF
For larger C++ projects—such as rendering a Julia set fractal with SDL2—inspecting raw assembly is cumbersome. A Julia set is generated by iterating a simple complex-numbers formula for each pixel. Here’s a concise renderer:Compiling with Debug Info
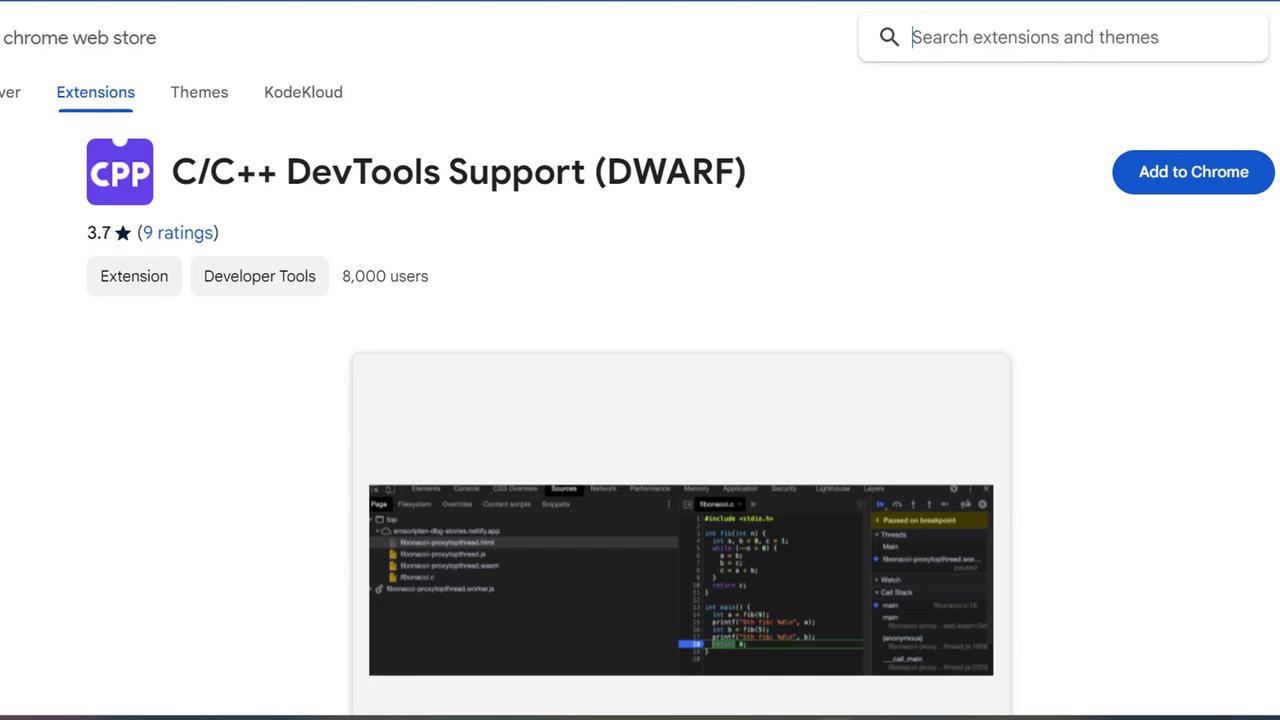
- Install the C/C++ DevTools Support (DWARF) extension from the Chrome Web Store.
- Compile with SDL2 support and DWARF symbols:
Open the resulting HTML in Chrome (with the DWARF extension enabled). In DevTools > Sources, you’ll find a C/C++ tab where you can:
- Set breakpoints in your original
.cppfiles - Step through high-level C++ code, not raw WASM opcodes
- Inspect variables by name and type
Links and References
- WebAssembly (MDN)
- Emscripten Documentation
- Chrome DevTools for WebAssembly
- C/C++ DevTools Support (DWARF) extension
- Julia Set (Wikipedia)