

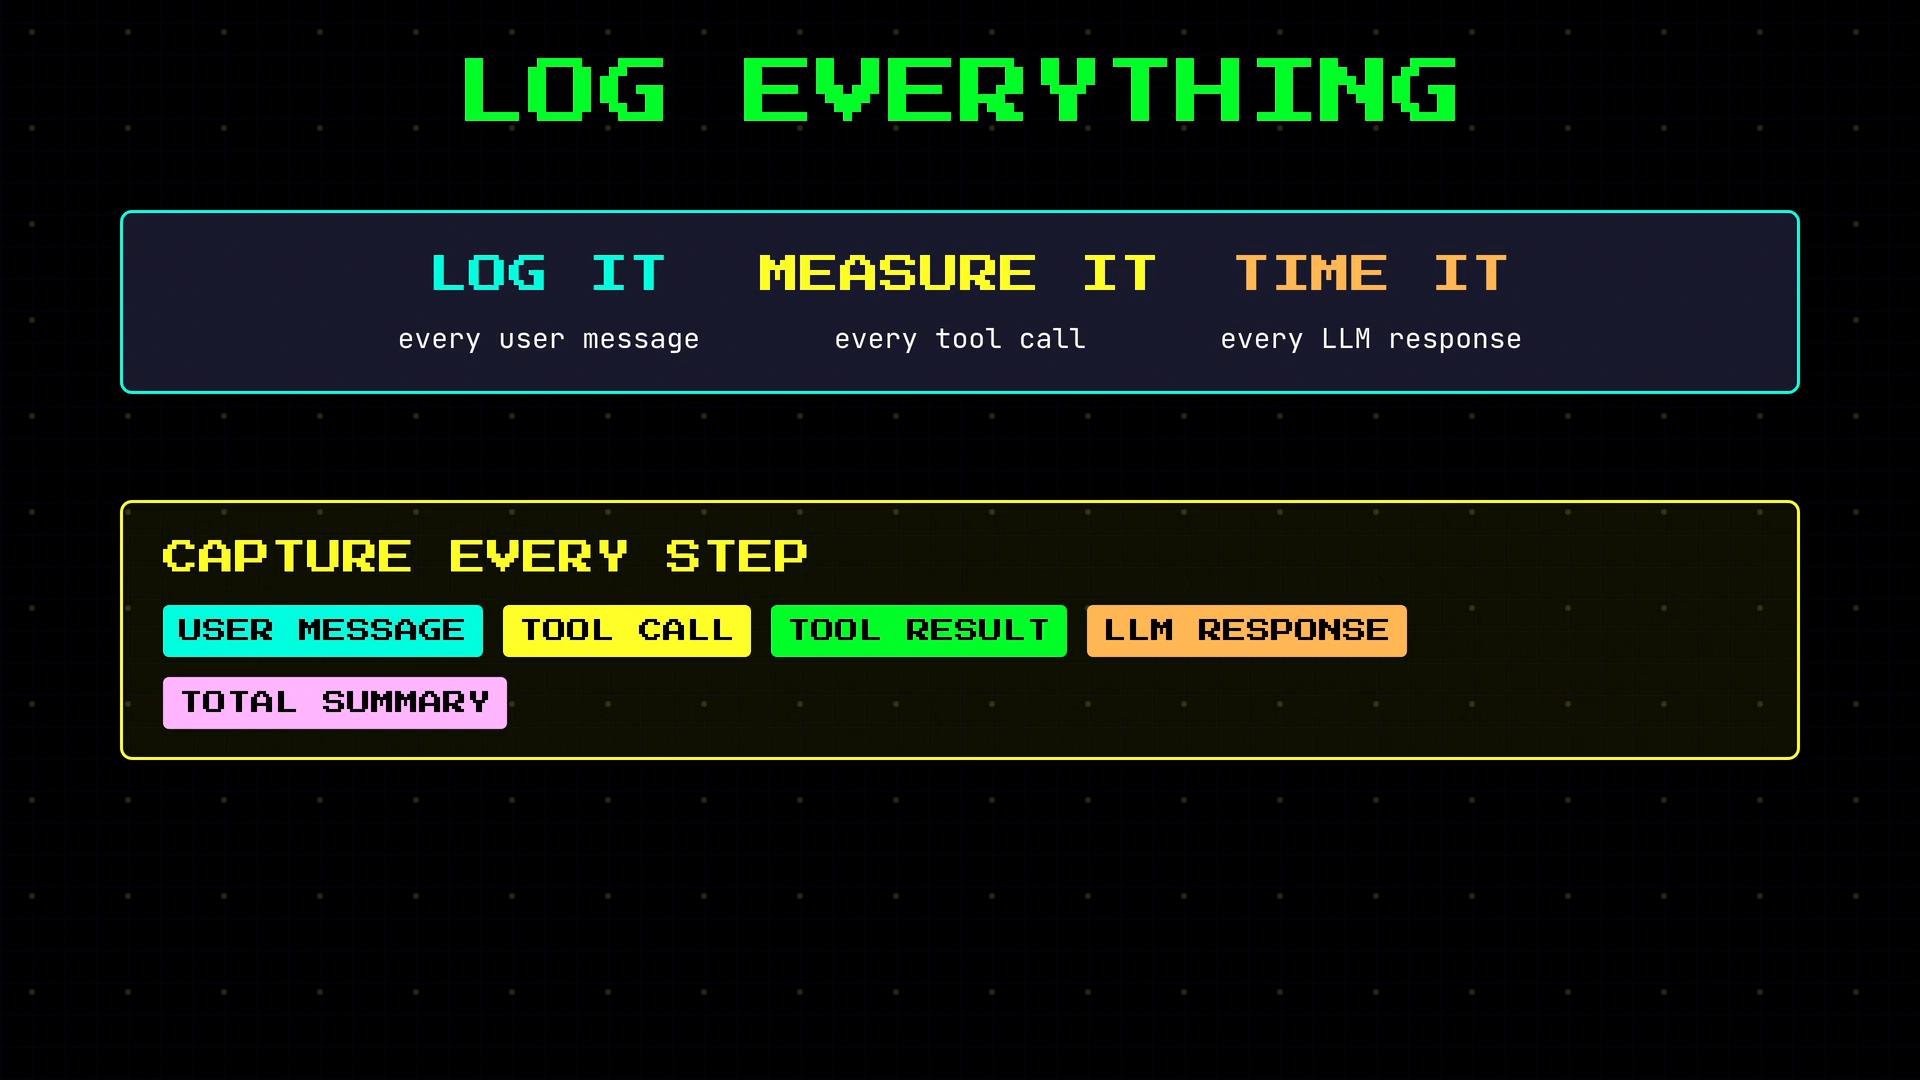
- Log incoming user messages.
- Log model decisions to call tools, including tool name and arguments.
- Log tool results and token counts.
- Log the model’s final response.
- At request completion, log totals: elapsed time, total tokens, tool call counts.
Example: fully logged flight booking request
- 12:01:00 — User: “Book me a flight to NYC next Friday under $300”
- The model selects
Search Flights(with date and price cap). - 12:01:01 — Tool call:
search_flights - 12:01:02 — Tool result: 4 flights found (1,200 tokens)
- 12:01:02 — Tool call:
check_calendar - 12:01:03 — Tool result: calendar loaded (800 tokens)
- 12:01:04 — Final model text response
- Total: 3 LLM calls, 2 tool calls, 2,200 tokens, 4.0s
Log everything, but avoid storing sensitive user data in plain text. Implement redaction, anonymization, or tokenization for personally identifiable information (PII) before long-term storage.
Key metrics to capture for every request
Track these six metrics consistently. They help you spot regressions, prevent runaway costs, and identify reliability problems.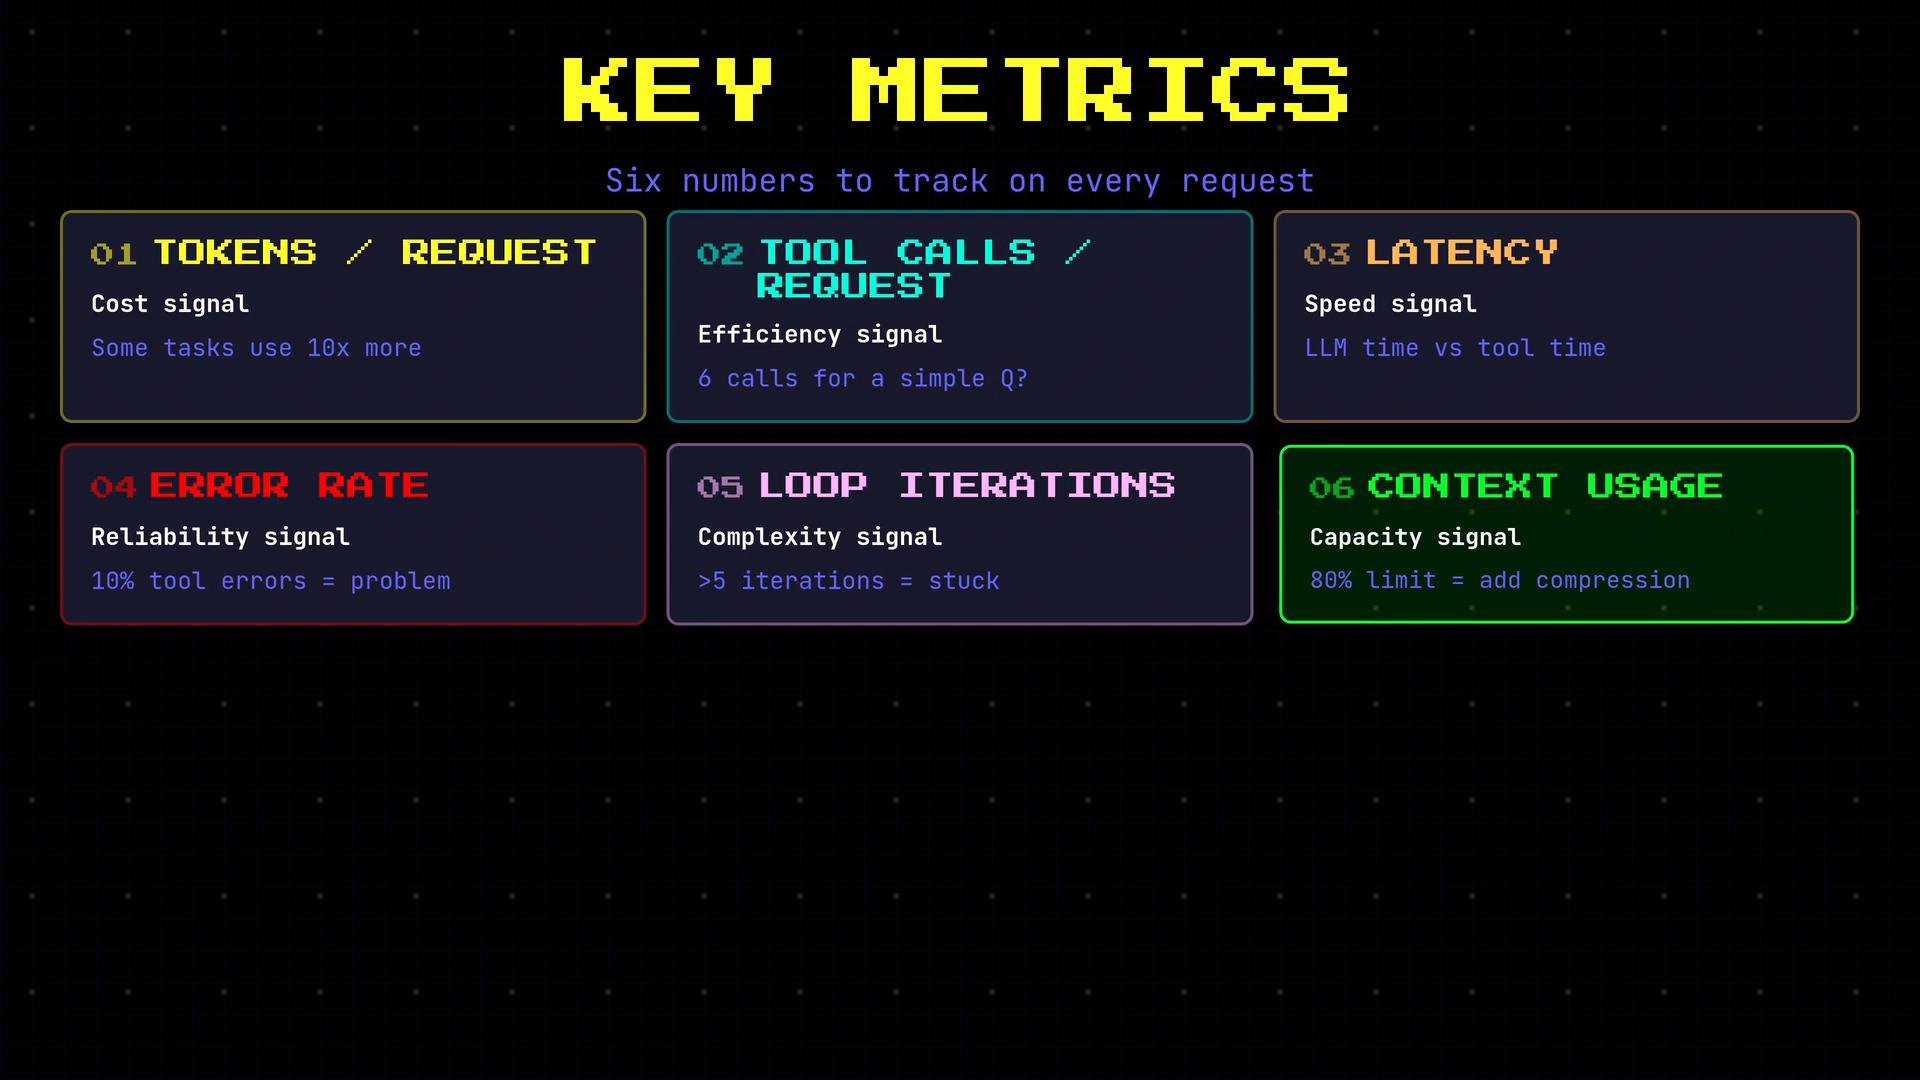
Common failure modes and debugging steps
-
Agent returns wrong answers
- Inspect logs for tool results and timestamps. Often the reasoning is correct but the data is stale or erroneous. Fix the tool or data source rather than the model.
-
Agent calls the wrong tool
- Make tool descriptions explicit. If two tools look similar to the model (e.g., “Search Web” vs “Search Flights”), clarify usage conditions in the tool description and system prompt.
-
Agent loops without progress
- Usually the model cannot interpret a tool’s output. Improve the result format (structured JSON, clear keys), add instructions on how to handle that output, or include success/failure flags in tool responses.
-
Responses are too slow
- Break down latency into LLM vs. external API time. Large context windows increase LLM latency; slow third-party APIs increase tool latency. Optimize by compressing context and caching tool results.
-
Context window overflow
- Summarize or compress old turns, cap included history, or implement retrieval strategies to avoid reaching ~80% of the model’s context limit.
Real-time event streaming and observability (OpenClaw)
OpenClaw streams agent events in real time via a Pub/Sub event system: text generation, tool calls, tool results, errors, retries, and context compression are emitted as events. Streaming these events enables:- Live debugging and replay of agent behavior.
- Building progress indicators and structured UIs that reflect each step.
- Postmortem analysis and searchable transcripts.
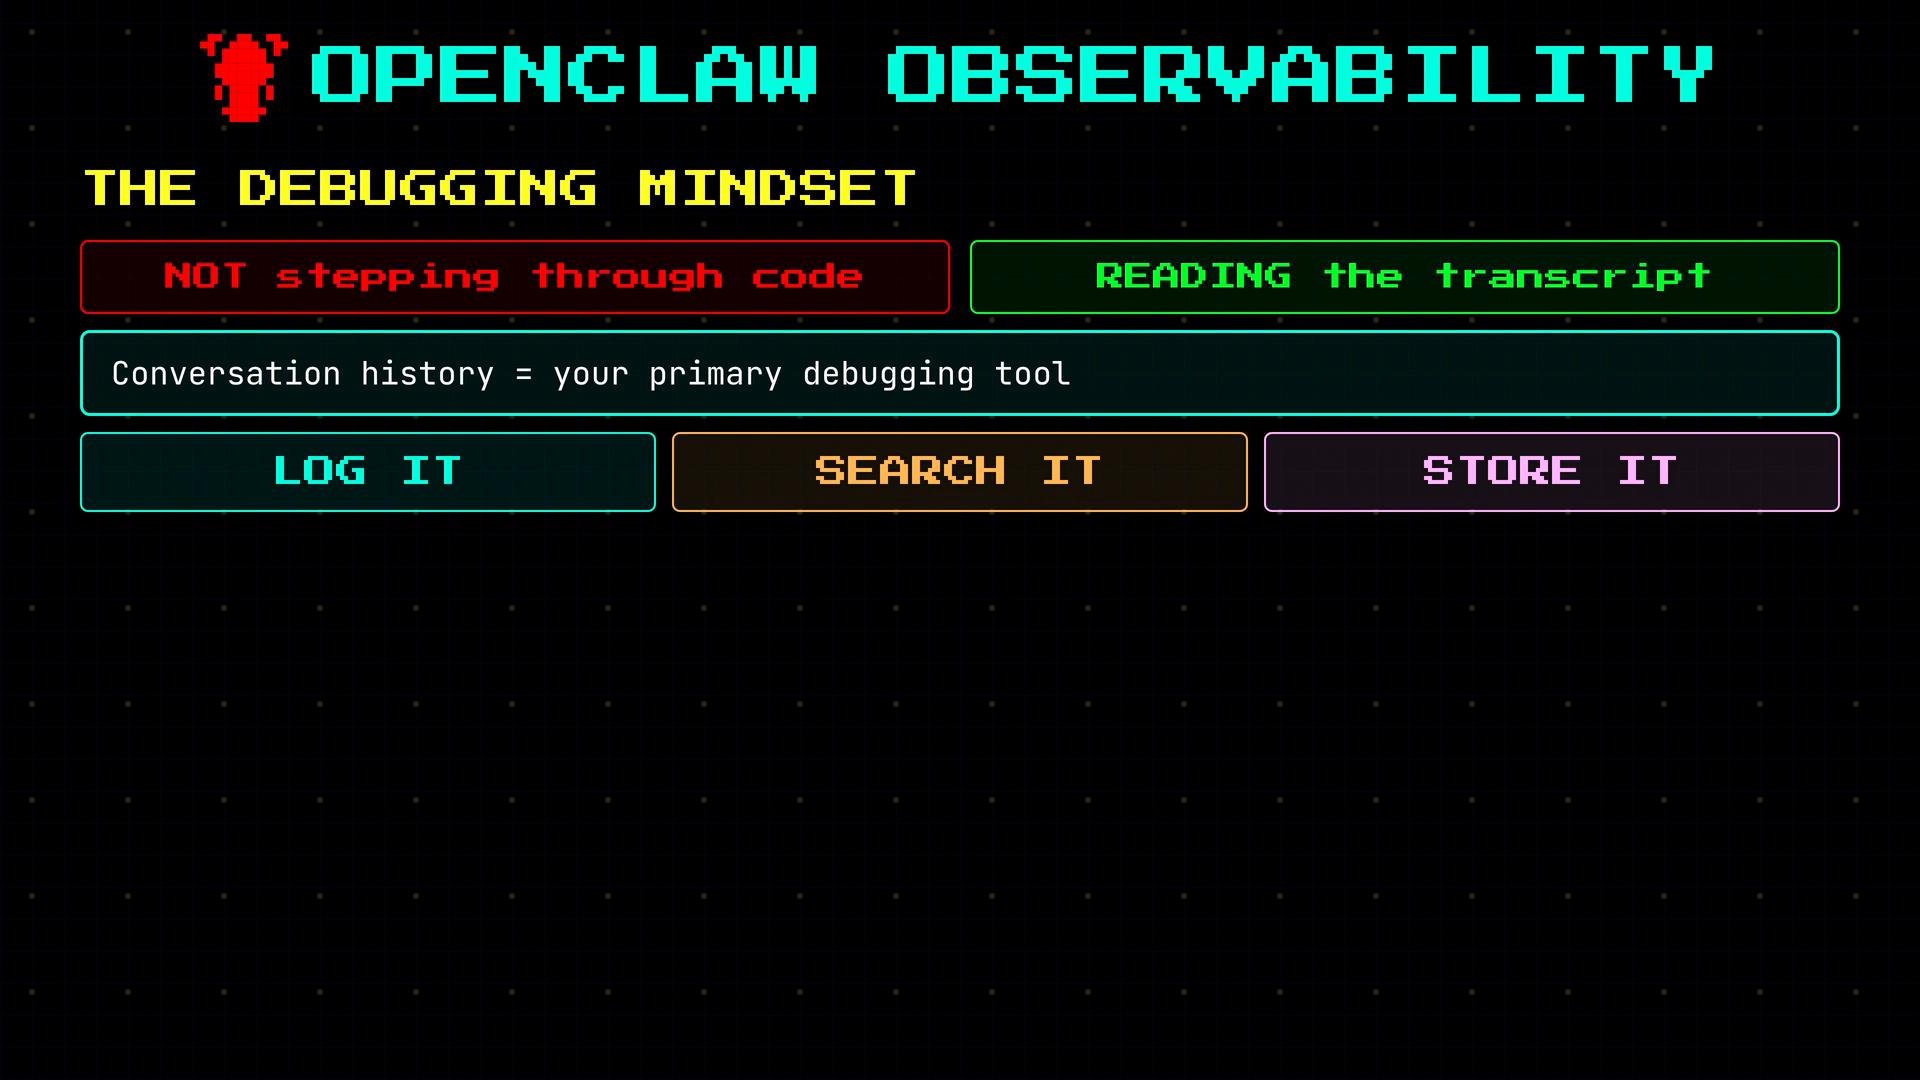
The debugging mindset for agents
You are not stepping through functions — you are reading a transcript. Every tool call, every result, and the model’s reasoning is your primary debugging interface. Make logs searchable, structured, and retained long enough for analysis and postmortems.Beware of cost and privacy: verbose logging increases token usage and storage. Balance fidelity with cost and compliance by sampling, redacting PII, and aggregating metrics.
Checklist: build observability from day one
- Design logs as structured events (timestamp, type, payload, tokens, duration).
- Emit both high-level summaries and raw traces for deep debugging.
- Track the six key metrics per request and surface alerts on outliers.
- Stream events for live UIs and easier replay.
- Ensure PII is handled (masking/redaction) and log retention complies with policy.
- Use tools like OpenTelemetry and Prometheus for metrics and tracing integrations.
Links and references
- OpenTelemetry: https://opentelemetry.io/
- Prometheus: https://prometheus.io/
- Guidance on logging and PII: https://www.privacyguidance.example/ (replace with your org policy)