

- eBPF datapath on each node for flow and event capture
- Relay to aggregate data across nodes
- Integrations with Prometheus (metrics), Grafana (dashboards, service maps), and Hubble UI/CLI for interactive inspection
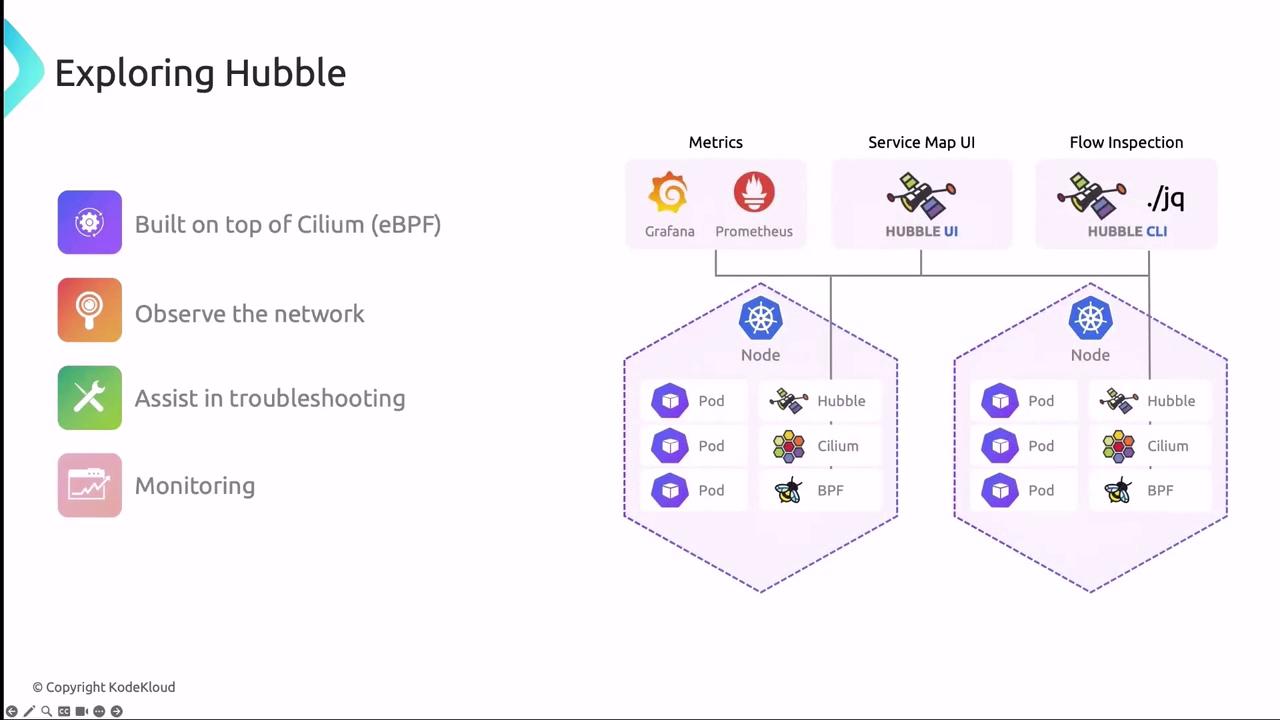
Built-in Metrics for Prometheus
Hubble exports metrics in the Prometheus OpenMetrics format, making it simple to monitor network health and trigger alerts on key events:Enable only the metrics you need to reduce data volume and improve query performance.
Enabling Hubble Metrics via Helm
When installing or upgrading Cilium with Helm, you can enable Hubble and Prometheus integration in one step:Hubble UI and CLI
Hubble offers both a web-based UI and a scriptable CLI, providing deep visibility into service interactions, network flows, and security policy verdicts.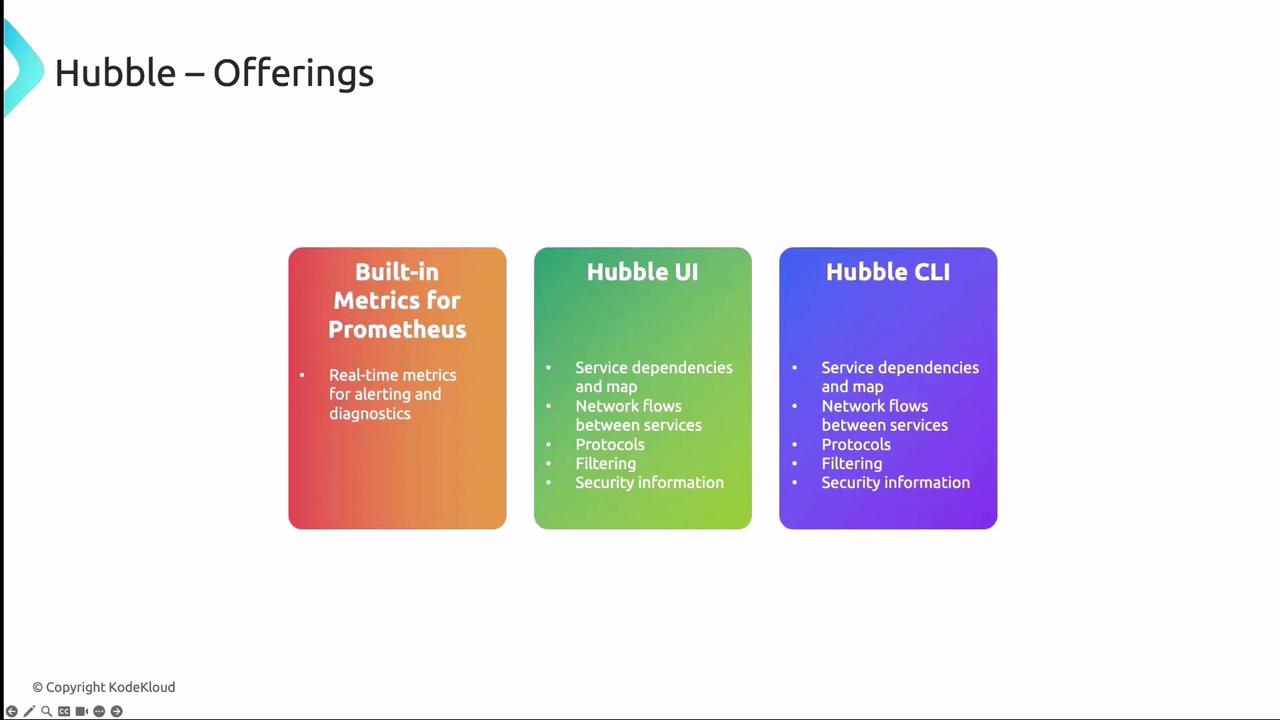
Hubble UI
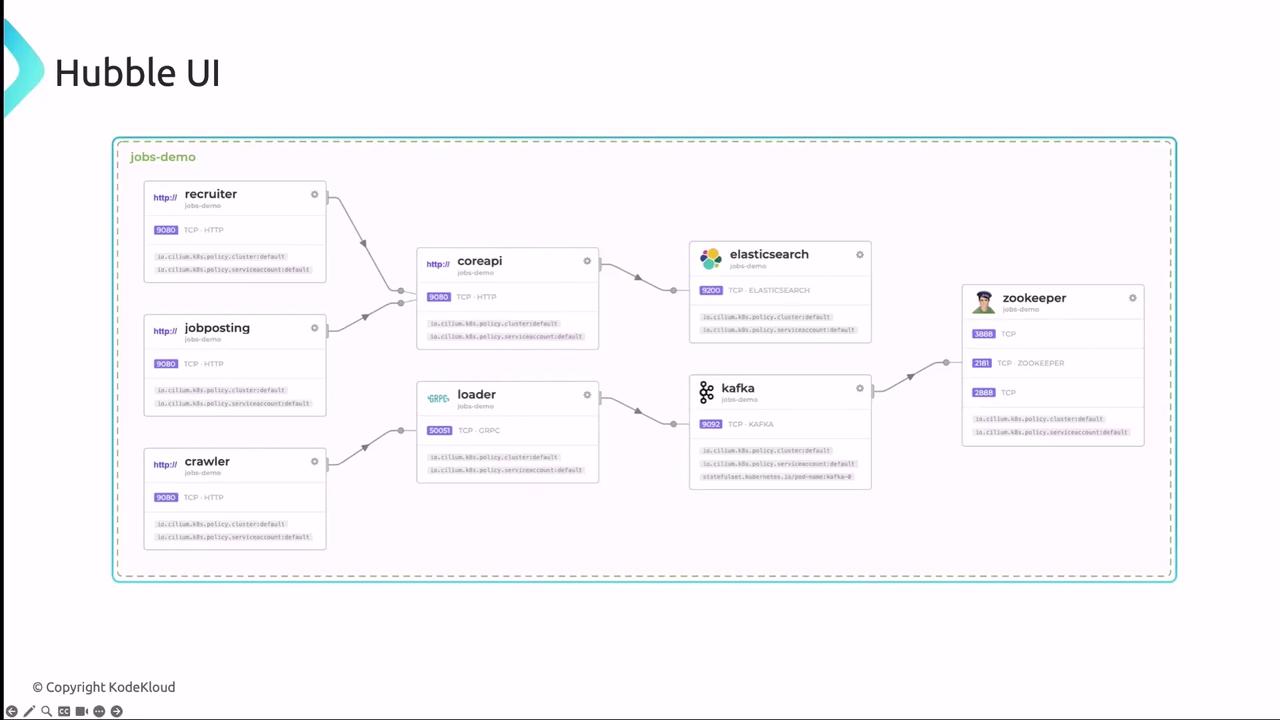
The Hubble UI delivers interactive dashboards and service maps:- Service Dependency Map
Visualize inter-service communication to spot bottlenecks or misconfigurations. - Flow Table
Inspect individual network flows with source/destination, protocol details, performance metrics, and policy verdicts. - Security Events
Review blocked connections, policy violations, and external access attempts.
Avoid exposing the Hubble UI publicly without proper authentication. Use port-forwarding or an ingress with strong access controls.
Launching Hubble UI Locally
Forward the UI port to your workstation:Hubble CLI
The Hubble CLI offers the same visibility in a terminal-friendly format, ideal for automation and scripts. Check the status inside a Cilium agent pod:Installing the Hubble CLI on Linux
Next, we’ll dive into a hands-on demo to see Hubble in action.