

Prerequisites
- A running Kubernetes cluster with Cilium installed (v1.15.3 or later).
- Prometheus and Grafana deployed in the
cilium-monitoringnamespace.
Hubble components (Relay, UI, metrics) are disabled by default. You must enable them via Helm to collect and visualize network flows.
1. Verify Cilium and Hubble Status
First, confirm Cilium is healthy and Hubble is not yet active:2. Enable Hubble Components
Upgrade your Cilium installation to enable Hubble Relay, UI, and Prometheus metrics:3. View Hubble Metrics in Grafana
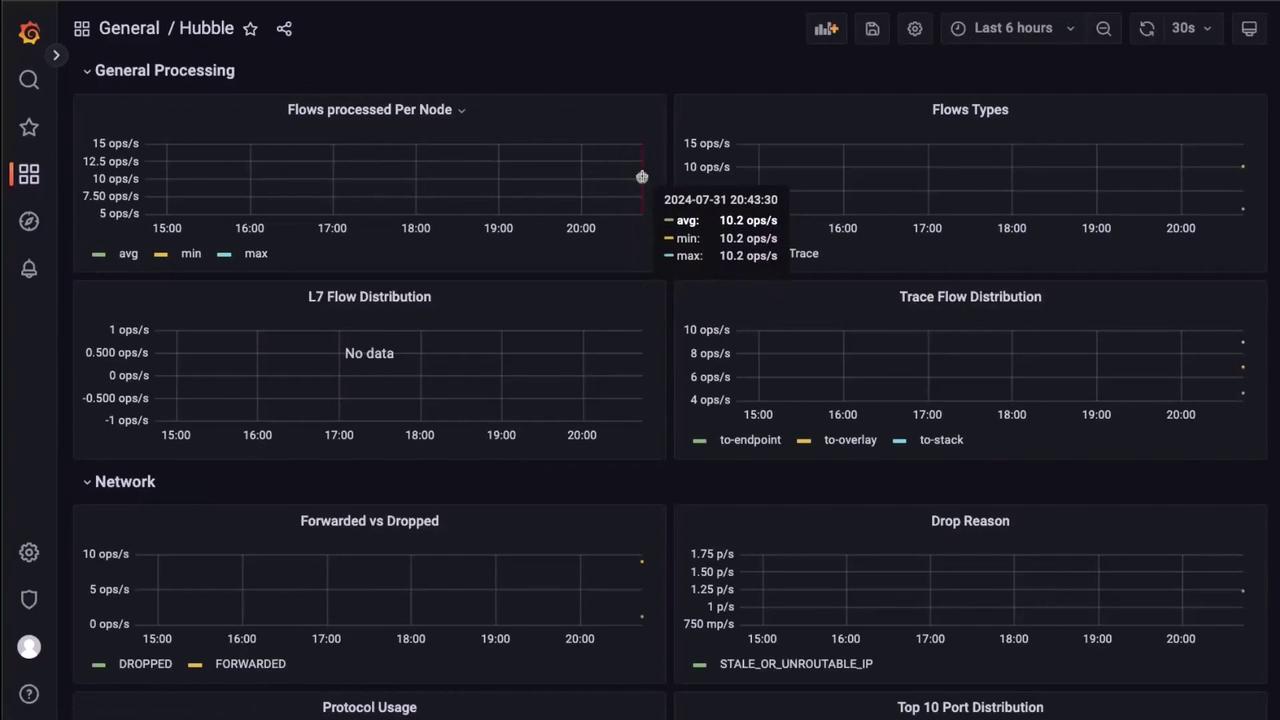
Navigate to the Grafana dashboard in thecilium-monitoring namespace. You should see Hubble flow metrics such as flows per node, dropped vs forwarded traffic, and protocol distribution:
4. Expose the Hubble UI as NodePort
By default, the Hubble UI service isClusterIP. Edit it to use a NodePort for external access:
Exposing services via NodePort can open your cluster to external traffic. Ensure proper firewall rules or security groups are in place.
<NodeIP>:30000.
5. Test Network Flows with curl
We have a demo application offering two endpoints:/api– restricted to requests with headerX-API-KEY: abc123from pods labeledapp=admin./healthz– open to all traffic.
CiliumNetworkPolicy to enforce this:
Observe Metrics for Forwarded vs Dropped Flows
Return to Grafana to see the changes in the “Forwarded vs Dropped” panel and other flow statistics: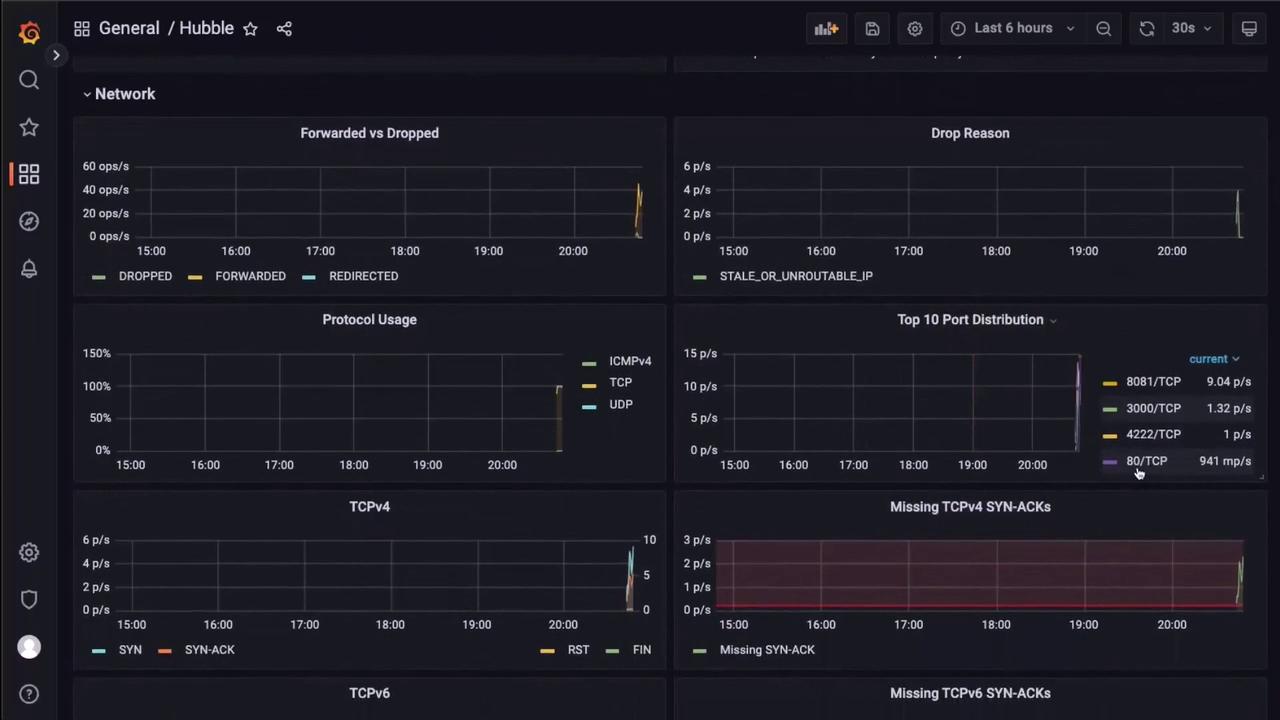
6. Visualize Live Flows in Hubble UI
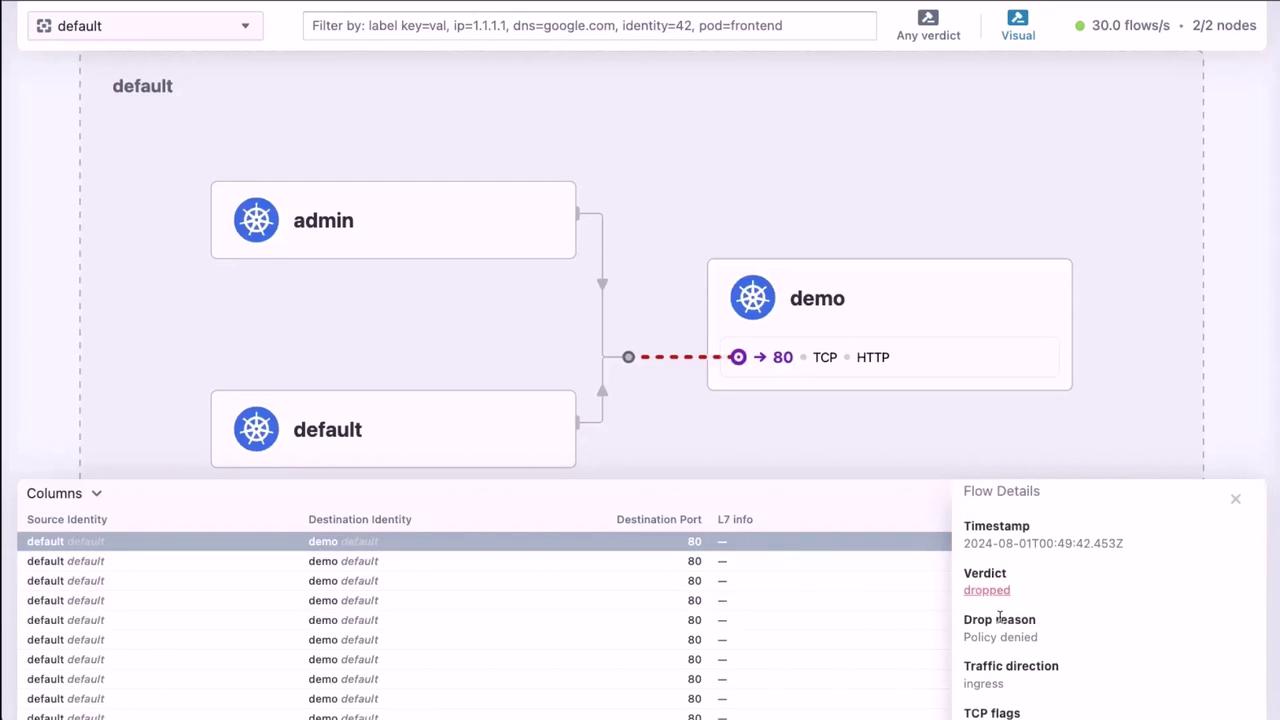
Open the Hubble UI at<NodeIP>:30000 to explore live network flows. Click on any flow to see detailed metadata and policy verdicts:
7. Using the Hubble CLI
You can also use the Hubble CLI for real-time troubleshooting. Exec into a Cilium agent pod:Conclusion
Cilium Hubble delivers powerful network observability through both a rich UI and command-line interface. Integrate Hubble with Prometheus and Grafana for long-term monitoring or use thehubble CLI for on-the-fly troubleshooting.