Example Architecture
Imagine an AWS setup where a Virtual Private Cloud (VPC) spans two Availability Zones. Each zone hosts an Auto Scaling group with two EC2 instances. You’re sending instance metrics, VPC traffic stats, Auto Scaling health checks, and three alarms (Alarm 1, Alarm 2, Alarm 3) to CloudWatch.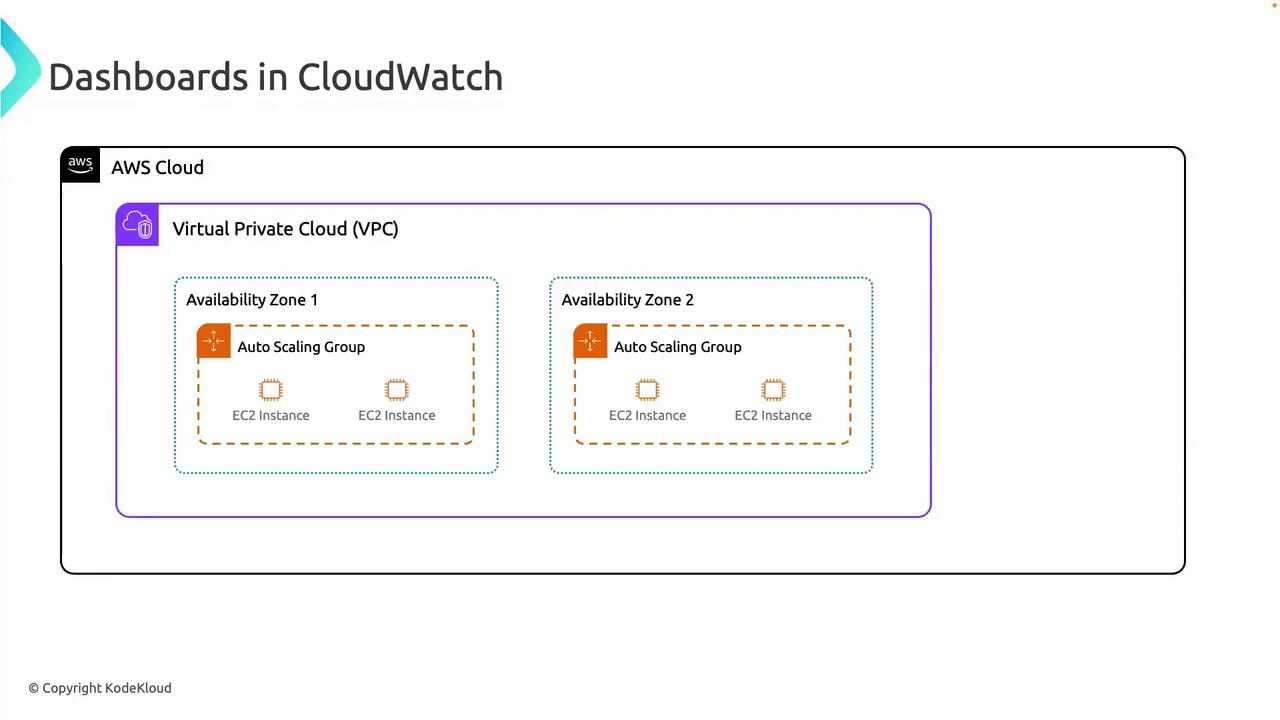
Key Benefits of CloudWatch Dashboards
| Benefit | Description |
|---|---|
| Customizable Views | Drag-and-drop metrics, logs, and widgets to build the perfect layout. |
| Real-Time Metrics | Automatically refresh charts for up-to-the-minute visibility. |
| Multi-Resource Monitoring | Aggregate data from EC2, RDS, Lambda, and more on one screen. |
| Interactive Charts | Drill down, zoom, and slice time ranges to investigate anomalies. |
| Secure Sharing | Use IAM to grant view/edit permissions at the dashboard level. |
| Cost Control | Pay only for the dashboards and widgets you create. |
1. Customizable Monitoring Views
Design dashboards that reflect your operational needs. Combine standard metrics, logs, or even custom widgets—limitless flexibility through a drag-and-drop canvas.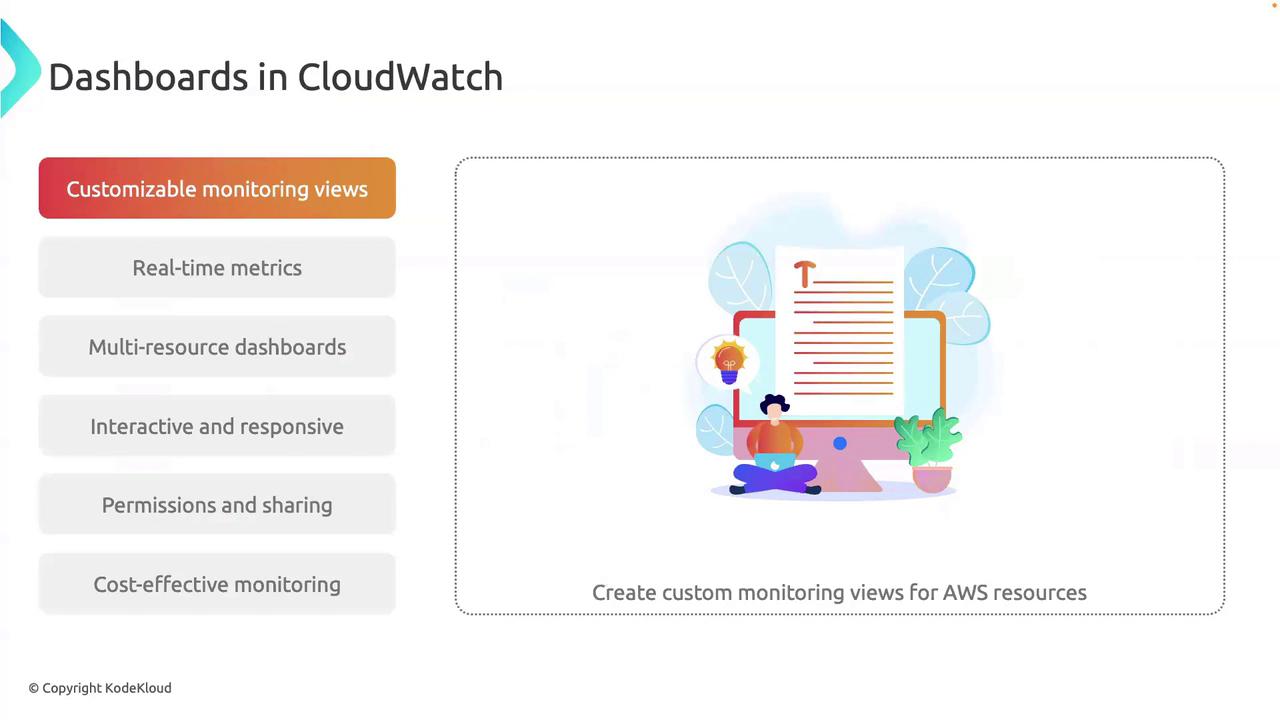
You can embed text, images, and markdown in custom widgets to provide context or instructions directly on your dashboard.
2. Real-Time Metrics
Get continuous updates without manual refresh. Real-time metrics empower you to detect and respond to issues immediately, minimizing downtime.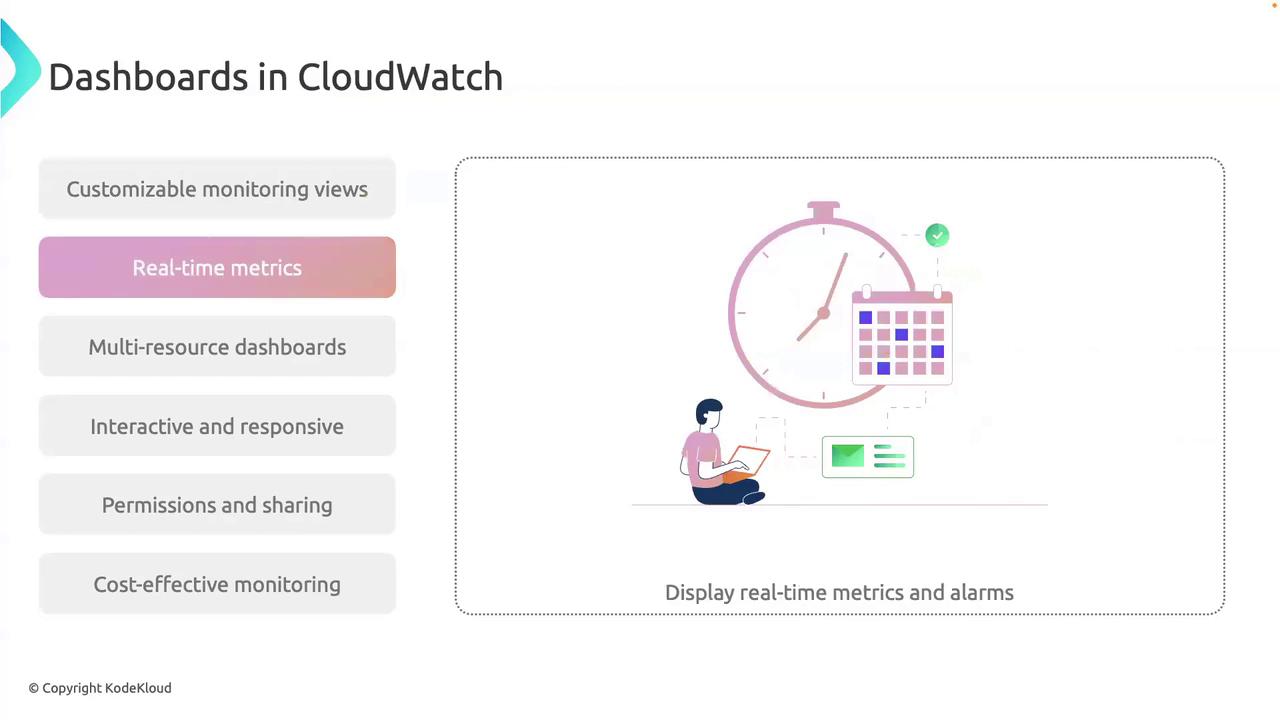
3. Multi-Resource Monitoring
Aggregate metrics from EC2, RDS, Lambda, DynamoDB, and custom namespaces—all on one dashboard. Track your entire application stack side by side.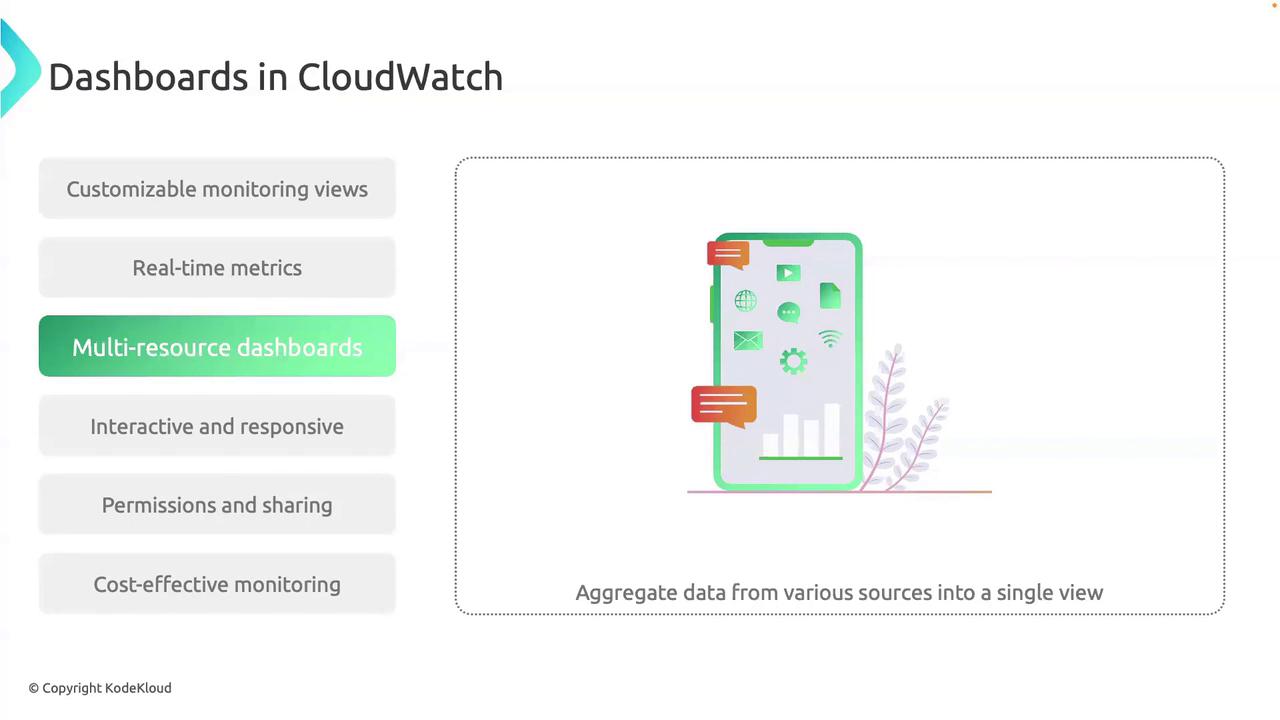
4. Interactive and Responsive
Dashboards are fully interactive: click a data point to jump into the logs, zoom into specific time windows, or filter by dimension. Built with responsive design, they render perfectly on desktops, tablets, and smartphones.
5. Collaboration and Sharing
Control who can view or modify each dashboard using AWS Identity and Access Management (IAM). Grant teams only the permissions they need, ensuring security and compliance.
Over-communicating permissions can lead to unintended access. Always follow the principle of least privilege when configuring IAM roles for dashboards.
6. Cost-Effective Monitoring
AWS CloudWatch Dashboards use a pay-as-you-go model. You incur charges only for the number of dashboards and custom widgets you create.
Conclusion
By leveraging AWS CloudWatch Dashboards, you can:- Consolidate metrics, logs, and alarms in a single pane
- Build custom layouts tailored to your workflows
- Monitor in real time across heterogeneous resources
- Interactively drill down into data for root-cause analysis
- Securely share dashboards with fine-grained IAM controls
- Optimize costs with a flexible, usage-based pricing model