This guide explores Prometheus configurations and Kubernetes service discovery for automatic metric scraping from cluster endpoints.
In this guide, we explore the default Prometheus configurations and dive into the Kubernetes service discovery mechanism. Kubernetes provides native service discovery, allowing Prometheus to automatically detect and scrape metrics from various endpoints across your cluster.Below is an overview of the four available service discovery options:
Node Service Discovery: Identifies all nodes within a Kubernetes cluster and captures associated metadata labels.
Service Discovery: Discovers all services along with their designated ports.
Pod Service Discovery: Detects all pods running in the cluster.
HTTP Endpoint Service Discovery: The most flexible method; it uses the HTTP endpoint information (IP address and port) of any Kubernetes resource (pod, service, node, etc.) to discover targets, applying additional label-based filtering.
The default setup utilizes HTTP endpoints exclusively, meaning that Prometheus retrieves and filters targets based on endpoint lookup combined with label matching.
To view the generated configurations, open the Prometheus server or web UI and navigate to Status > Configuration. Although the global settings follow standard practices, the key focus is on the scrape configurations which determine how Prometheus identifies and collects metrics from your endpoints.Below is a sample default scrape configuration:
The configuration above uses Kubernetes service discovery via HTTP endpoints along with a specified kubeconfig file. The job name indicates that this setup is intended for scraping the AlertManager.
The following configuration snippet provides a more detailed setup for scraping the AlertManager endpoint. It follows similar discovery settings and implements targeted relabeling rules:
This configuration leverages relabeling to ensure that only endpoints meeting specific label criteria—particularly those for AlertManager—are included in scraping.
General Kubernetes Service Discovery Configuration
The snippet below illustrates a generic configuration that applies relabeling rules to transform and filter labels for discovered endpoints. It ensures that important labels are preserved and accurately set:
Each relabeling action in this snippet is intended to adjust the target labels, generate unique hashes for addresses, and apply standard Kubernetes service discovery settings with controlled namespace filtering.
For a more refined selection of the AlertManager endpoint, advanced relabeling is applied. This snippet demonstrates how “keep” and “replace” actions work together to uniquely identify the AlertManager target by matching specific labels:
Advanced relabeling helps isolate the AlertManager endpoint by ensuring that only targets with the correct service labels (such as the service app and release) are scraped.
Sometimes additional relabeling steps are required when scraping AlertManager. In the snippet below, temporary labels are set for better endpoint identification:
This configuration relabels jobs with temporary identifiers and retains only those endpoints whose labels match the desired AlertManager criteria.Furthermore, similar patterns can be seen in configurations for other Kubernetes components such as the API server, CoreDNS, kube-controller-manager, and kube-proxy. These use various relabeling techniques to map Kubernetes metadata into Prometheus labels while excluding irrelevant targets.For instance, a typical CoreDNS configuration might look like:
Each rule ensures that meaningful labels are derived from Kubernetes metadata so that only valid monitoring targets (e.g., AlertManager, API server) are included.
Retrieving metrics from the Kubernetes API server involves standard HTTP endpoint discovery complemented by proper authorization and TLS settings. The configuration below outlines the necessary steps:
The final snippet integrates all the individual scrape configurations and service discovery settings. Prometheus automatically detects and monitors a variety of targets, including AlertManager, kubelet instances, the operator, and more:
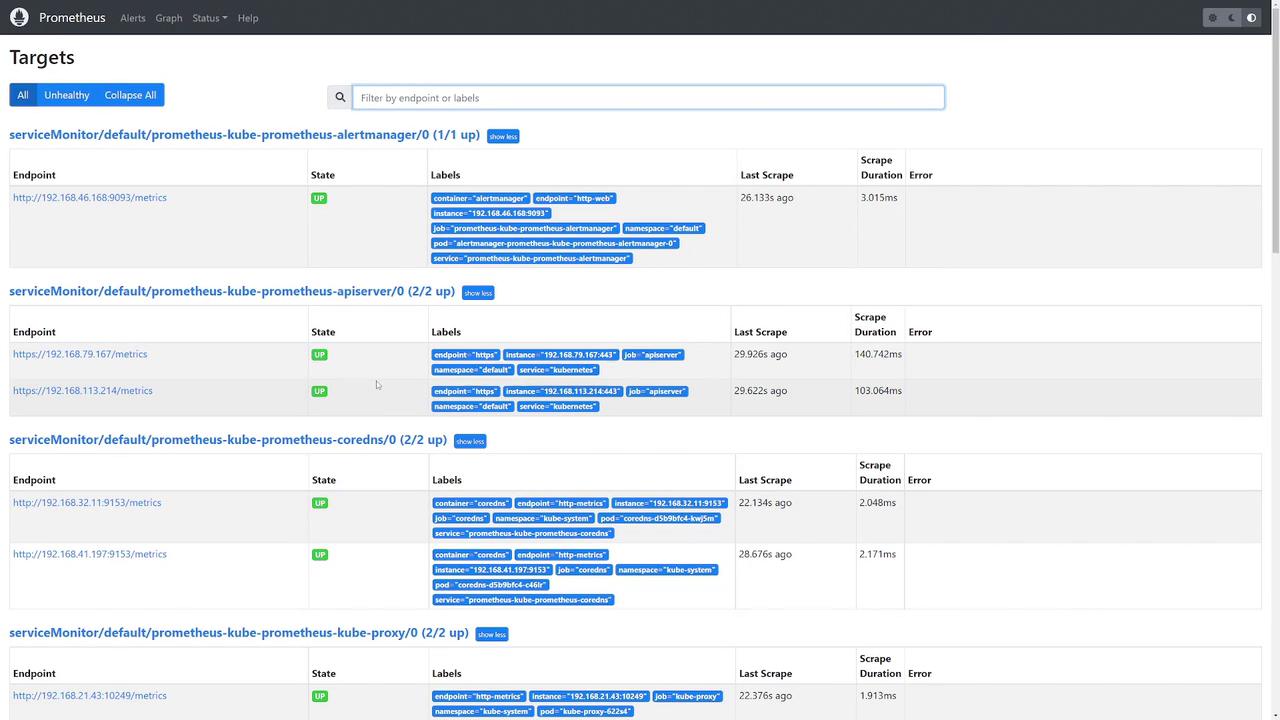
When you check the Prometheus UI, you should see that all configured targets (AlertManager, kubelet instances, the API server, CoreDNS, etc.) are marked as “UP,” confirming that they are actively being monitored.
All these configurations are automatically deployed when you install Prometheus via the Helm chart. There is no need to manually create these extensive relabel configurations, as they are provided per job to ensure seamless target discovery and efficient metric scraping.