Understanding Custom Resource Definitions (CRDs)
The Prometheus Operator deploys several CRDs to provide a high-level abstraction for deploying and configuring Prometheus. Key CRDs include those for AlertManager, Prometheus, and ServiceMonitor. To list all available CRDs, run:What Is a ServiceMonitor?
A ServiceMonitor resource specifies a set of targets for Prometheus to monitor and scrape. Instead of manually editing the Prometheus configuration, you can use Kubernetes’ declarative syntax. When a ServiceMonitor is created, Prometheus discovers it via its selector settings and automatically begins scraping the defined endpoints.
Deploying a Service and ServiceMonitor
Below is an example configuration for deploying a Kubernetes Service and a corresponding ServiceMonitor for an API.Kubernetes Service Definition
ServiceMonitor Definition
- Labels and Selectors:
The ServiceMonitor’sselector.matchLabelsfinds services with the labelapp: service-api. Ensure your Service definition matches this label. - Endpoint Configuration:
The specified endpoint in the ServiceMonitor defines a 30-second scrape interval, uses the port namedweb, and sets the metrics path to/swagger-stats/metrics(customize as needed). - Job Label Mapping:
ThejobLabelproperty maps thejoblabel from your Service resource (e.g.,job: node-api) which Prometheus uses as the job name.
Integrating ServiceMonitor with Prometheus
Prometheus auto-discovers ServiceMonitor resources by using selectors. In the Prometheus custom resource (CR) YAML, you can see a configuration like:release: prometheus in its target list. Ensure that your ServiceMonitor resource carries this label for successful integration.
Applying the Configuration
After updating your deployment configuration (such as inapi-depl.yaml), apply your changes using:
Verifying in Prometheus
After deployment, open the Prometheus UI and navigate to Status → Targets. Your API ServiceMonitor should be listed, indicating that Prometheus is scraping it according to the defined settings.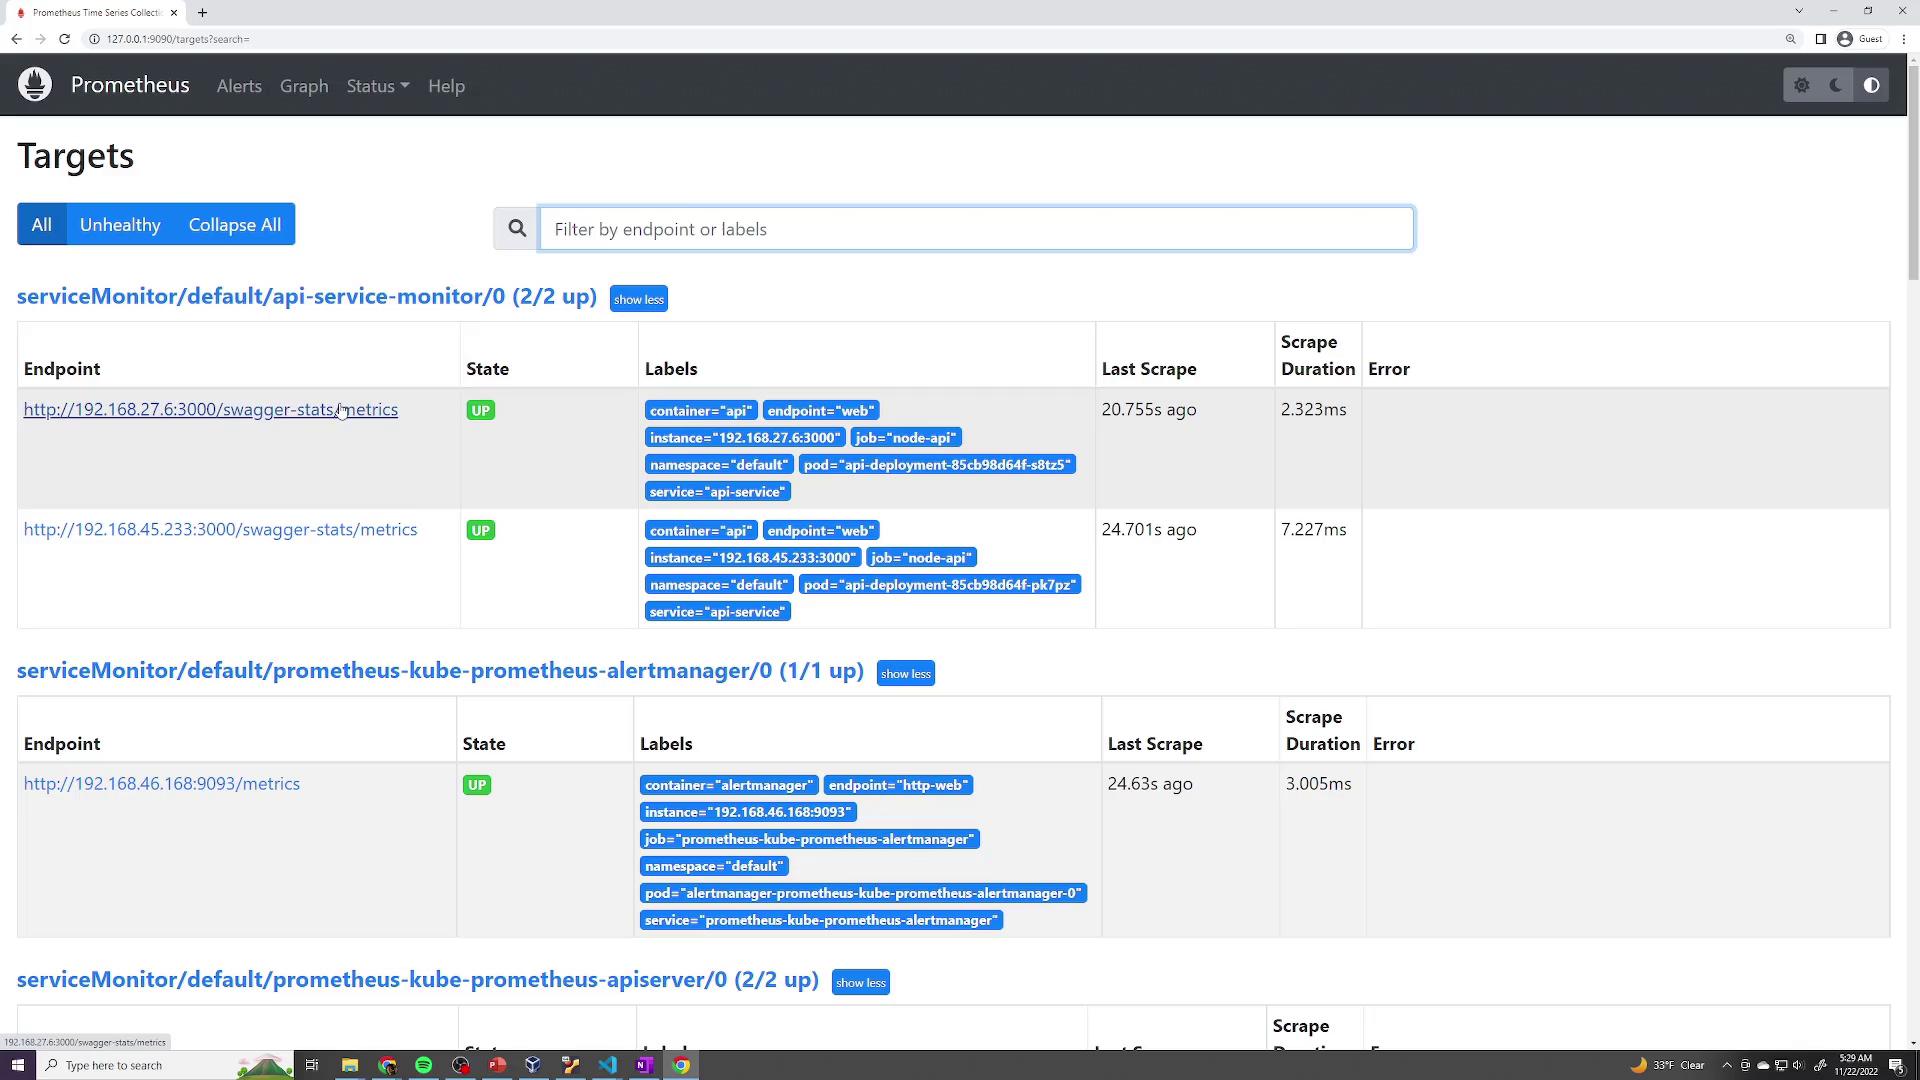
job="node-api" in Prometheus will help verify that the metrics are being collected from the API service.
Reviewing the Final Prometheus Configuration
For an in-depth review, you can inspect the generated Prometheus scrape configuration. This shows that ServiceMonitor settings—includingmetrics_path, scrape_interval, and relabeling configurations—have been correctly applied. Here’s an excerpt from the generated configuration:
Summary
In this lesson, you learned how to:- Leverage Kubernetes CRDs to extend Prometheus functionality.
- Create a ServiceMonitor resource to define additional scrape targets.
- Align your Kubernetes Service labels with ServiceMonitor selectors.
- Verify that Prometheus dynamically scrapes newly added endpoints without manual configuration updates.