This article explores how Prometheus uses selectors and matchers to filter time series data for precise querying and analysis.
In this lesson, we explore how Prometheus uses selectors and matchers to filter time series data. When you query using a metric name like “node_filesystem_avail_bytes”, Prometheus returns every time series that matches this metric. For example:
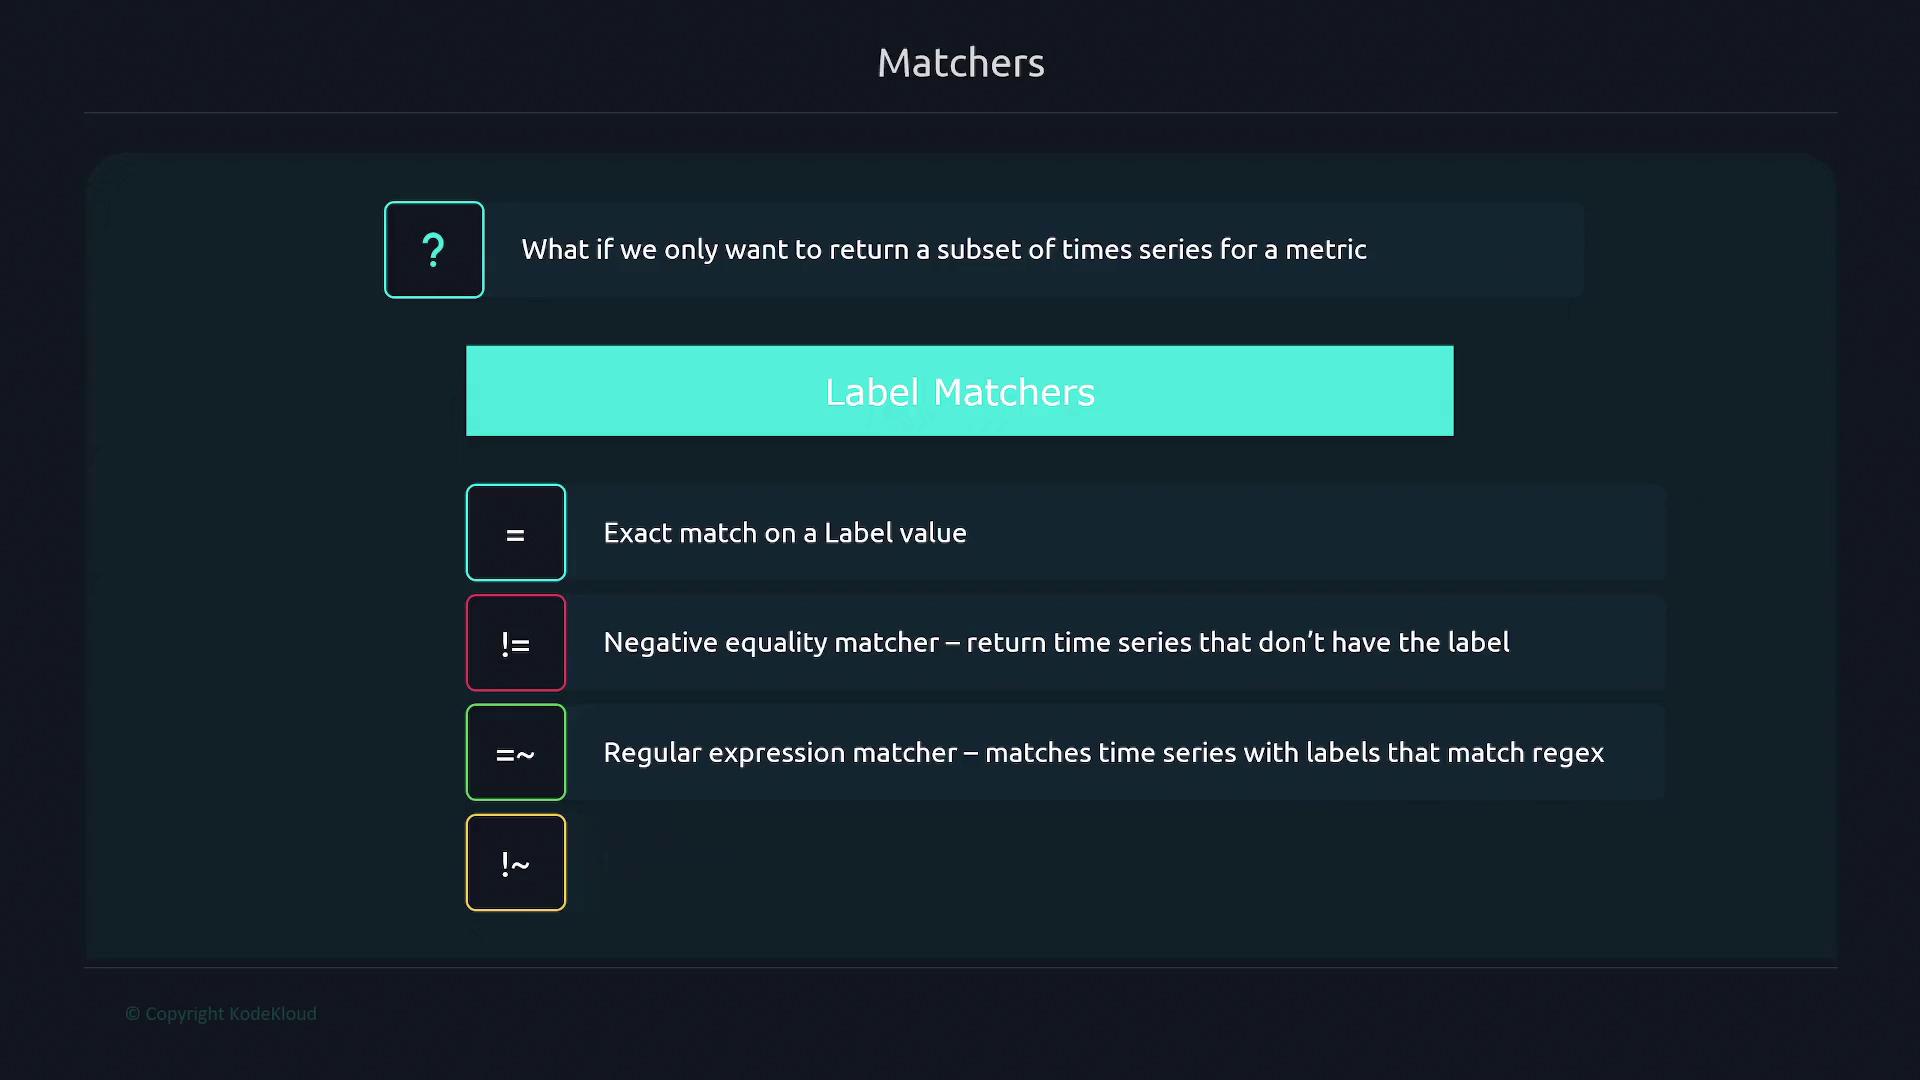
By default, all these time series are returned. However, if you are interested in a specific subset, label matchers allow you to narrow down the results by filtering based on individual label values.
There are several types of label matchers in Prometheus:
The equality matcher returns all time series that have a specific label value. For instance, to filter time series from a specific instance like “node1”, include the label filter within curly braces:
This query returns only those series with the instance label set to “node1”. Note that occasionally, other series might appear grayed out indicating they have been filtered out.
The negative equality matcher helps exclude time series with a particular label value. For example, to filter out time series where the “device” label equals “tmpfs”, you would use:
$ node_filesystem_avail_bytes{device!="tmpfs"}
This query returns time series where the device is not “tmpfs”.
For advanced filtering, you can use the regular expression matcher. Suppose you want to include only time series where the “device” label starts with “/dev/sda” (covering both “/dev/sda2” and “/dev/sda3”). In that case, you can run:
Conversely, to exclude time series based on a regex pattern, you can apply the negative regular expression matcher. For example, to filter out any series where the mountpoint starts with “/boot”, execute:
Prometheus supports combining multiple label selectors within a single query. For example, if you want time series from “node1” that do not have the device label “tmpfs”, you can use:
Range vector selectors allow you to retrieve historical data for a time series over a specified duration. Unlike an instant vector that gives the most recent value, a range vector provides all values scraped over a given period. For instance, to view data for the “node_arp_entries” metric from “node1” over the last 2 minutes, you can use:
The suffix [2m] indicates that the query should return all values recorded over the past 2 minutes.
By mastering selectors and matchers, you can construct precise queries in Prometheus to monitor and analyze only the time series that matter to your observability needs.