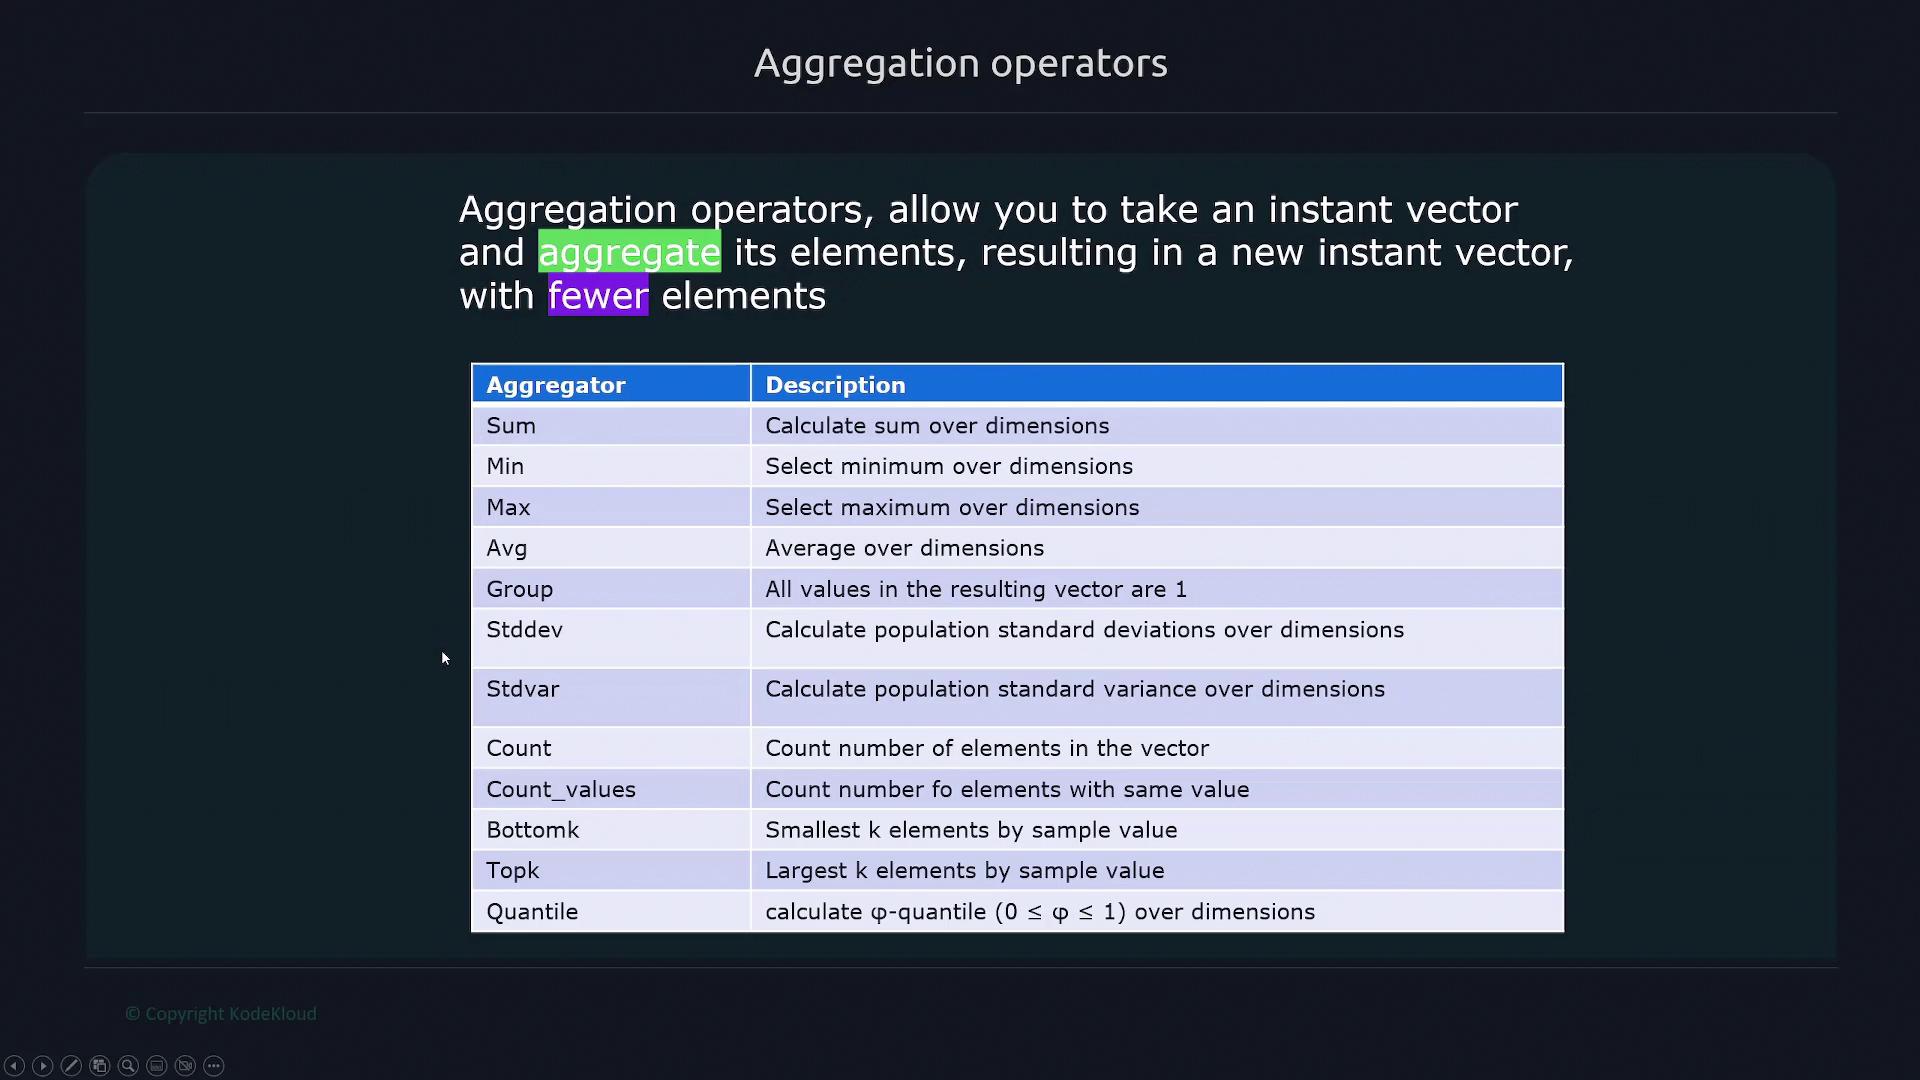
Aggregation operators in Prometheus combine multiple time series into a new instant vector using functions like sum, min, max, and average for data processing.
Aggregation operators are essential tools in Prometheus that allow you to combine multiple time series into a new, typically smaller, instant vector. These operators use functions like sum, min, max, and average to process the data in an instant vector.For example, if you have an HTTP endpoint returning an instant vector containing several time series, applying an aggregation operator (such as sum) to a metric like http_requests will add up the values from all its time series.
Below is a sample output for the http_requests metric along with several aggregation operations:
Each aggregation operator works on every entry within the instant vector. However, you can refine the aggregation by using the by clause to group data along specific labels.
The by keyword allows you to define which label dimensions you want to include when aggregating. For instance, if you need to sum the http_requests metric by the path label, you can use the following query:
You can also group by multiple labels. Consider a scenario where each HTTP request carries an instance label indicating the target node. The aggregated query by both instance and method would look like this:
The without keyword offers the reverse functionality of by. It lets you exclude specific labels from your aggregation. For example, if you wish to group the data based on every label except path, you would write:
$ sum without(path) (http_requests)
This query aggregates the data based on all labels apart from path, such as grouping by method and instance. This technique is particularly useful when you want to eliminate a specific dimension from your analysis.
Aggregation can also be applied to node metrics. Consider node CPU metrics, where each target has multiple CPUs (e.g., CPU 0 and CPU 1).Running a simple sum across all targets and CPUs:
$ sum(node_cpu_seconds_total)
aggregates the values into a single number. If you want to compute the sum per instance, use:
$ sum by(instance)(node_cpu_seconds_total)
For more granular analysis, you can further group by CPU:
Alternatively, if you’d prefer to aggregate by instance while ignoring the cpu label, the without clause comes in handy:
$ sum without(cpu) (node_cpu_seconds_total{cpu="0", instance="192.168.1.168:9100", job="node", mode="iowait"})
This query aggregates across all CPU values while keeping other labels (like instance, job, and mode) intact, providing a comprehensive overview of the CPU metrics on a per-instance basis.
Use the by and without clauses strategically to precisely control your aggregation, ensuring that you extract the specific level of detail required for your analysis.
Aggregation operators in Prometheus enable you to summarize and analyze time series data by grouping data along specific dimensions using by or excluding labels with without. By combining these techniques, you can gain meaningful insights into complex metrics, making your monitoring and analysis more effective.For more detailed explanations on Prometheus features, visit the Prometheus Documentation.