This article explores file service discovery in Prometheus, detailing how to import jobs and configurations from external JSON and YAML files.
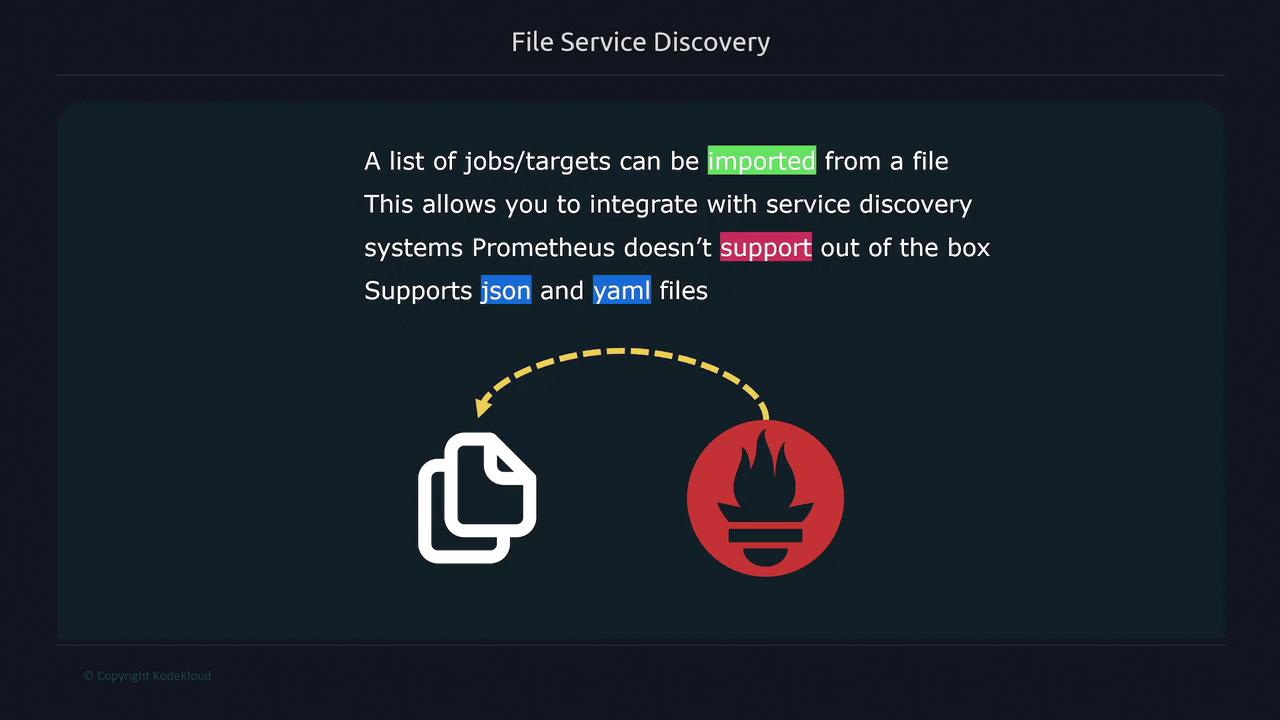
In this lesson, we’ll explore file service discovery—a straightforward yet flexible mechanism to import jobs and target configurations into Prometheus from an external file. Although this method is less dynamic compared to other alternatives, it proves especially useful when integrating with service discovery systems that Prometheus does not directly support.File service discovery supports both JSON and YAML file formats, allowing you to manage configurations in multiple files. This approach provides the flexibility to use any file containing valid configuration data, and you can even leverage glob patterns (e.g., *.json) to include multiple files at once.
When using glob patterns, ensure the pattern correctly matches all intended files to avoid missing any configurations.
To enable file service discovery, add a file_sd_configs block to your Prometheus configuration file (typically named prometheus.yaml). Within this block, specify the file or files holding your configuration details. For example, you can list files individually or use a glob pattern to import all JSON files.
In this setup, Prometheus imports labels and targets defined in the JSON file. For instance:
A job with the label job: node targets specific nodes.
Another job is dedicated to Prometheus monitoring.
A third job is defined for database monitoring.
After configuring file service discovery in your prometheus.yaml, restart Prometheus. On restart, you should see all endpoints appear as if they were defined directly in the configuration file.
Remember to restart Prometheus after updating the configuration to ensure that all new targets are properly detected.
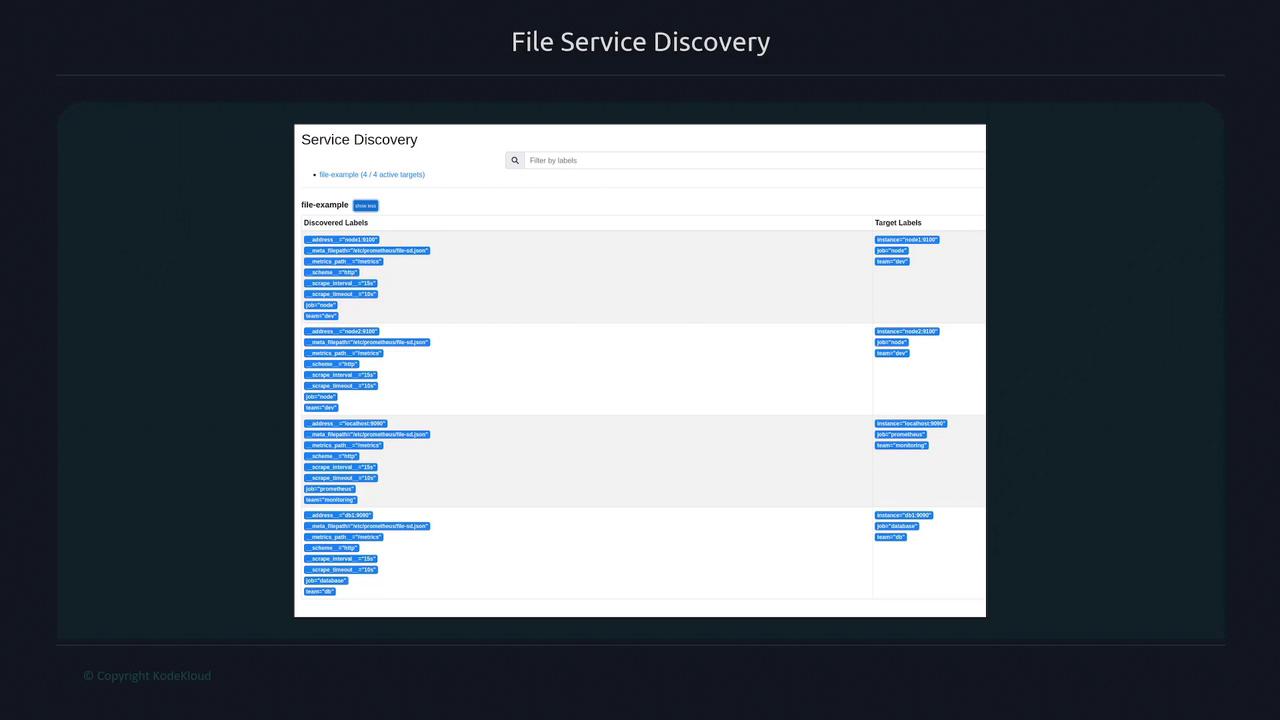
Once Prometheus restarts, navigate to the Status section and then to Service Discovery in the Prometheus dashboard. Here, you can review detailed information about how Prometheus has discovered the endpoints. The interface displays both the original target labels and any additional labels from your file configuration which are used to annotate the scraped metrics.The following figures illustrate key aspects of file service discovery:
File service discovery offers a simple and flexible way to integrate external configuration data into Prometheus. By using external files (JSON or YAML) and incorporating glob patterns, you can easily manage a dynamic set of targets without modifying the Prometheus configuration directly. For additional details, consider reviewing the Prometheus Documentation.This approach is particularly helpful when working with service discovery systems that are not natively supported by Prometheus, providing a seamless bridge that enhances your monitoring capabilities.