Hello everyone — welcome to the first lab. In this hands-on lesson we will reproduce two common Kubernetes cluster issues, troubleshoot them manually, and then repeat the same analysis using KAgent (an AI-assisted Kubernetes agent). The goal is to show how correlating diagnostics (kubectl, events, metrics, quotas) leads to the root cause, and how AI can speed up discovery and remediation. Task summary
ProblemNamespaceSymptom
order-api Service not routing trafficdefaultService exists but has no endpoints; curl to NodePort fails
inventory-service HPA not scaling to minReplicasbackend-appsHPA shows minReplicas=3 but only 1 pod runs; events show pod creation failures
Follow a reproducible troubleshooting pattern: observe symptoms, gather cluster state (svc/pods/endpoints/events/metrics/quotas), link evidence to possible causes, and apply the smallest safe remediation. Use kubectl + events + metrics to avoid misdirection.

Task 1 — Order API: Service exists but traffic not routed

Reproduce symptom:
  1. From the host try the NodePort:
curl http://localhost:30081
(Initially this will fail because the Service has no endpoints.)
  1. Gather basic cluster state in the default namespace:
kubectl get svc -n default
kubectl get pods -n default --show-labels
kubectl get endpoints -n default
You should see the order-api Service present but with empty endpoints. Inspect the Service manifest to check selectors:
metadata:
  annotations:
    kubectl.kubernetes.io/last-applied-configuration: |
      {"apiVersion":"v1","kind":"Service","metadata":{"annotations":{},"name":"order-api","namespace":"default"},"spec":{"ports":[{"nodePort":30081,"port":80,"targetPort":80}],"selector":{"app":"order-api","version":"v1"},"type":"NodePort"}}
  creationTimestamp: "2025-12-16T10:29:13Z"
  name: order-api
  namespace: default
spec:
  clusterIP: 10.43.187.240
  ports:
  - nodePort: 30081
    port: 80
    protocol: TCP
    targetPort: 80
  selector:
    app: order-api
    version: v1
  type: NodePort
Diagnosis:
  • Running pods show label app=order-api but version=v2 (pod template uses v2).
  • The Service selector is version=v1. This selector mismatch means the Service selects no pods → no endpoints → traffic not routed.
Fix options:
  • Edit the Service selector to match pods, or update the Deployment labels to match the Service.
  • To change the Service selector to v2 (example using kubectl patch):
kubectl patch svc order-api -n default --type='json' -p='[{"op":"replace","path":"/spec/selector/version","value":"v2"}]'
  • Alternatively, edit the Service interactively:
kubectl edit svc order-api -n default
# change spec.selector.version: v1 -> v2
Verify:
kubectl get endpoints -n default
curl http://localhost:30081
After the fix the Service endpoints are populated and the curl returns the application page (or the pod’s default page if using an nginx image). Root cause: label/selector mismatch (version=v1 vs version=v2) between the Service and the Deployment pods.

Task 2 — HPA not reaching minReplicas in backend-apps

Scenario: An HPA is configured for inventory-service with:
  • CPU target: 80%
  • minReplicas: 3
  • maxReplicas: 10
Steps to investigate:
  1. Inspect HPA and pods:
kubectl get hpa -n backend-apps
kubectl get pods -n backend-apps
Example HPA output:
NAME                   REFERENCE                       TARGETS         MINPODS   MAXPODS   REPLICAS   AGE
inventory-service      Deployment/inventory-service    cpu: 0%/80%     3         10        3          22m
But pods show only 1 replica running.
  1. Describe the HPA to view events/conditions:
kubectl describe hpa -n backend-apps
You may see events like:
Warning  FailedGetResourceMetric      failed to get cpu utilization: unable to get metrics for resource cpu: no metrics returned from resource metrics API
Warning  FailedComputeMetricsReplicas invalid metrics (1 invalid out of 1), first error is: failed to get cpu resource metric value
  1. Check cluster metrics availability:
kubectl top nodes
If kubectl top nodes returns values, node metrics server is responding. HPA CPU/resource metrics may still be affected if Pods’ metrics are missing or metrics-server has issues.
  1. Inspect namespace events for pod creation failures:
kubectl get events -n backend-apps --sort-by='.lastTimestamp'
Look for events such as Pod ... Forbidden: exceeded quota or FailedScheduling.
  1. Check ResourceQuota in the namespace:
kubectl get resourcequota -n backend-apps
Example output:
NAME               REQUEST                                                        AGE   LIMIT
compute-quota      pods: 1/1, requests.cpu: 100m/2, requests.memory: 128Mi/2903Mi    25m   limits.cpu: 200m/2, limits.memory: 256Mi/2903Mi
Here the namespace quota limits pods to 1/1, preventing the HPA from creating the minReplicas=3. Fix:
  • Update the ResourceQuota to allow more pods (for example pods: 10) or adjust quota to match expected application scale.
kubectl edit resourcequota compute-quota -n backend-apps
# change pods: 1 to pods: 10 (or apply an updated manifest)
kubectl rollout restart deployment inventory-service -n backend-apps
  • After increasing the quota, the cluster can create additional pods and the HPA should converge to the desired replicas.
Verify:
kubectl get pods -n backend-apps
kubectl get events -n backend-apps --sort-by='.lastTimestamp'
kubectl describe hpa -n backend-apps
Important diagnosis notes:
  • The HPA warnings about metrics indicate a metrics failure path that should be investigated (metrics-server, kubelet metrics, scraping), but the immediate blocker preventing scale-up was the ResourceQuota restricting pods to 1. Always correlate events + quotas + metrics to determine the decisive cause.
Do not increase namespace quotas indiscriminately in production. Align quota changes with capacity planning and organizational policies. If unsure, request approval or test changes in a non-production environment first.

Manual troubleshooting summary

IssueEvidenceFix
order-api Service no endpointsService selector version=v1 vs pods version=v2Patch Service selector to v2 or reconcile Deployment labels
inventory-service HPA not scalingHPA shows metric errors; events show pods: 1/1 quotaIncrease namespace ResourceQuota pods limit and re-rollout deployment
Troubleshooting tip: Combine kubectl get/describe, events, metrics (kubectl top), and namespace quotas to build the causal chain.

KAgent: AI-powered Kubernetes troubleshooting

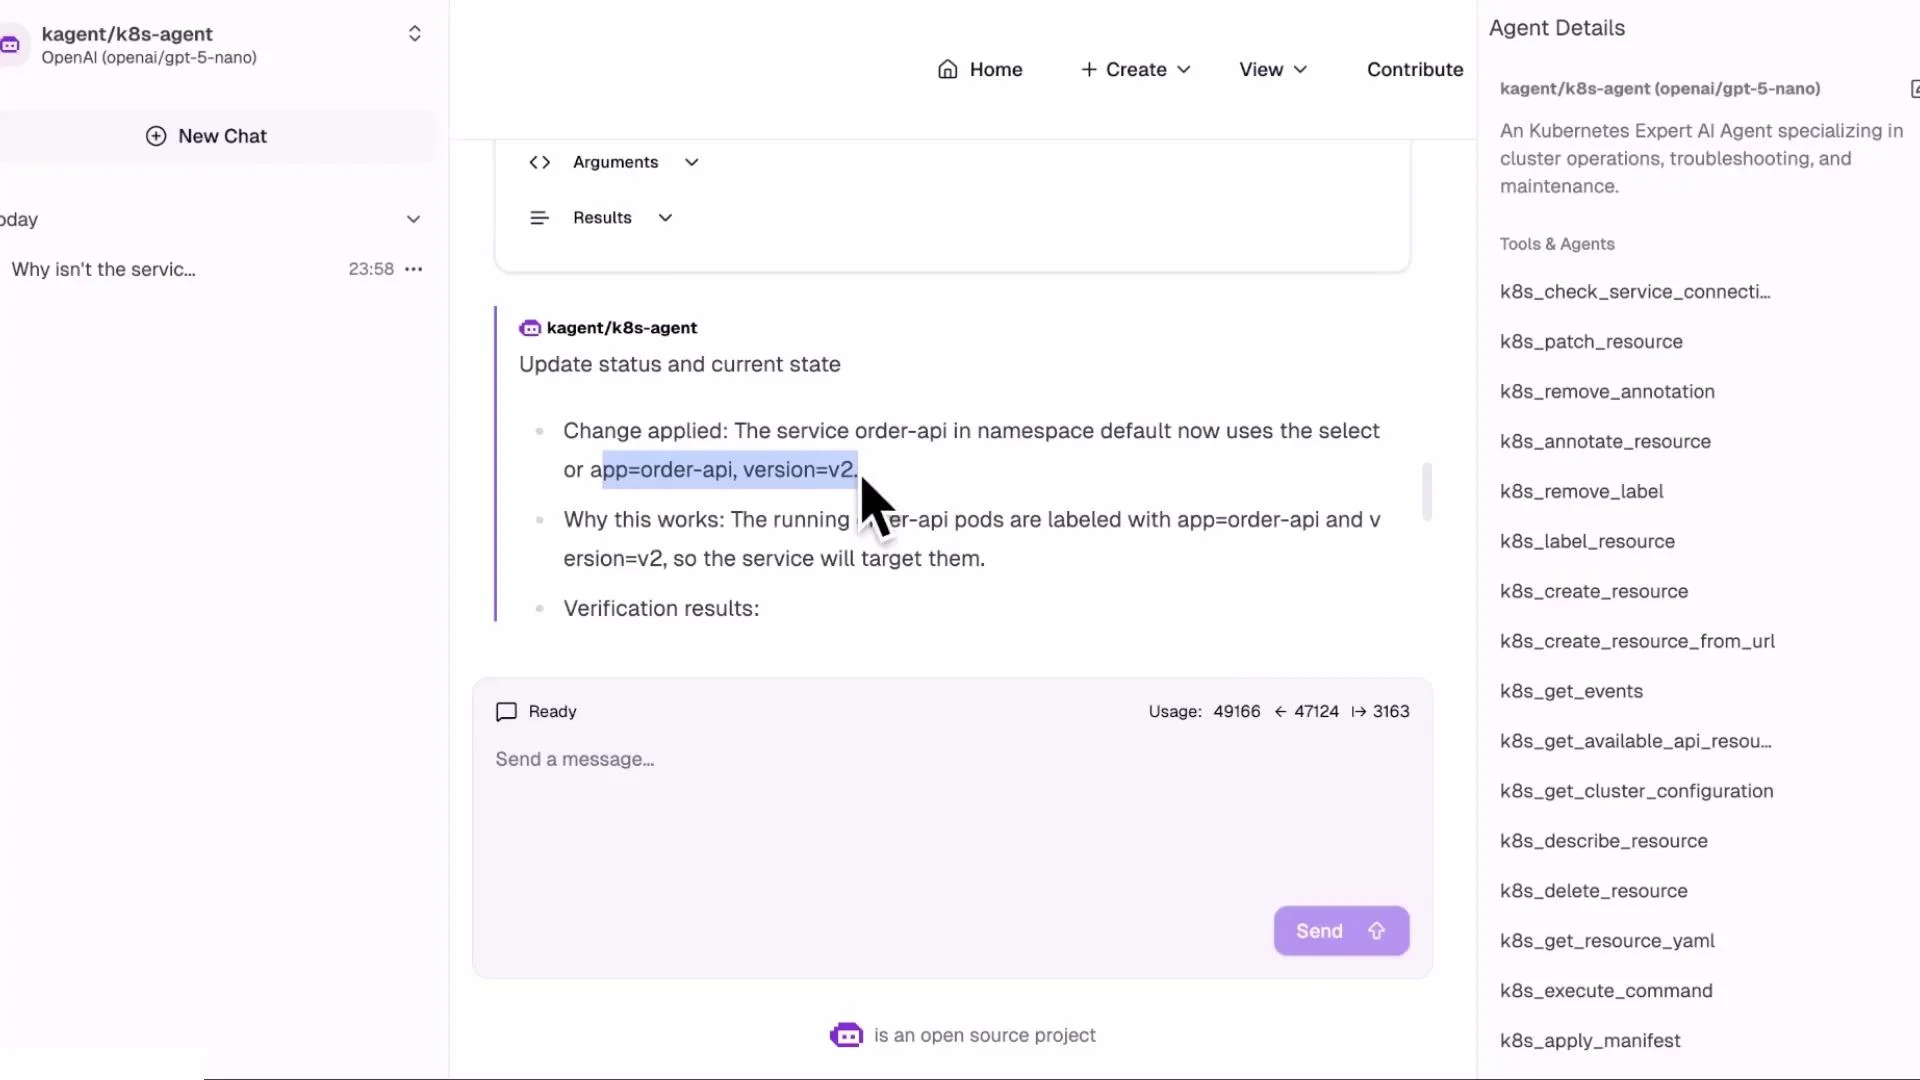
KAgent exposes a chat-style UI and executes a defined toolset (get resources, describe, get YAML, apply manifests, etc.). When given a natural language prompt such as: “Why isn’t the service order-api in namespace default routing?” the agent runs investigative commands, aggregates the results, and sends them to an LLM for analysis. The agent can iterate (requesting additional data) until it provides a prioritized diagnosis and actionable remediation. Example metadata the agent uses to identify resources:
{
  "namespace": "default",
  "resource_name": "order-api",
  "resource_type": "service"
}
The agent detects the selector mismatch (version=v1 vs pods version=v2), recommends updating the Service selector to version=v2, and can apply that change automatically (via a manifest or kubectl apply) and then re-check endpoints.
A screenshot of a chat interface for a Kubernetes agent (kagent/k8s-agent) showing a message that the service "order-api" now uses the selector app=order-api, version=v2. The right sidebar lists available k8s tools and agent details while a cursor highlights the selector text.
KAgent follows a similar investigation for the HPA + 
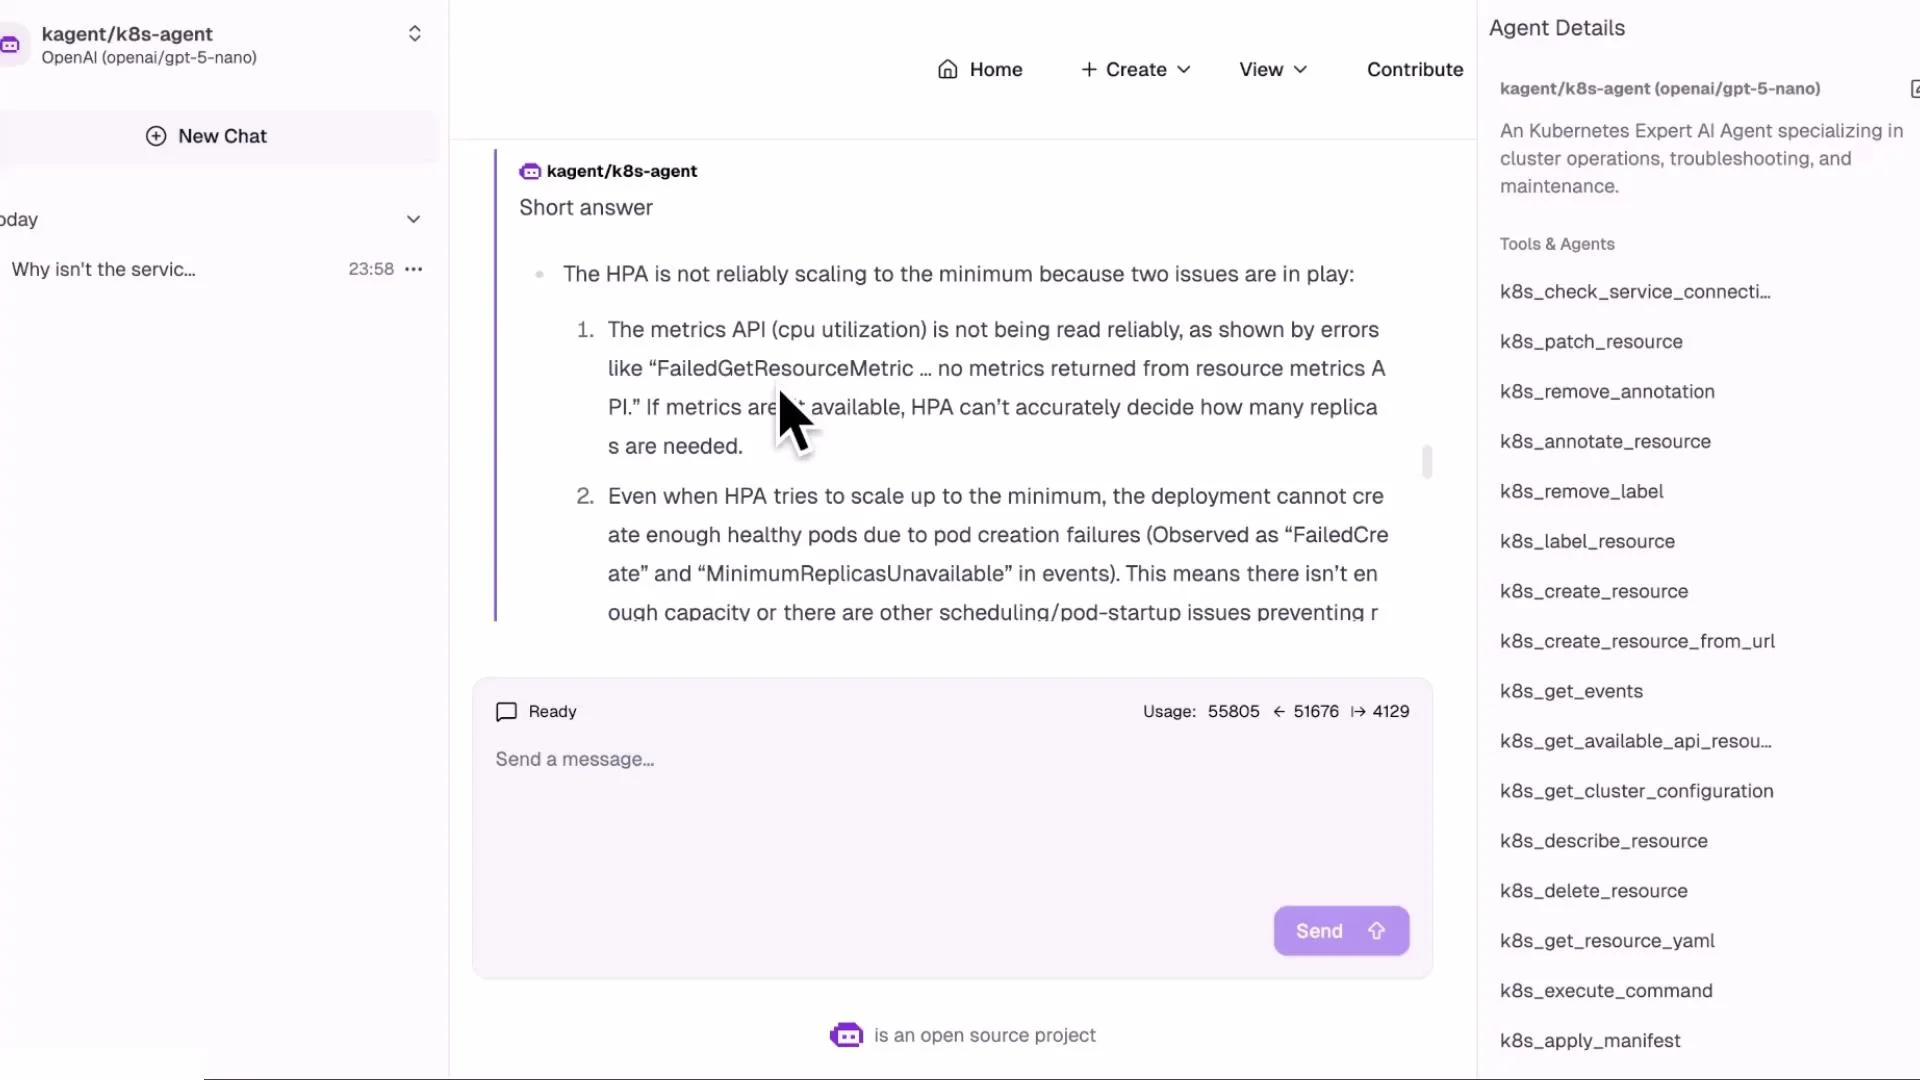
inventory-service: describe HPA, check events, inspect ReplicaSet/Deployment, and verify ResourceQuota. It produces a prioritized list of causes (metrics-server issues vs quota) and recommends changing the ResourceQuota to allow more pods as the decisive remediation.
A screenshot of a chat-style web UI showing an AI agent response titled "kagent/k8s-agent" with troubleshooting steps about a Kubernetes HPA not scaling, and a text input box at the bottom. The right sidebar lists k8s tools/commands while the left shows the chat list.
Advantages of using KAgent
  • Natural language triage: describe the issue in plain English and let the agent gather evidence.
  • Faster discovery: consistent, repeatable investigative flow reduces manual rework.
  • Evidence surfacing: shows exactly which commands and outputs lead to a conclusion.
  • Improved MTTR and operational consistency across teams.

Closing and next steps

In this lesson we:
  • Manually diagnosed two common Kubernetes problems: a Service selector mismatch and a namespace ResourceQuota preventing HPA scaling.
  • Demonstrated how KAgent can automate the same investigative steps and recommend or perform safe remediation.
Next lessons will cover:
  • Building custom agents and configuring LLM providers
  • Defining a safe toolset and guardrails for automated remediation
  • Instrumenting clusters to improve metrics and observability
References and further reading

Watch Video

Practice Lab