This guide explains how to configure a Prometheus server to scrape metrics from one or multiple nodes.
This guide explains how to configure a Prometheus server to scrape metrics from one or multiple nodes. After installing Prometheus and setting up your nodes with Node Exporters to expose metrics, you must explicitly configure Prometheus to discover and scrape these targets using its pull-based model.The configuration is maintained in the prometheus.yaml file, typically found in the /etc/prometheus directory.Below is a basic Prometheus configuration example:
# my global configglobal: scrape_configs: - job_name: "prometheus" static_configs: - targets: ["localhost:9090"]
In this configuration:
The global section defines default parameters, which can be inherited or overridden by other sections.
The scrape_configs section specifies the target endpoints for scraping metrics.
Prometheus uses the scrape_configs block to identify targets for metric collection. In this enhanced example, additional parameters—such as scrape_interval, scrape_timeout, and sample_limit—allow you to fine-tune the scraper’s behavior.
global: scrape_interval: 1m scrape_timeout: 10sscrape_configs: - job_name: 'node' scrape_interval: 15s scrape_timeout: 5s sample_limit: 1000 static_configs: - targets: ['172.16.12.1:9090']# Configuration related to AlertManageralerting:# Rule files specifying where rules are read fromrule_files:# Remote read/write settingsremote_read:remote_write:# Storage-related settingsstorage:
Key points in this configuration:
Global defaults specify a 1-minute scrape interval and a 10-second timeout.
The node job overrides these defaults, setting a 15-second interval and a 5-second timeout.
The static_configs block clearly indicates the target IP and port for scraping metrics.
Additional configuration blocks like alerting, rule_files, remote_read, remote_write, and storage are available for extended use cases.
When adding a new job under scrape_configs, you must specify details such as the job name, scrape interval, timeout, scheme (HTTP/HTTPS), and the metrics path. By default, Prometheus scrapes metrics from the /metrics endpoint; however, customization is possible if your target uses a different endpoint.For instance, the following configuration demonstrates how to scrape two targets over HTTPS using a custom metrics path:
After modifying the prometheus.yaml file, Prometheus does not automatically reload changes. You must restart the Prometheus process. If running Prometheus manually (e.g., using ./prometheus), you can simply press Ctrl+C and restart the process. For Prometheus running under systemd, use one of the following methods:
$ ctrl+c -> ./prometheus$ kill -HUP <pid>
Or restart via systemd with:
sudo systemctl restart prometheus
Consider an updated prometheus.yaml configuration that adds a new job for scraping a Node Exporter on a specific Linux machine:
# my global configglobal: scrape_interval: 15s # Scrape every 15 seconds (default is 1 minute). evaluation_interval: 15s # Evaluate rules every 15 seconds (default is 1 minute). # scramble_timeout uses the global default (10s).# Alertmanager configurationalerting: alertmanagers: - static_configs: - targets: - alertmanager:9093# Load rules periodically based on the global evaluation interval.rule_files: # - "first_rules.yml" # - "second_rules.yml"# Scrape configuration:# Prometheus scrapes itself via the "prometheus" job.scrape_configs: - job_name: "prometheus" # metrics_path defaults to `/metrics` # scheme defaults to `http`. static_configs: - targets: ["localhost:9090"] - job_name: "node" static_configs: - targets: ["192.168.1.168:9100"]
In this updated configuration:
The prometheus job continues to scrape Prometheus itself.
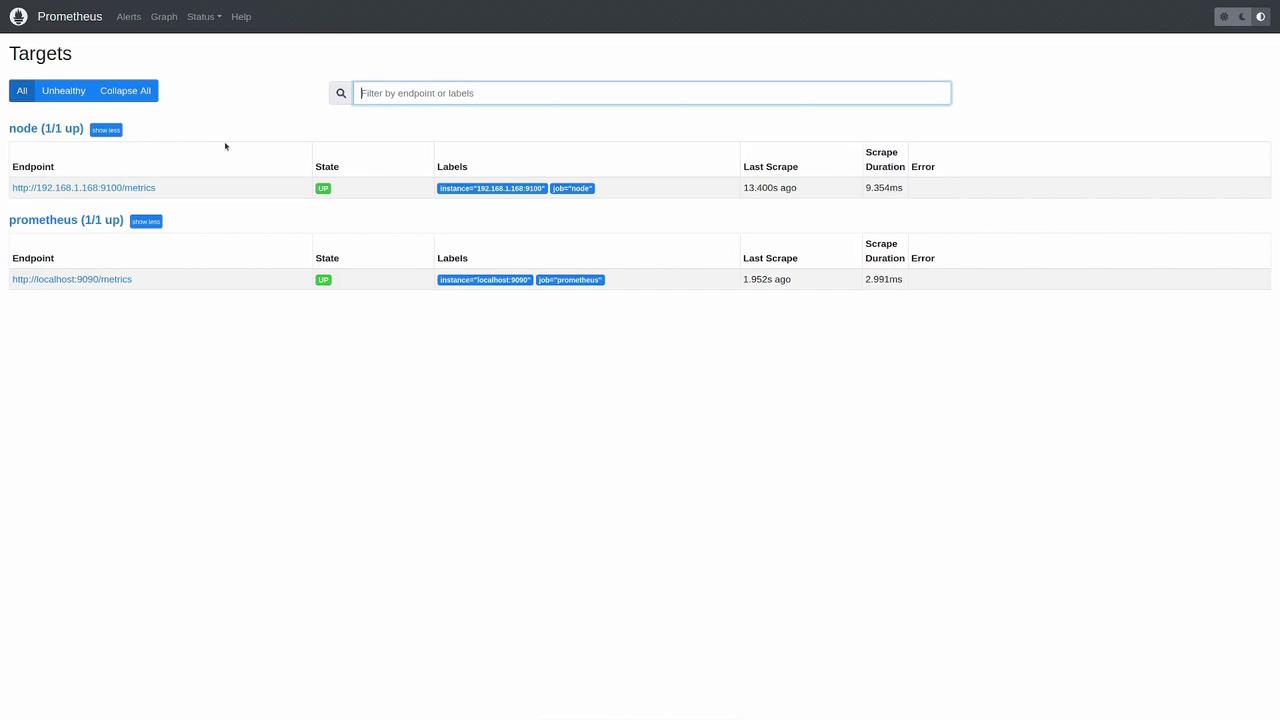
A new node job is added to scrape a Linux machine running Node Exporter on IP 192.168.1.168 at port 9100.
After updating the configuration, restart the Prometheus service to apply the changes:
user1 in ~/prometheus-2.37.2.linux-amd64➜ sudo vi /etc/prometheus/prometheus.ymluser1 in ~/prometheus-2.37.2.linux-amd64 took 1m52s➜ sudo systemctl restart prometheus
Remember to save your changes to prometheus.yaml and restart Prometheus to apply the new configuration.
After restarting Prometheus, open the Prometheus web UI and navigate to the “Status” -> “Targets” page. Here you can inspect all configured targets and their scrape status. Both the Prometheus target and the new node target should display an “UP” status for successful metric collection.
You can further verify the configuration by executing queries such as:
A returned value of 1 confirms that the instances are active and functional.This article demonstrated how to modify your Prometheus configuration file to add new scrape targets and adjust parameters such as scrape interval, timeout, and metrics path. By following these steps, Prometheus can successfully collect metrics from both itself and external nodes running Node Exporters.