Unified Metrics Aggregation
Organizations with multiple data centers and cloud services, such as AWS, face challenges in monitoring distributed environments. Imagine an enterprise with data centers spread across the West, Central, and East regions, alongside cloud-based services. The objective is to aggregate metrics from these diverse sources and present them in a single, easy-to-read dashboard. Prometheus is designed to scrape metrics from various locations, whether on-premises or cloud-based, and provides built-in dashboarding utilities to display the data in a consolidated view.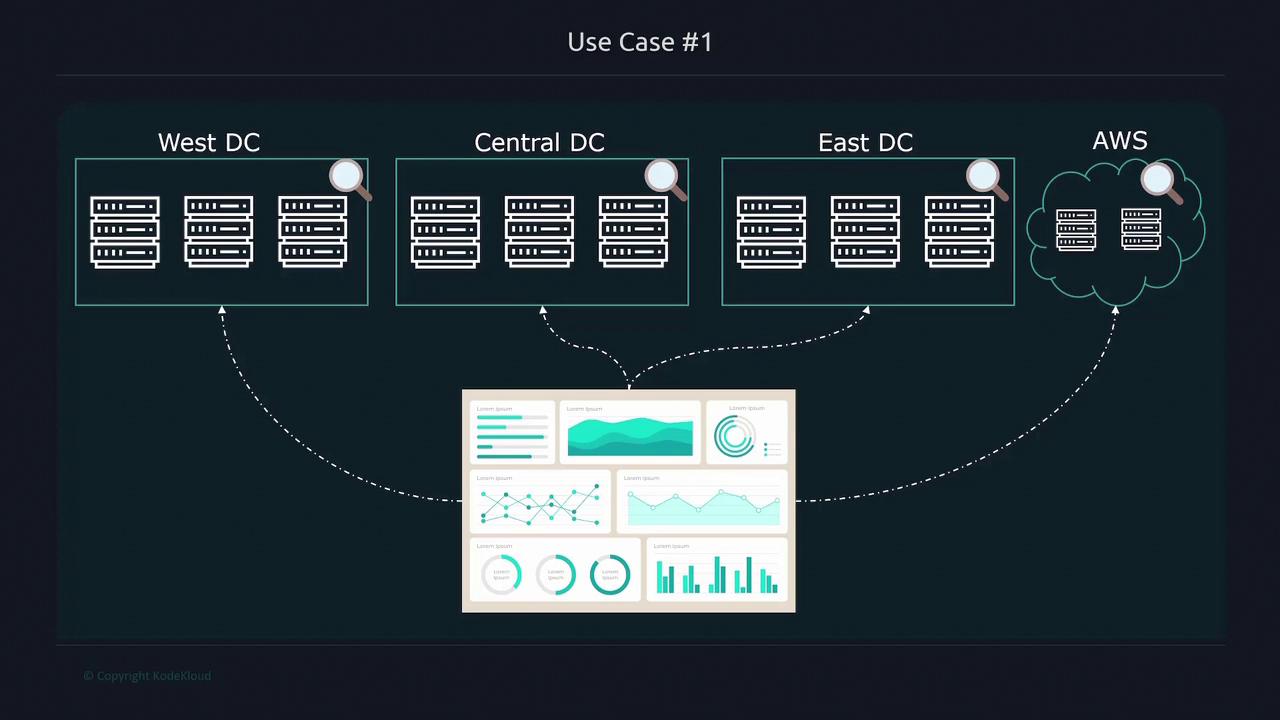
Proactive Alerting for Server Health
A common scenario for Prometheus involves monitoring server resources. Consider a MySQL database server that experiences high memory usage, potentially leading to outages. Operations teams need to be alerted when memory consumption reaches a critical level (for example, 80% usage) so they can intervene before users experience disruptions. Prometheus offers built-in alerting mechanisms. When a metric exceeds a predefined threshold, it can trigger notifications through various channels such as email, Slack, or SMS.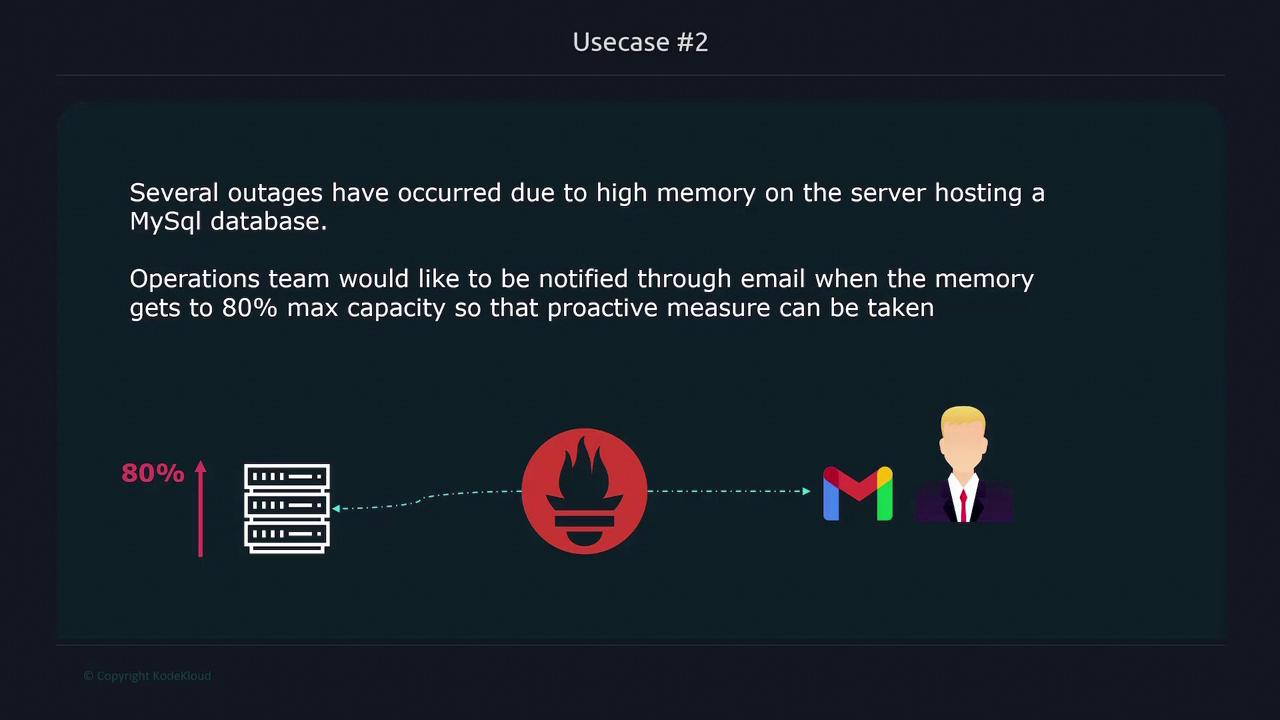
To configure alerting:
- Define metric queries in Prometheus.
- Set threshold rules.
- Integrate with your preferred notification systems.
Performance Analysis for New Features
When introducing new functionalities, such as a video upload feature on a website, performance monitoring becomes crucial. For instance, if large file uploads lead to increased latency, it is important to determine the file size at which performance degrades significantly. By collecting metrics on both average file size and request latency, Prometheus enables teams to correlate these values and pinpoint the threshold at which performance issues occur. Its visualization tools graphically represent this analysis, supporting further performance optimization.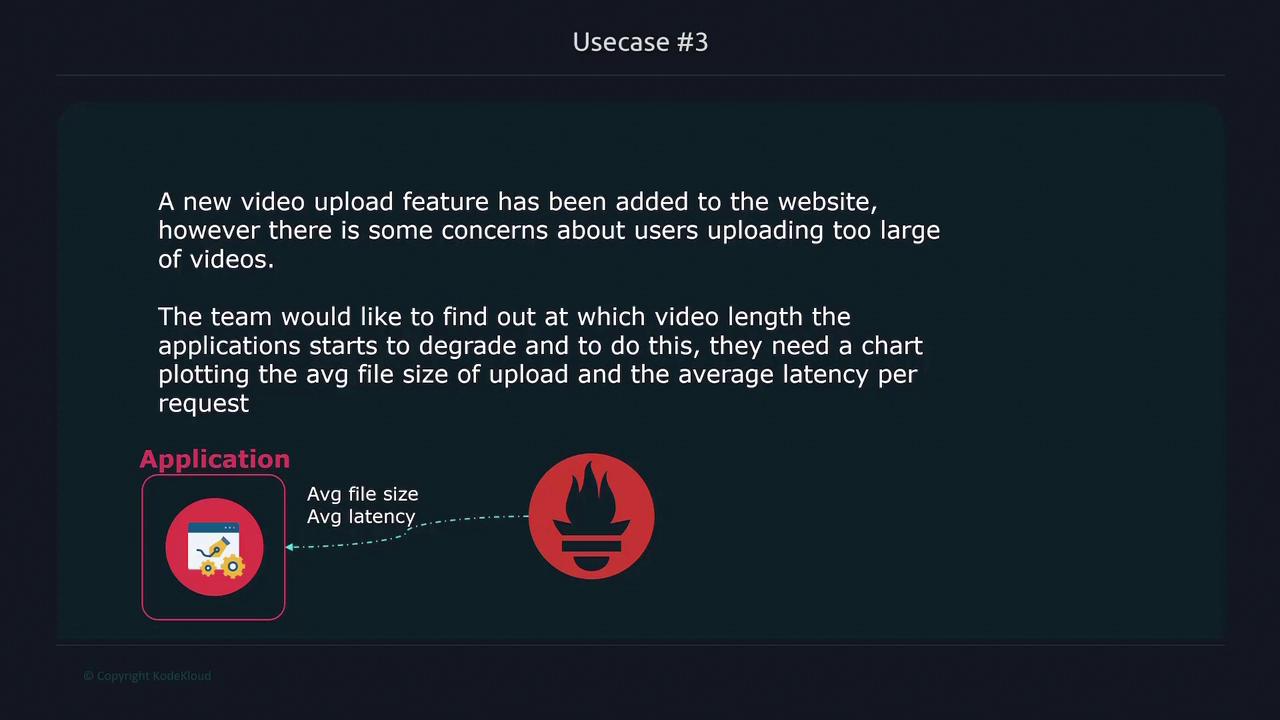
Summary of Prometheus Capabilities
Prometheus is a versatile tool that provides critical monitoring solutions, including:- Aggregated Metrics Display: Collect metrics from distributed data centers and cloud services into a unified dashboard.
- Proactive Alerting: Monitor key performance indicators and trigger alerts to prevent potential outages.
- Feature Performance Analysis: Analyze the impact of new application features to maintain optimal performance.
Leveraging Prometheus allows teams to maintain reliable, high-performing infrastructure by proactively identifying and addressing potential issues.