

elastic-stack namespace so every node ships container logs to Elasticsearch.
Context: where we are
Bob starts in theelastic-stack namespace, where two pods already run: one app that writes user events and elasticsearch-0. Everything we create goes into that same namespace.
Create a working folder on the host to hold the Fluentd configuration that will be mounted into each DaemonSet pod:
fluent.conf you place there.
Who is Fluentd to Kubernetes?
Fluentd needs to ask the Kubernetes API server about pods and namespaces (so it can discover containers to tail). That means you must give Fluentd an identity and the minimal permissions it needs.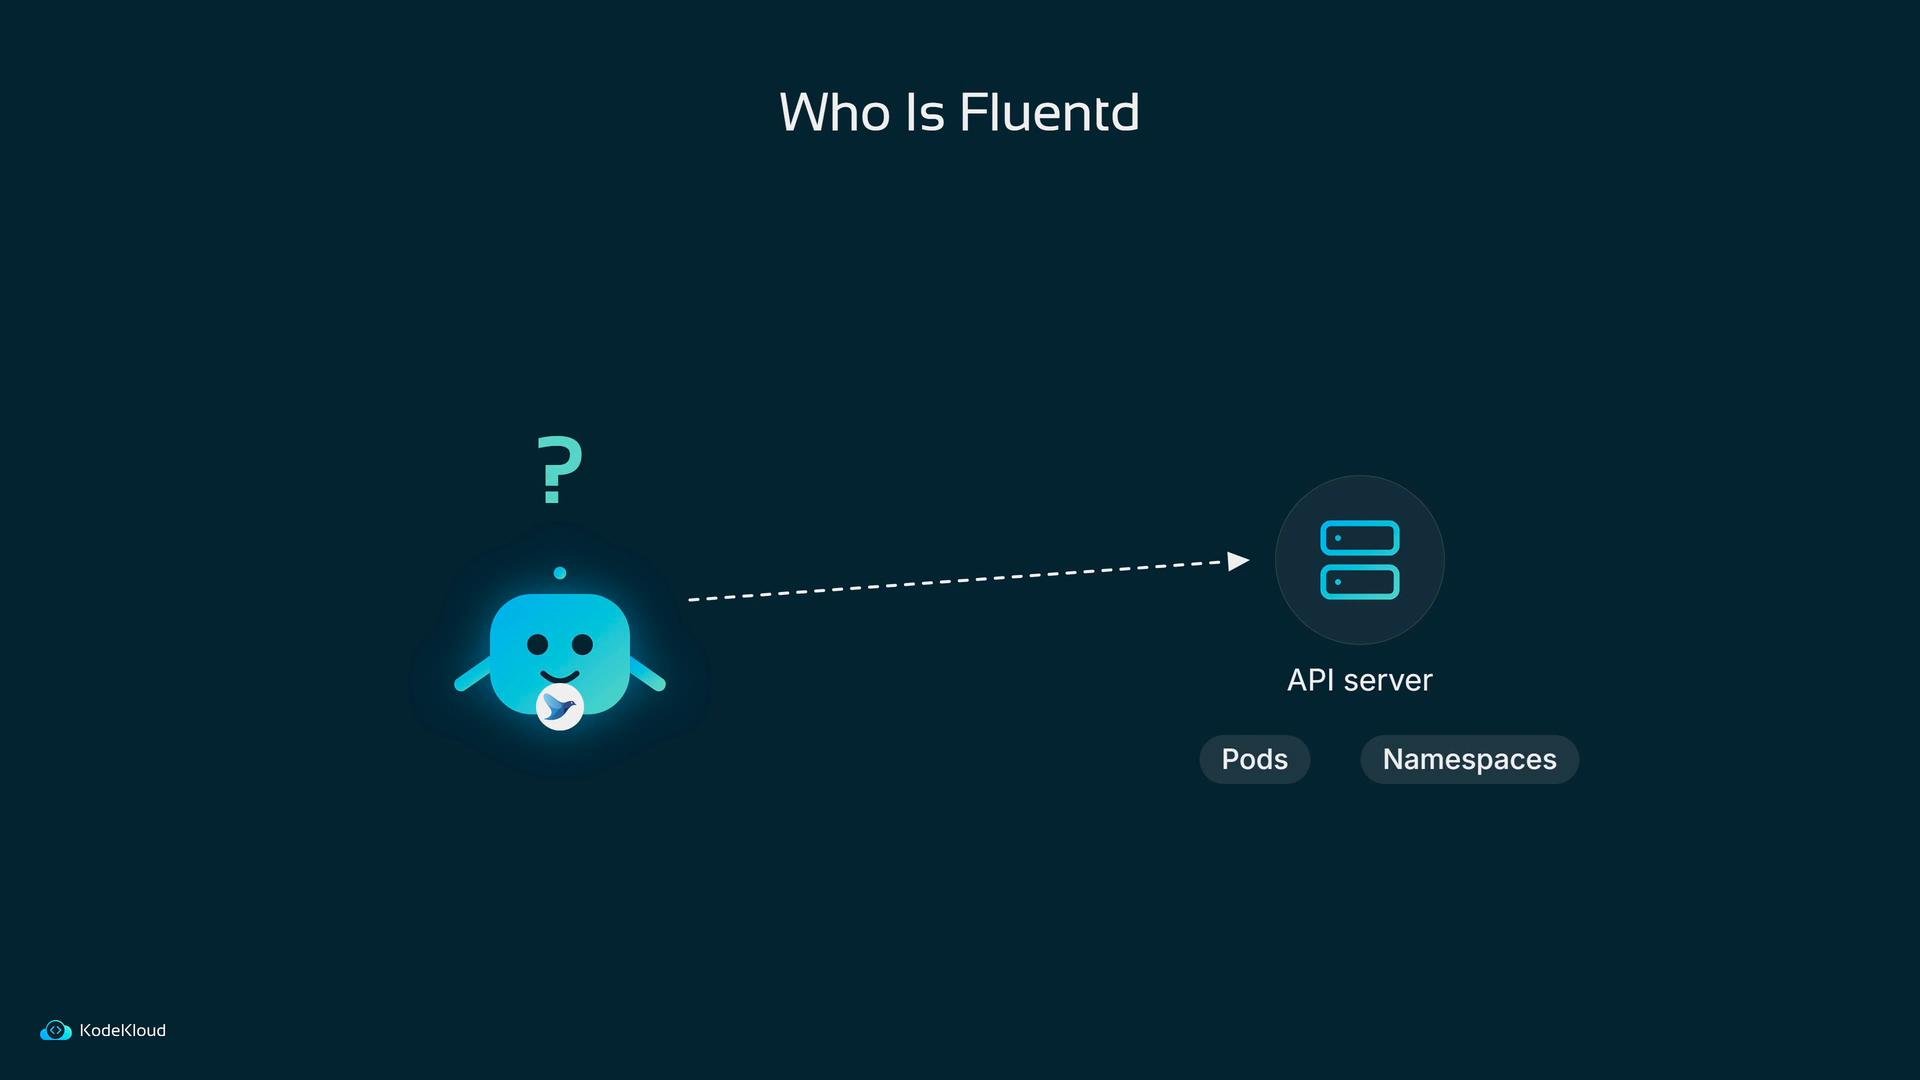
RBAC objects to create
Bob creates three small RBAC objects:- A ServiceAccount named
fluentdinelastic-stack(the pod identity). - A ClusterRole named
fluentdgranting read-only access topodsandnamespaces. - A ClusterRoleBinding that binds the ClusterRole to the ServiceAccount.
fluentd ServiceAccount query the API server to list and watch pods and namespaces — and nothing else.
Example commands Bob ran:
Fluentd configuration: how a log line flows
Create the config folder on the host, and createfluent.conf inside it:
/root/fluentd/etc from the host into /fluentd/etc in each pod, so whatever you put there is what Fluentd reads on startup.
Below is a walkthrough of the main pieces in fluent.conf, in the order a log line meets them:
- source: tails files under
/var/log/containers/*.log(container runtime symlinks). A smallpos_fileensures Fluentd resumes where it left off after a restart. Fluentd excludes its own container logs to avoid self-collection and setsread_from_headso it reads existing files from the beginning. - parse: a nested
<parse>block uses@type jsonto parse each line produced by the container runtime into fields such astime,stream, andlog. - match: captures all records and forwards them to Elasticsearch. Documents are written in Logstash format to an index prefixed
fluentd-YYYY.MM.DD. A buffer flushes every 5s andretry_forever trueretains records until Elasticsearch accepts them.
fluent.conf (tailing Kubernetes container logs and shipping to Elasticsearch):
DaemonSet manifest highlights
Bob deploys Fluentd as a DaemonSet so one collector runs on each node and tails logs from the node filesystem. Key manifest decisions:- Image: a Fluentd build for Kubernetes + Elasticsearch 7:
fluent/fluentd-kubernetes-daemonset:v1.14.1-debian-elasticsearch7-1.0 - Environment variables configure Elasticsearch host, port, scheme, and Logstash prefix.
- A toleration allows scheduling on control-plane nodes (where workloads may also run).
- Important host mounts:
/var/log(node logs)/var/lib/docker/containers(container runtime files, read-only)- host path
/root/fluentd/etc→/fluentd/etc(Fluentd config)
- Resource limit: memory 512Mi to avoid a collector consuming an entire node.
jsonpath check verifies the exact image on the DaemonSet template so typos are easy to catch.
Kubernetes then schedules a Fluentd pod onto each node. Each pod runs with the fluentd ServiceAccount and uses the mounted host config.
Verifying logs reach Elasticsearch
After Fluentd pods are running, confirm documents arrive in Elasticsearch and that they contain your app logs (log field). From a pod in the same namespace you can query the cluster IP service:
List indices to confirm fluentd-* exists:
log containing app output such as USER1 logged in):
fluentd-* indices and documents with the log field containing your application messages, Fluentd is correctly tailing container logs and shipping them to Elasticsearch.
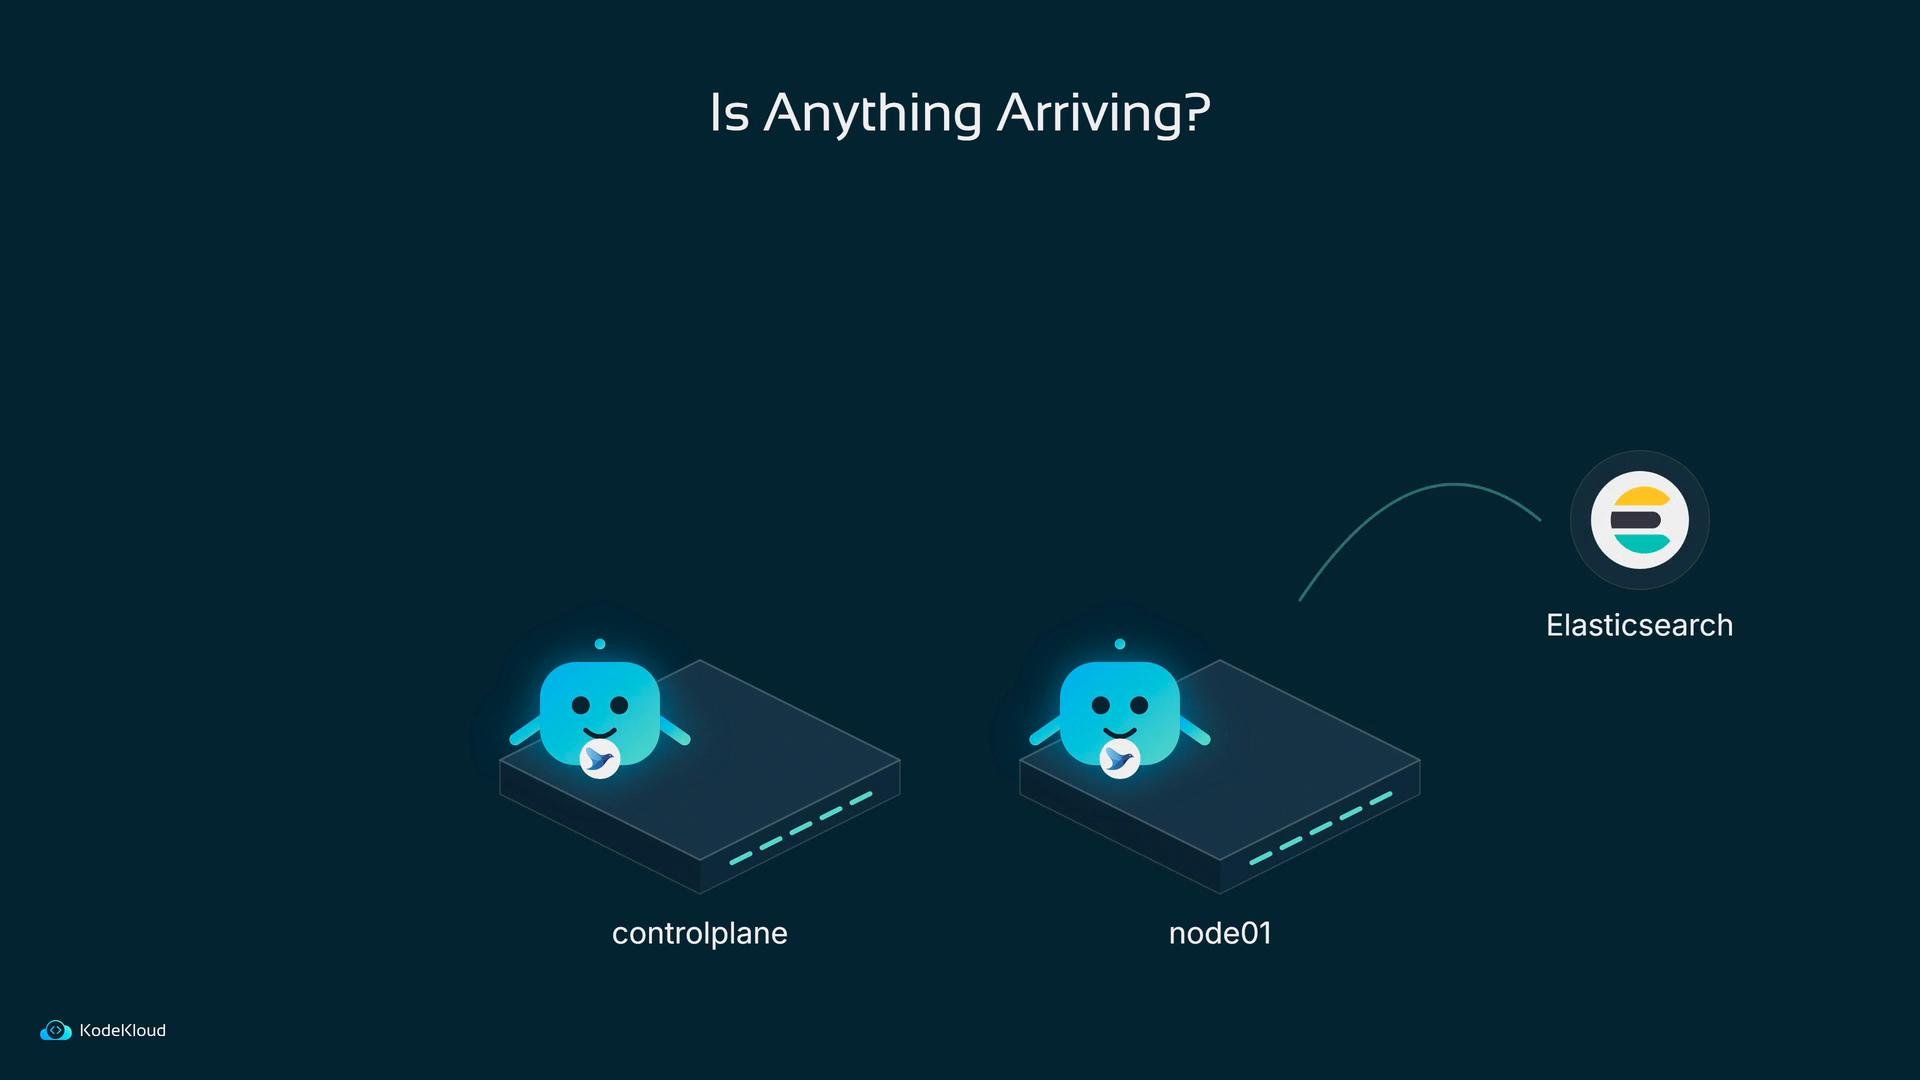
If Elasticsearch is not reachable immediately after deploying Fluentd, allow a short time for Fluentd to establish connections and for buffers to flush. The
retry_forever true buffer setting ensures events are retried until delivery succeeds.Quick checklist
- Host folder created:
/root/fluentd/etc/fluent.conf - ServiceAccount
fluentdcreated and used by the DaemonSet - ClusterRole grants
get,list,watchonpodsandnamespaces - ClusterRoleBinding binds the role to the
fluentdServiceAccount - DaemonSet mounts node log paths and the host config path
- Fluentd pods are running on each node
- Check Elasticsearch for
fluentd-*indices and confirm thelogfield contains app messages
References
- Kubernetes RBAC documentation: https://kubernetes.io/docs/reference/access-authn-authz/rbac/
- Fluentd Kubernetes DaemonSet images: https://hub.docker.com/r/fluent/fluentd-kubernetes-daemonset
- Elasticsearch HTTP API: https://www.elastic.co/guide/en/elasticsearch/reference/current/rest-apis.html