

- Provides a web UI for exploring logs stored in Elasticsearch.
- Lets you create index patterns, run ad-hoc queries, and build visualizations and dashboards.
Deploying Kibana
The Kibana Deployment is straightforward: it creates a Deployment namedkibana in the elastic-stack namespace, with one replica and the pod label app: kibana. The container exposes port 5601, the default Kibana web UI port.
Deployment (excerpt):
elastic-stack namespace where Elasticsearch and Fluentd are running:
ContainerCreating while Kubernetes pulls the Kibana image. After a short time it should become Running:
Exposing Kibana: NodePort Service
A running pod is reachable inside the cluster, but to open the UI in a laptop browser we create a Service. A NodePort Service opens a port on each node and forwards traffic to the pod’s port5601.
The Service selects the same app: kibana label so it routes to the Kibana pod. Inside the cluster the service listens on 5601 and maps a NodePort (example: 30601) on each node.
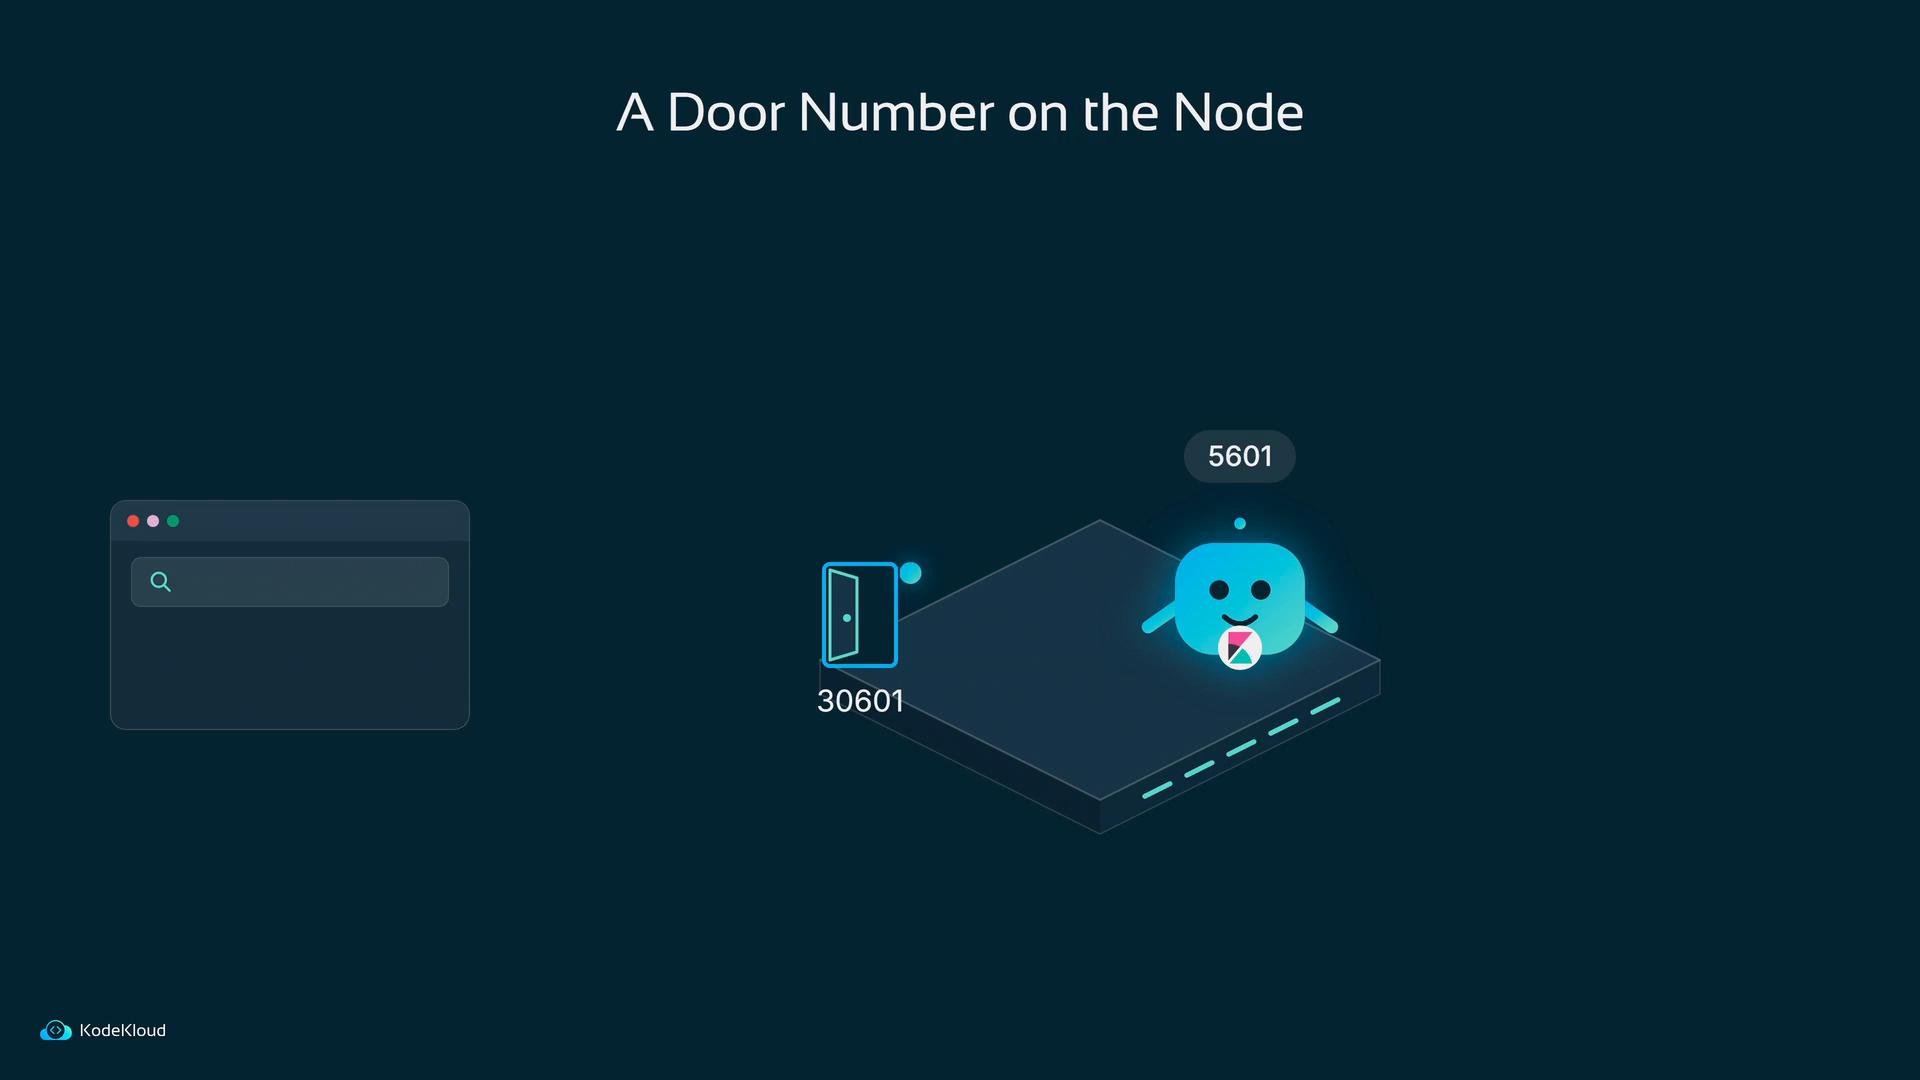
NodePort mapping:
node01 with your node’s address):
200 OK indicates Kibana is answering. Open http://node01:30601 in your browser to load the Kibana UI.
Exposing Kibana via a NodePort makes the UI reachable from the node network. If your nodes are publicly accessible, secure Kibana with authentication, network policies, or an ingress that enforces TLS and access control.
Quick reference: Kubernetes objects deployed
For more details see the Kubernetes documentation: Services.
Creating an index pattern in Kibana
When you open Kibana and go to Discover, Kibana asks which index pattern to use. Fluentd in this setup creates daily indices named likefluentd-YYYY.MM.DD. To match today’s index and future indices, use a wildcard index pattern such as fluentd-*.
Enter fluentd-* to match current and future daily indices.

@timestamp) and create the index pattern. Kibana reads the index mappings and displays discovered fields.
Exploring logs in Discover
With the index pattern created, Discover shows a bar chart of events over time and lists log lines (newest first). These logs originate in app pods, are collected by Fluentd, stored in Elasticsearch, and surfaced in Kibana.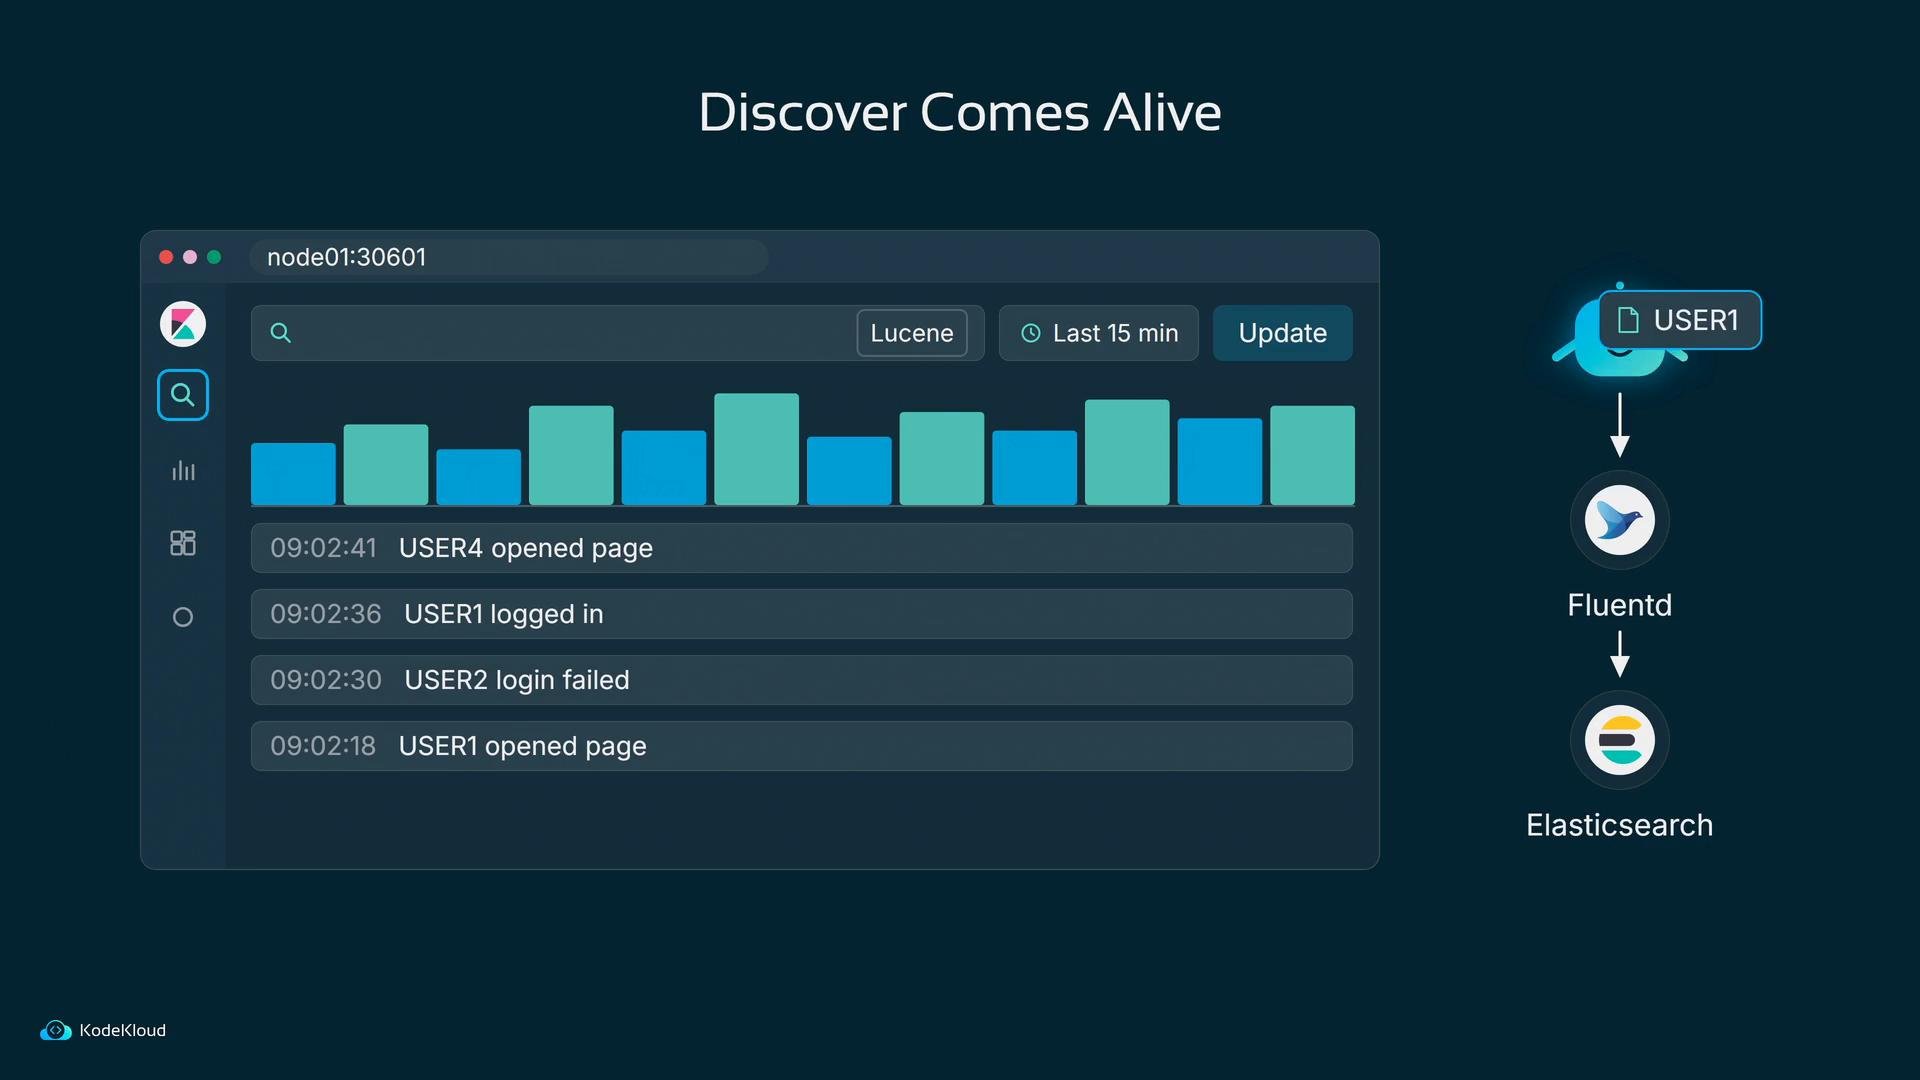
USER1 remain. KQL is an easy-to-use query language for interactive log exploration.
Example filtered output in Discover (conceptual):
Kibana queries data in Elasticsearch. If Elasticsearch is unavailable or resource-starved, Discover won’t always show an explicit error; it may simply return no results and flatten charts. Add monitoring and alerts for Elasticsearch cluster health and resource usage to ensure reliable log visibility.
Next steps
- Add monitoring and alerts for Elasticsearch (cluster health, disk, CPU, memory).
- Consider using an authenticated, encrypted ingress instead of a NodePort for production access.
- Build visualizations and dashboards in Kibana to surface important operational metrics and log-derived KPIs.