

USER1 in Discover takes a long time to return, and the newest lines are minutes behind real time:
Vertical scaling: make a pod bigger
Kubernetes allocates CPU in millicores (m). 1000m = 1 CPU core. In this example the Elasticsearch container is configured withrequests.cpu: "250m" and limits.cpu: "500m" which guarantees a quarter of a core and allows up to half a core.
Example container resource settings (Deployment / StatefulSet spec):
Horizontal scaling: add more pods
Start with Fluentd. The common pattern uses a DaemonSet to ensure one Fluentd pod runs on every node; a newly added node automatically gets its own collector.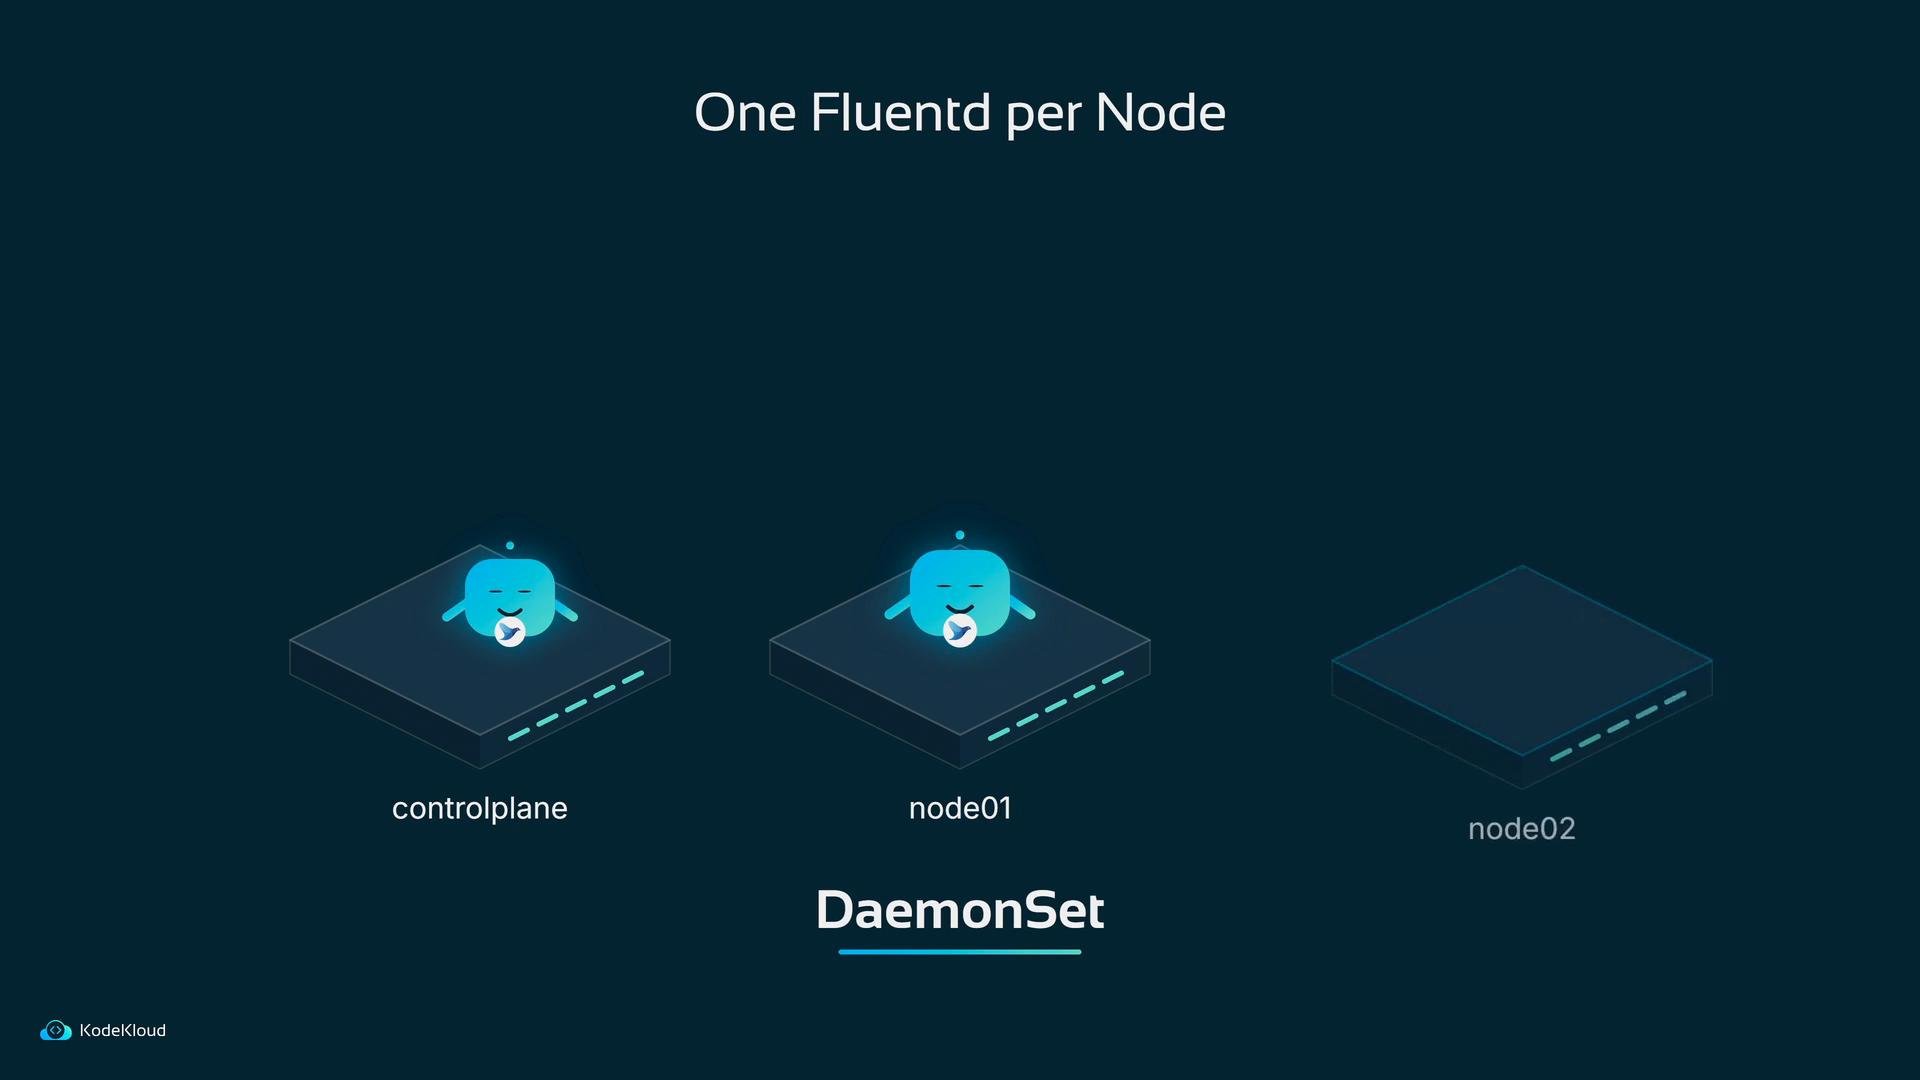
Fluentd buffer behavior
When Elasticsearch becomes slow, Fluentd does not simply drop logs. It buffers them and sends in batches called chunks. You can tune how often buffers are flushed, the maximum chunk size, and retry behavior (including retry forever).
flush_interval, chunk_limit_size, and retry strategy) reduces tailing and prevents loss when Elasticsearch is under transient load.
Sharding Elasticsearch
Can Bob simply add more Elasticsearch pods? Only if the data can be split across nodes.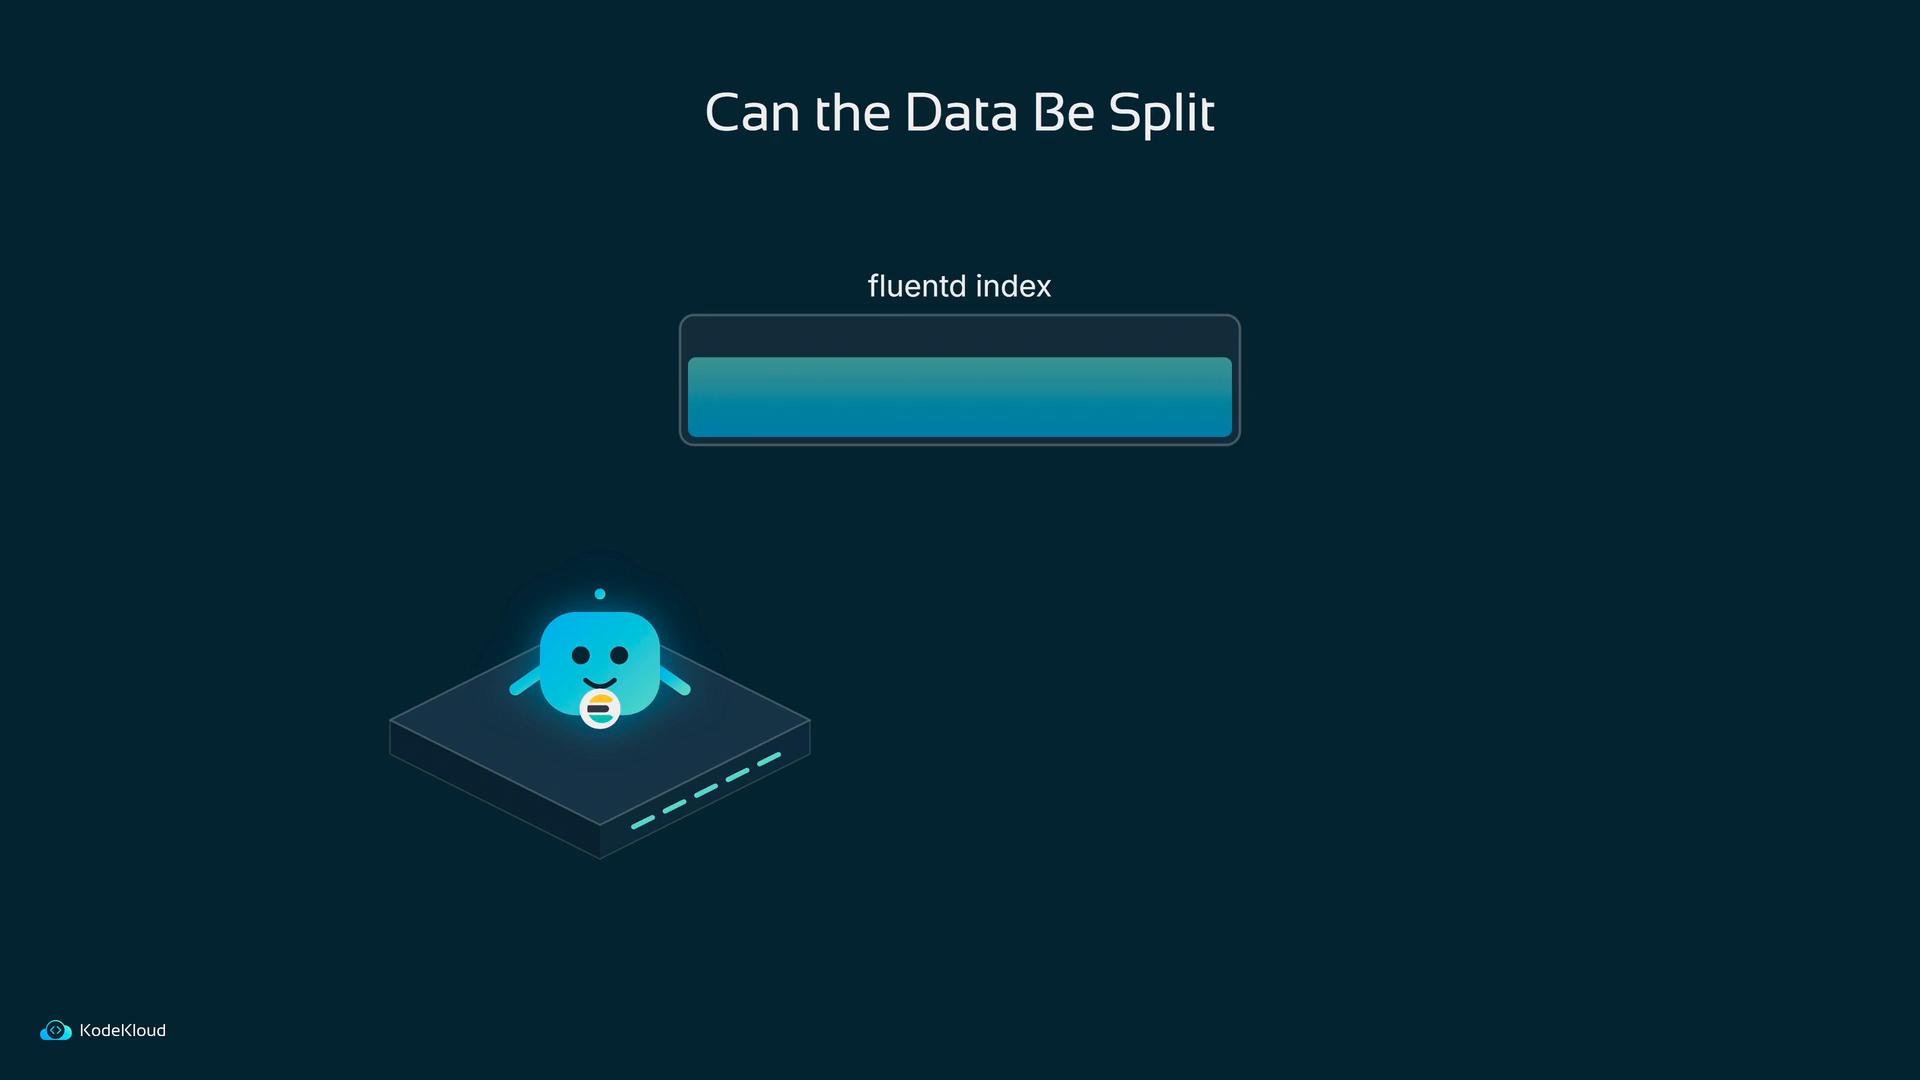
- Create a new index with the desired number of primary shards (and replicas).
- Reindex (copy) documents from the old index into the new one.
- Point your writes/aliases to the new index once reindexing is complete.
You cannot change the number of primary shards for an existing index after it is created. Create a new index with the desired
number_of_shards and reindex the data into it instead.Autoscaling with the HPA
Adding pods by hand is useful, but load often fluctuates: busy during the day, quiet at night. You don’t want to manually add pods at 2 AM and remove them at 6 AM.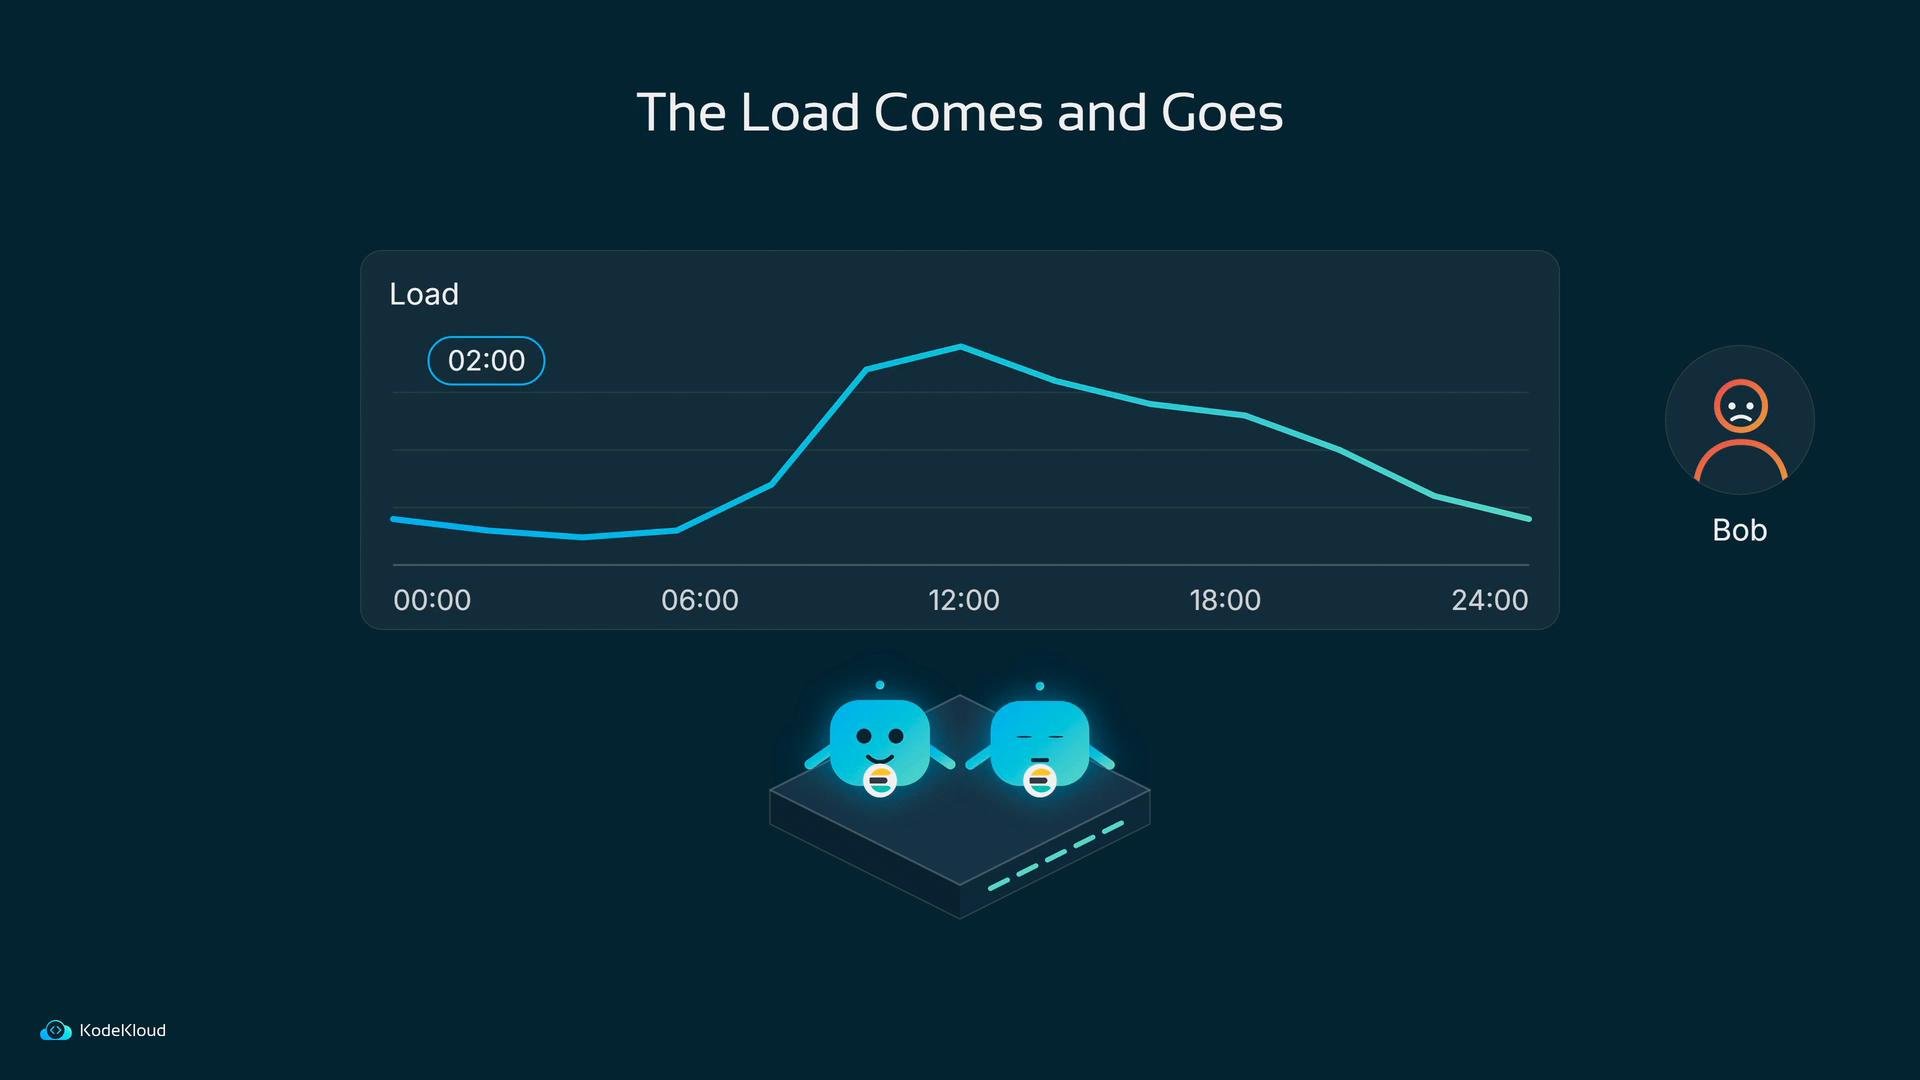
Install the Kubernetes Metrics Server so the cluster can read pod CPU and memory metrics. The HPA relies on this data to scale pods automatically. See the Kubernetes docs: https://kubernetes.io/docs/tasks/debug-application-cluster/resource-metrics-pipeline/#metrics-server
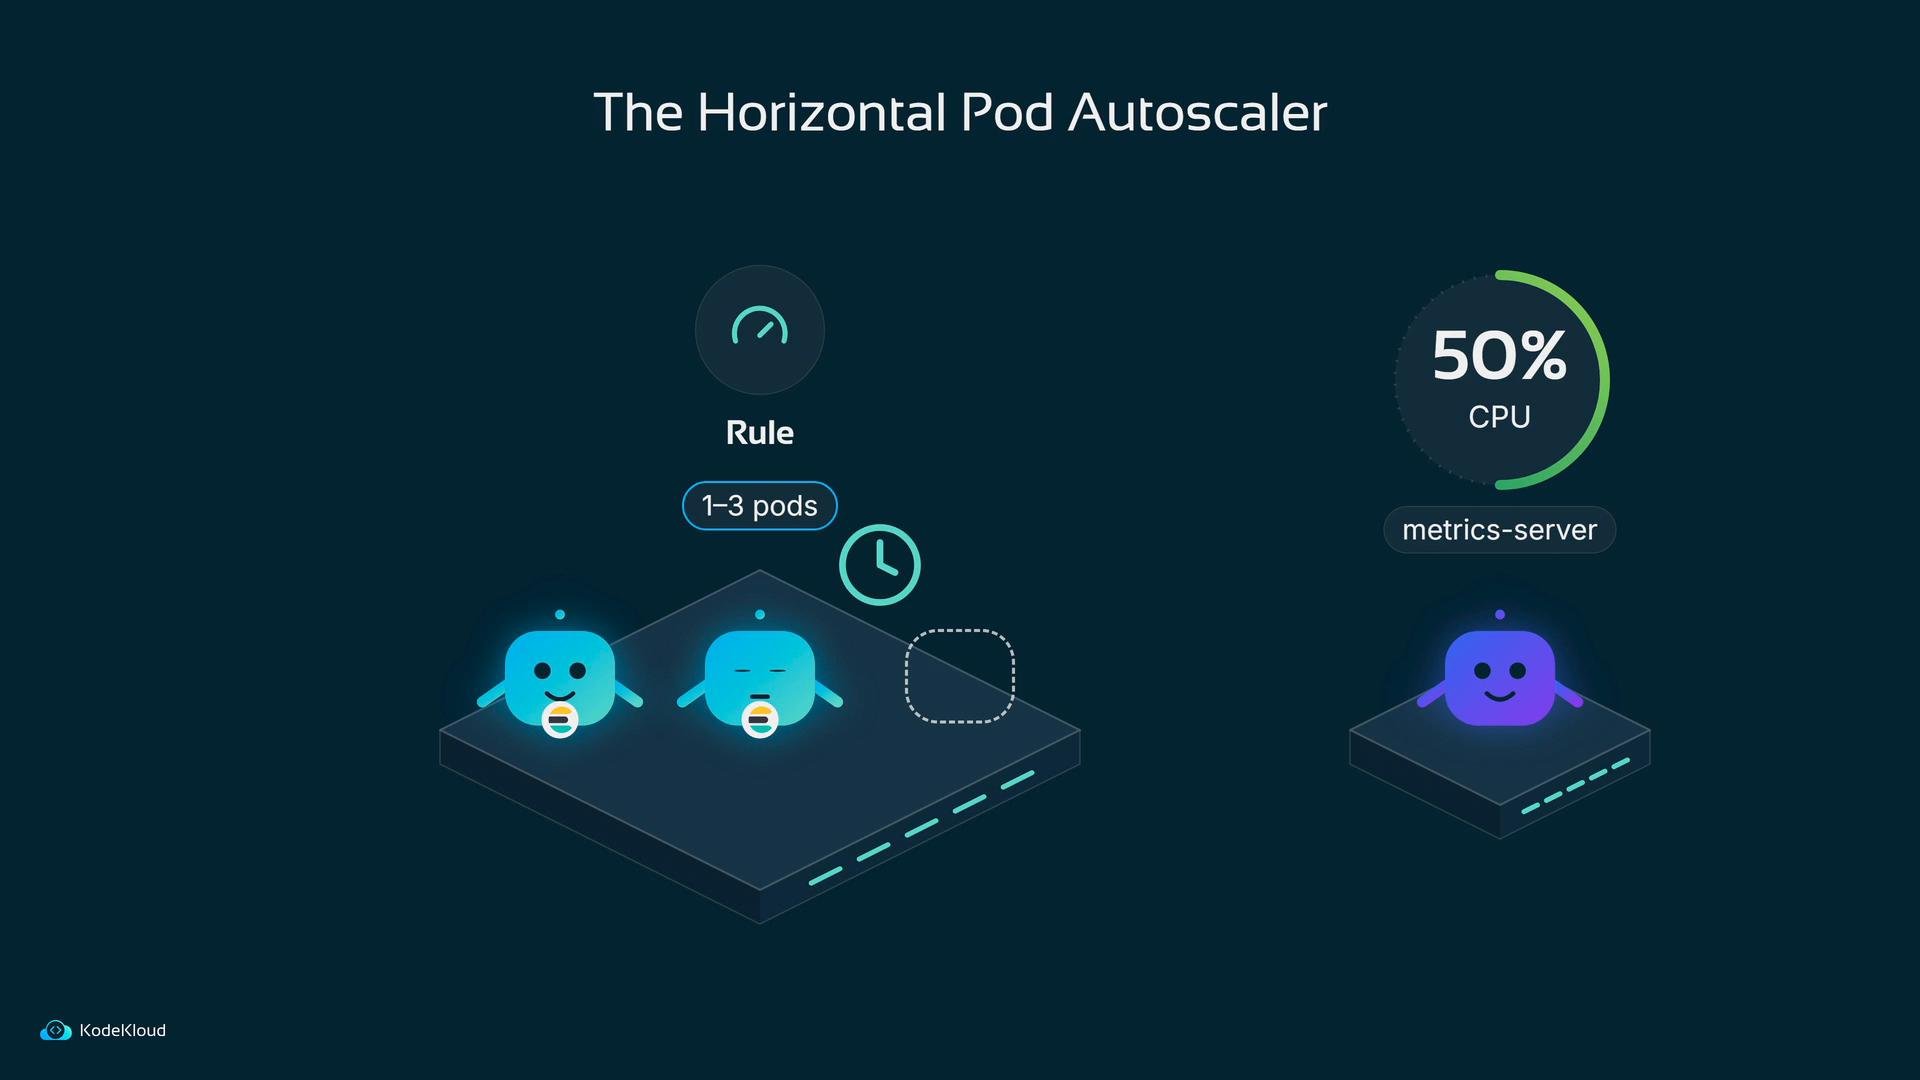
targetCPUUtilizationPercentage can cause frequent scale-up/scale-down oscillation.
Quick reference: compare strategies
Summary — when to do what
- If pressure is steady and sustained: increase resources (vertical scale) or add permanent pods and ensure indices are sharded appropriately.
- If pressure is variable (peaks and troughs): use the HPA with the Metrics Server to autoscale pods.
- Fluentd recommendations: use a DaemonSet for one-per-node collection, add targeted replicas on busy nodes, and tune buffers to prevent dropped logs during transient Elasticsearch slowness.
- Elasticsearch recommendations: plan your shard strategy before scaling nodes — add nodes only when indices can be spread across shards.
Next steps
Now, open a terminal and apply changes as needed:- Update resource
requests/limitsfor Elasticsearch pods. - Adjust Fluentd buffer settings in its ConfigMap.
- Deploy additional Fluentd replicas (with node selectors/affinity for busy nodes).
- Create a new, sharded Elasticsearch index and reindex old data into it.
- Install the Metrics Server and apply an HPA manifest for Elasticsearch.
Links and references
- Kubernetes Metrics Server: https://kubernetes.io/docs/tasks/debug-application-cluster/resource-metrics-pipeline/#metrics-server
- Horizontal Pod Autoscaler: https://kubernetes.io/docs/tasks/run-application/horizontal-pod-autoscale/
- Elasticsearch documentation: https://www.elastic.co/guide/en/elasticsearch/reference/current/index.html