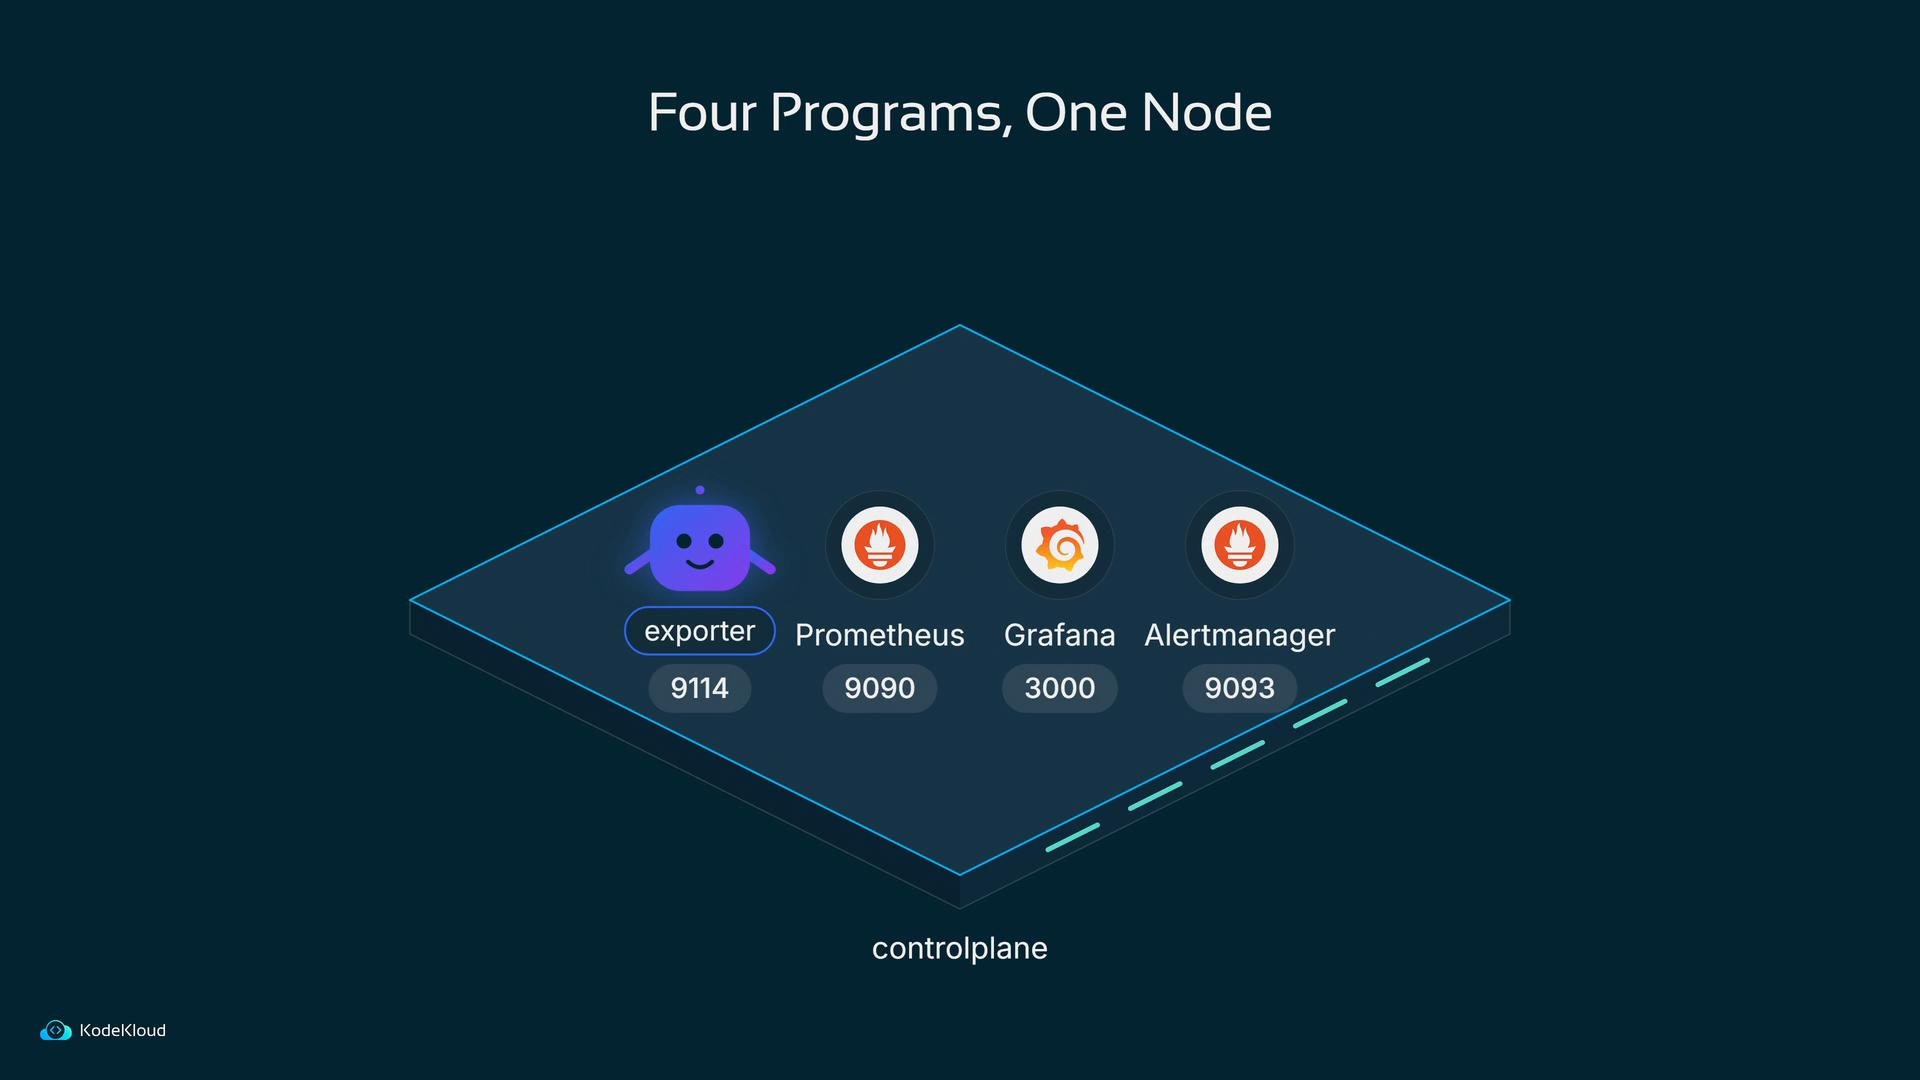
So where do each of the monitoring programs run? In Bob’s lab it’s refreshingly simple: a single machine runs four programs, each listening on its own port and passing metrics along the pipeline. Below we follow the path a metric takes, step by step.
A diagram titled "Four Programs, One Node" showing a controlplane node. Inside the node are four services with icons and ports: exporter (9114), Prometheus (9090), Grafana (3000), and Alertmanager (9093).
Quick reference — components and ports: Step-by-step: how the metric travels
  1. Elasticsearch exporter — expose metrics
Bob downloads the Elasticsearch exporter, points it at the local Elasticsearch instance (http://localhost:9200), and runs it in the background. The exporter exposes Prometheus-format metrics (including JVM memory used/max) on port 9114. Example commands:
When you visit http://localhost:9114/metrics you’ll see many metrics. Two important metrics the exporter provides are the JVM memory used and the JVM memory max — these are used later in an alert rule.
  1. Prometheus — scrape the exporter
Prometheus scrapes exporters according to jobs defined in its configuration. Bob adds a scrape job for the Elasticsearch exporter to prometheus.yml and starts Prometheus. Relevant excerpt from prometheus.yml:
Start Prometheus:
Open Prometheus UI at http://localhost:9090, then go to Status → Targets. You should see both the Prometheus target and the Elasticsearch exporter target marked UP if everything is running.
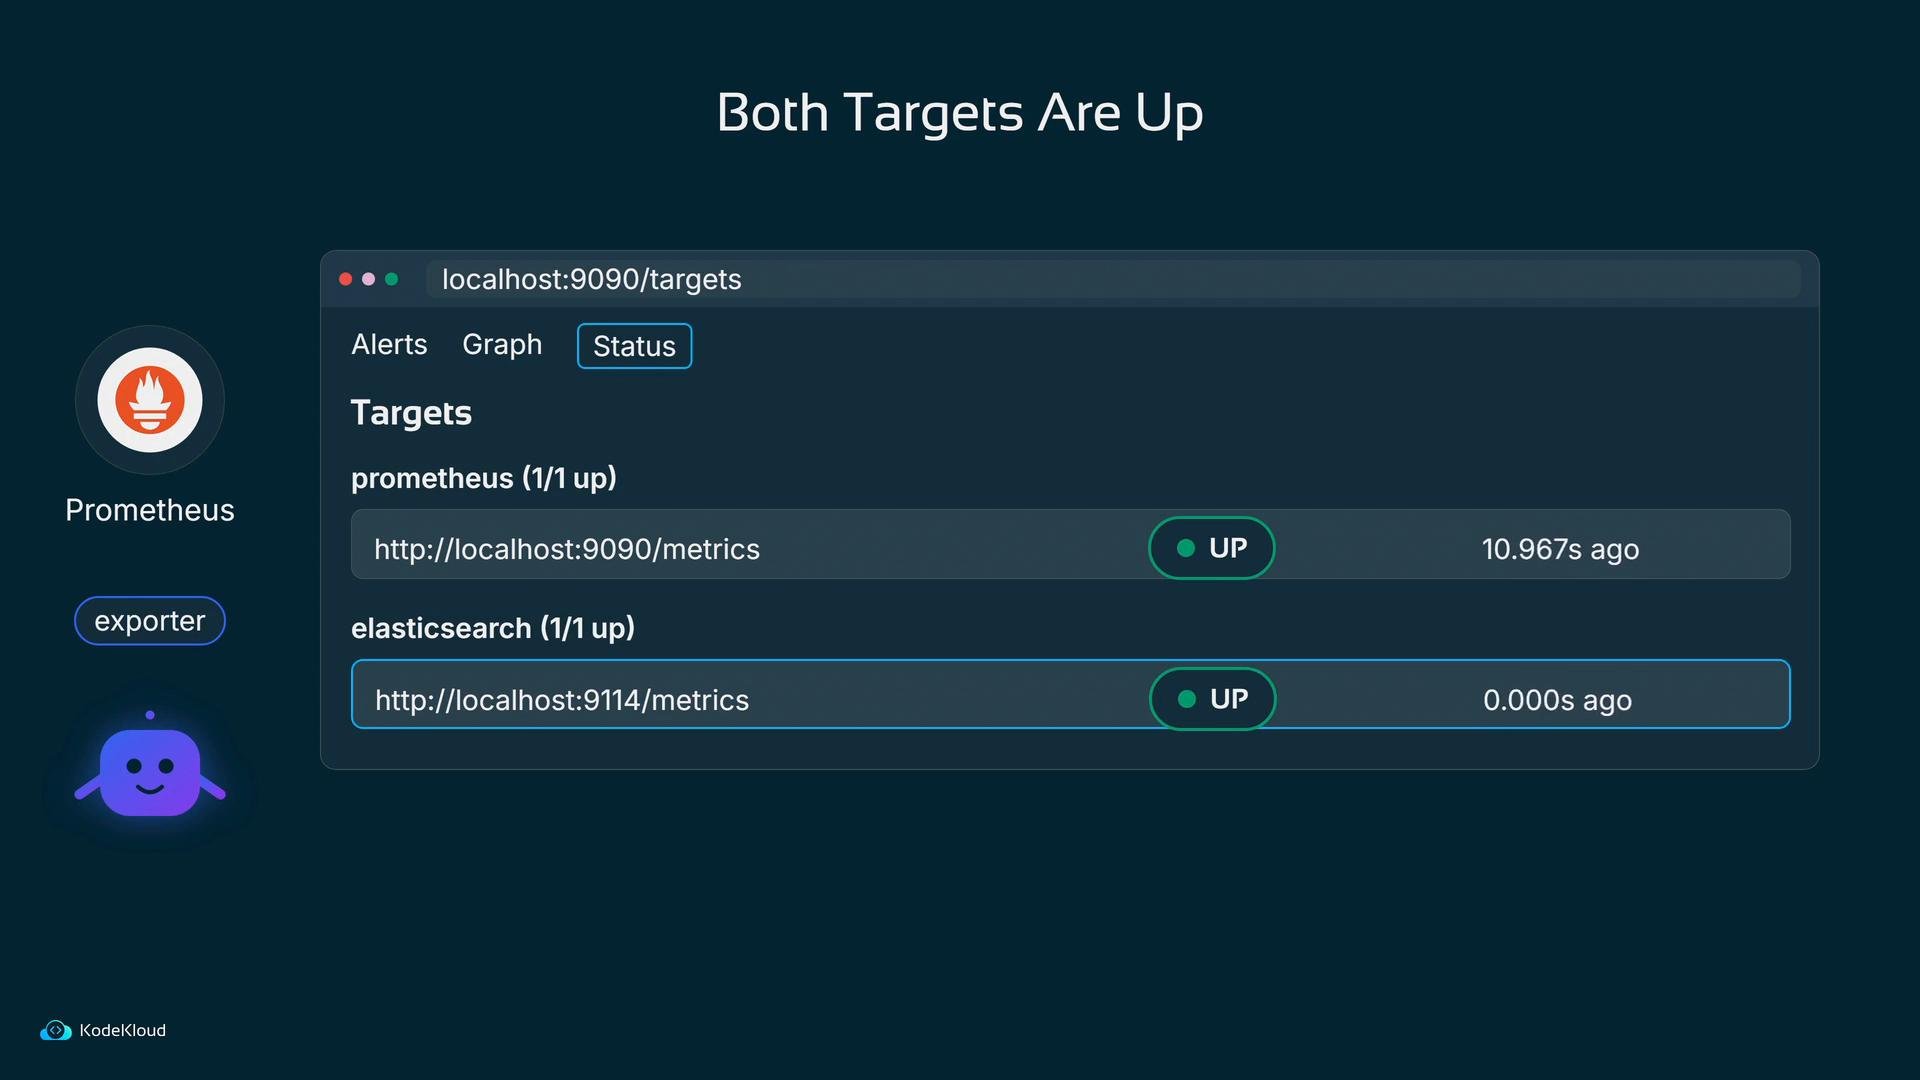
A screenshot of the Prometheus targets/status page showing two monitored endpoints (prometheus and elasticsearch) with green "UP" indicators and their metrics URLs. The top title reads "Both Targets Are Up."
  1. Grafana — visualize Prometheus metrics
Bob runs Grafana (default UI at http://localhost:3000). After logging in (admin / admin on first run) he adds Prometheus as a data source pointing to http://localhost:9090. In Grafana’s Explore you can build PromQL queries from available metrics. Example query to see active primary shards for the cluster named docker-cluster:
A steady flat line usually indicates a stable shard count.
  1. Alerting — write a rule in Prometheus
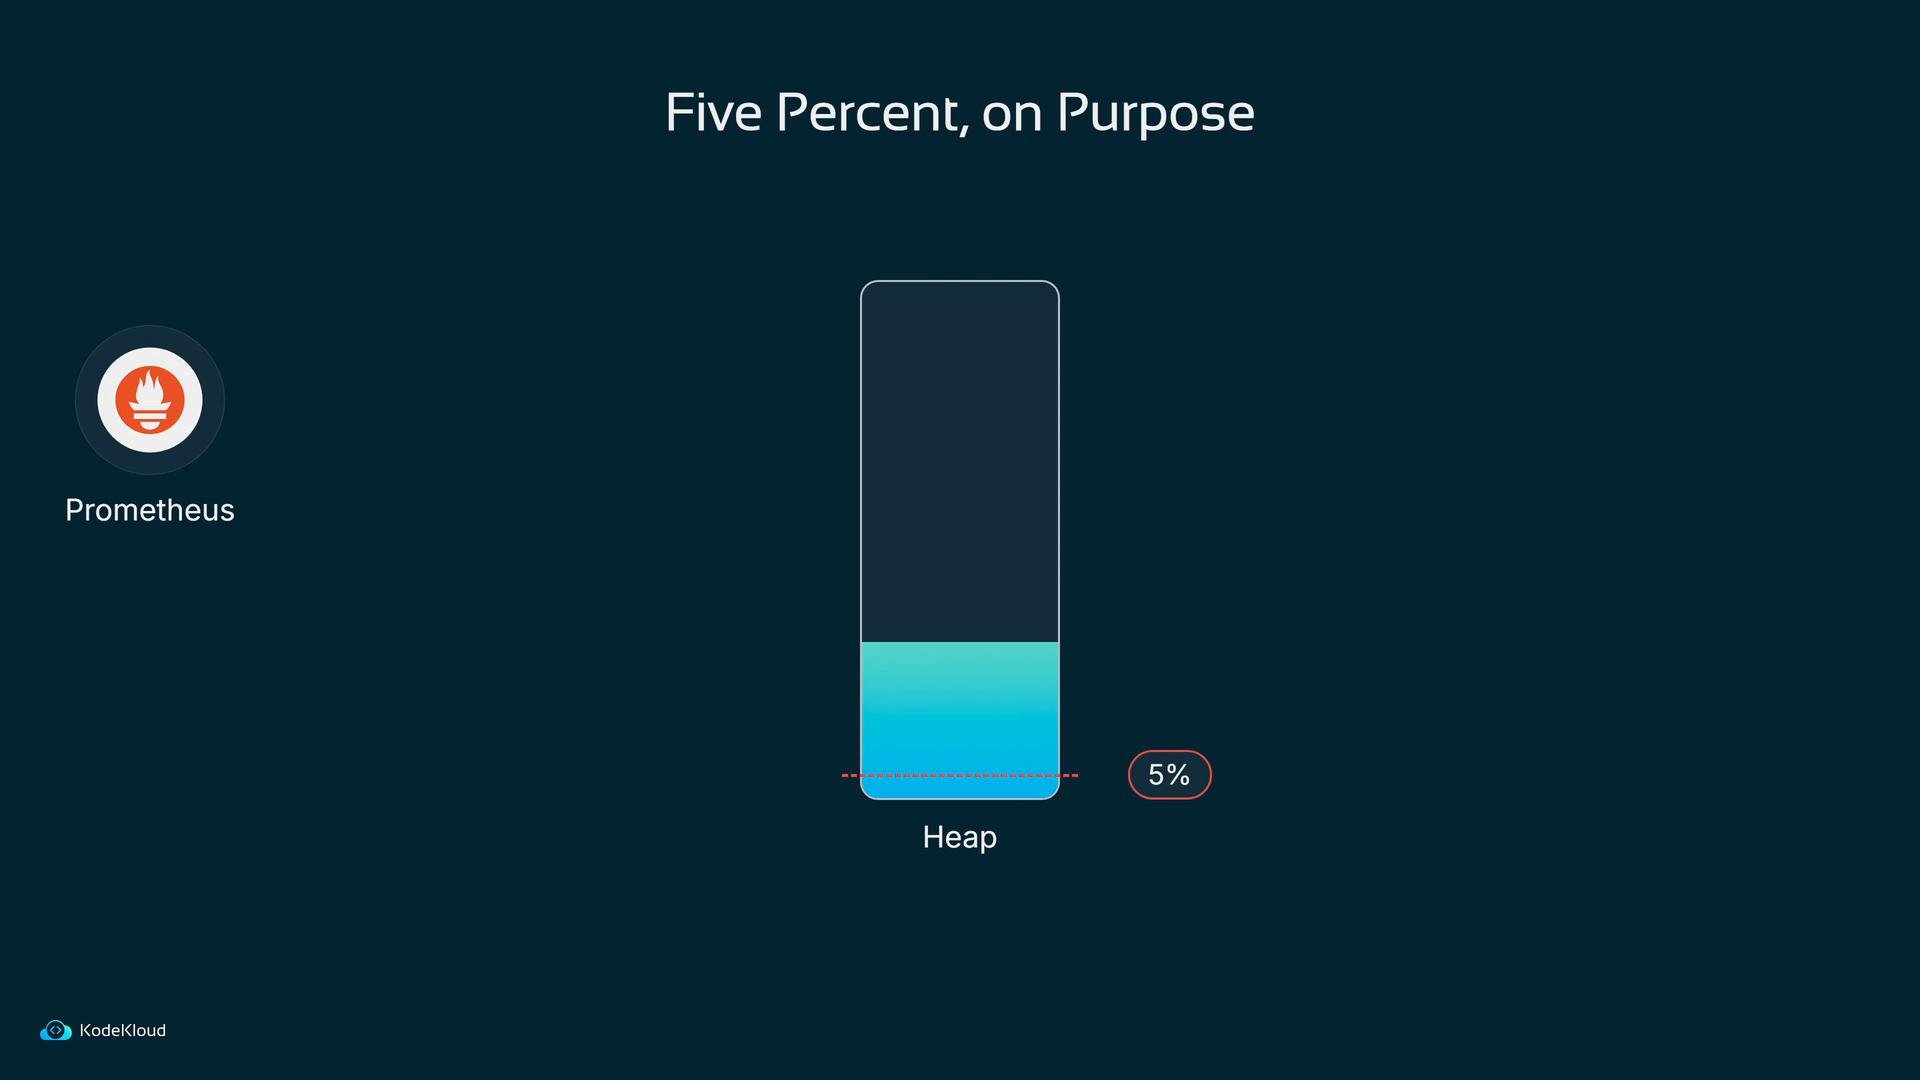
Dashboards are great, but they don’t wake people up. Prometheus rules can evaluate expressions and produce alerts when conditions persist. Bob writes a rule that computes Elasticsearch heap usage as the ratio of used JVM memory to max JVM memory and fires when that ratio stays above 5% for 2 minutes. (This 5% threshold is intentionally low for demonstration; in production use realistic thresholds, e.g. 90%.) rules.yml:
A dark-themed slide titled "Five Percent, on Purpose" showing a vertical "Heap" gauge partially filled to about 5%. The Prometheus logo appears on the left and a small 5% badge and dotted line mark the fill level.
This example uses 5% so the alert will fire immediately for demonstration. In real deployments choose realistic thresholds (for example, 90% heap usage).
Tell Prometheus to load the rules file by referencing it in prometheus.yml:
Prometheus reads rule_files at startup. You can either restart Prometheus or request a runtime reload by POSTing to http://localhost:9090/-/reload. Example of a simple restart approach:
On the Prometheus Alerts page the new rule will appear as Pending while the for window is counting down; if the condition persists it will change to Firing.
  1. Alertmanager — group and route alerts
Prometheus does not notify external systems itself; it forwards alerts to Alertmanager. Bob runs Alertmanager using a configuration that routes alerts to a web.hook receiver which posts to a small HTTP server on port 5001. Relevant excerpt from alertmanager.yml:
Start Alertmanager:
Tell Prometheus where to send alerts by adding an alerting section to prometheus.yml (then restart or reload Prometheus):
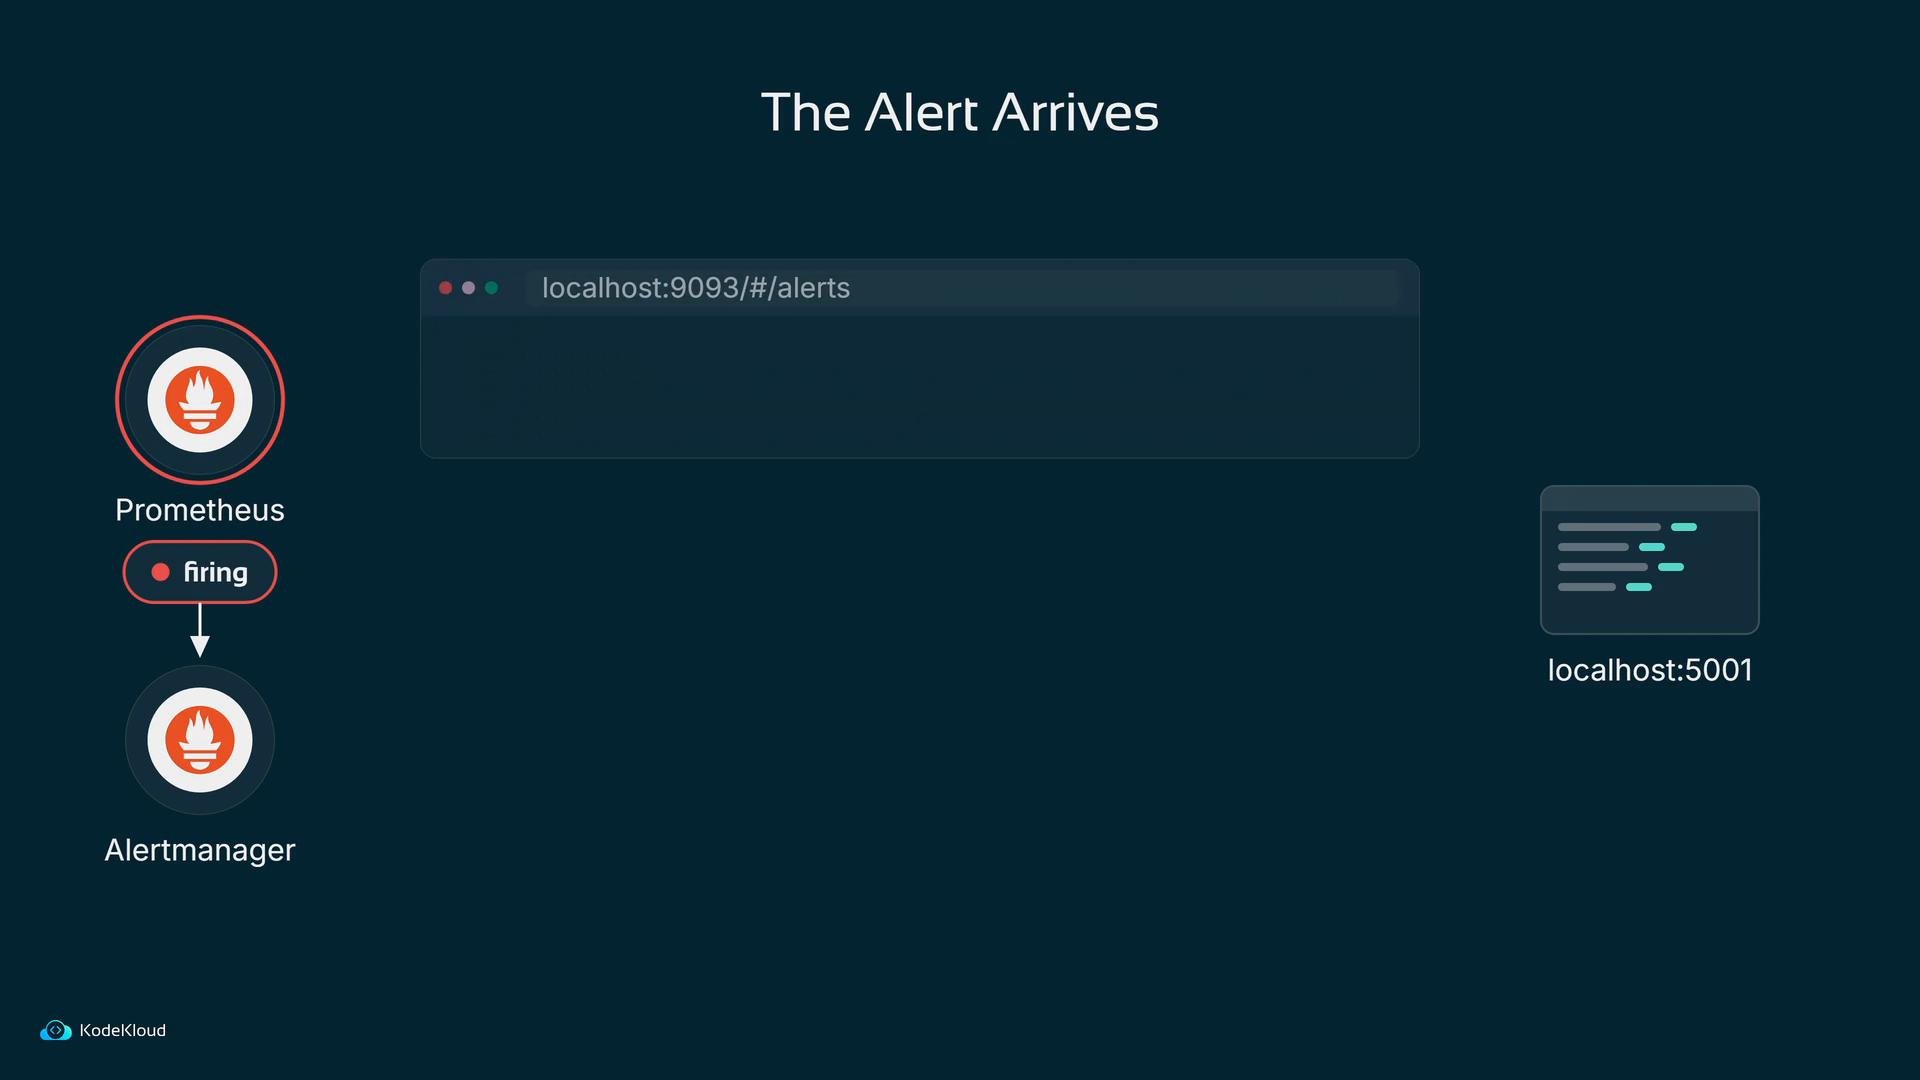
After this, fired alerts from Prometheus will appear in Alertmanager and follow its routing logic.
A diagram titled "The Alert Arrives" showing Prometheus firing an alert to Alertmanager, with a browser address bar at localhost:9093/#/alerts. A separate service box labeled localhost:5001 is shown on the right.
  1. Receiver — do something with the alert

To complete the loop Bob runs a simple webhook receiver (example Python script) that listens on port 5001 and prints received alerts. In production this receiver could forward alerts to Slack, PagerDuty, email, or other incident-management tools. Example run and output:
The full path is now complete: a metric left Elasticsearch, passed through the exporter, was scraped by Prometheus, tripped a rule, and travelled through Alertmanager to a receiver visible to Bob.
A diagram titled "That's the Check" showing a monitoring pipeline with icons for Elasticsearch, an exporter, Prometheus, Alertmanager, a receiver, and a user labeled "Bob." It visually represents data flowing through monitoring and alerting components to a human recipient.
A few weeks later — iterate on the alert Fast forward: with a production threshold (e.g. 90%) and more services running, the heap alert may fire intermittently. Old Bob would merely restart Elasticsearch; new Bob asks why it’s happening and how to prevent it. Alerts are a starting point for investigation, not the end.
A dark-themed infographic titled "A Few Weeks Later" showing happy blue service/process icons on the left and a single distressed process in the center. On the right is a tall "Heap" usage bar marked at 90% with a "firing" alert and a user icon labeled "Bob."
Links and references Further reading
  • PromQL basics — learn common queries for alerting and dashboards.
  • Alertmanager routing and receivers — configure Slack, PagerDuty, email, and webhooks.
  • Best practices for thresholds and alert fatigue — choose meaningful severity and aggregation windows.

Watch Video

Practice Lab