

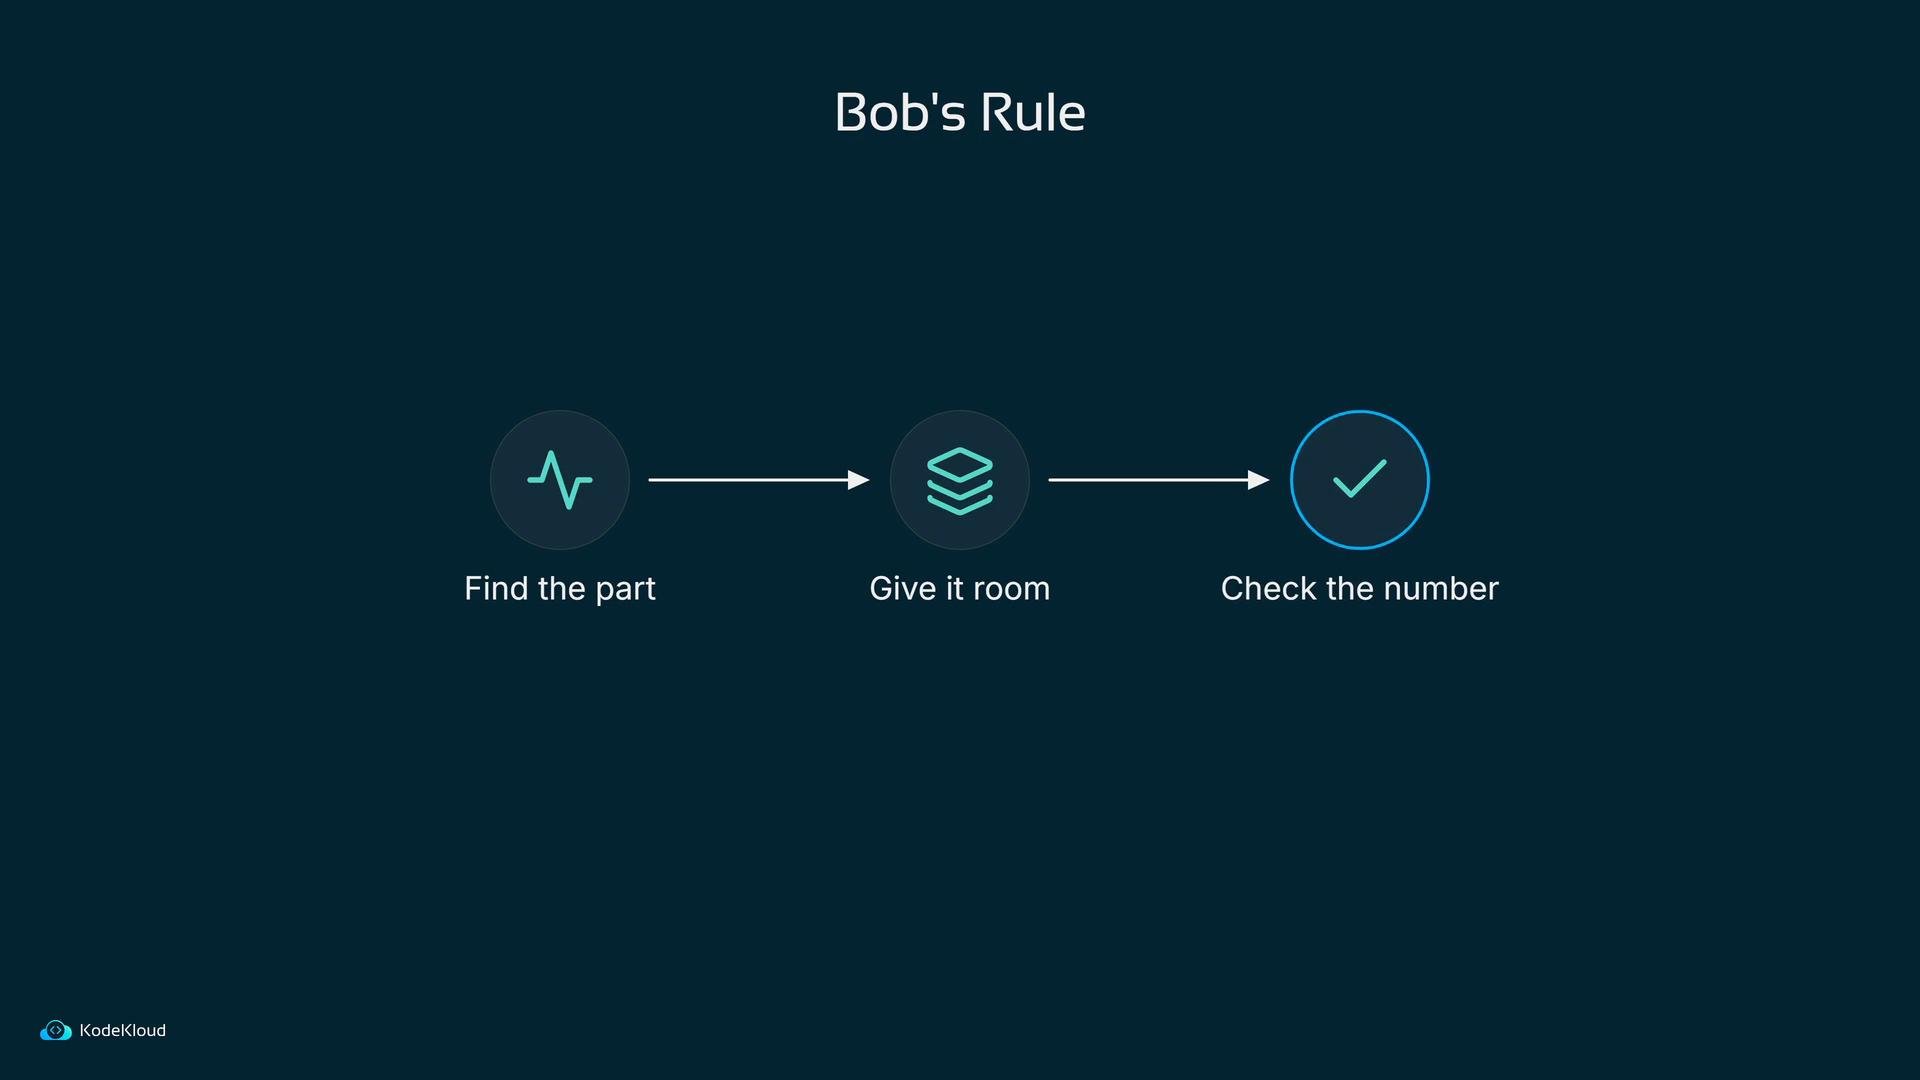
Index shard bottleneck — check the number
Bob starts at Kibana → Index Management and inspects today’s Fluentd index (fluentd-<date>). The UI shows “primaries: 1”.
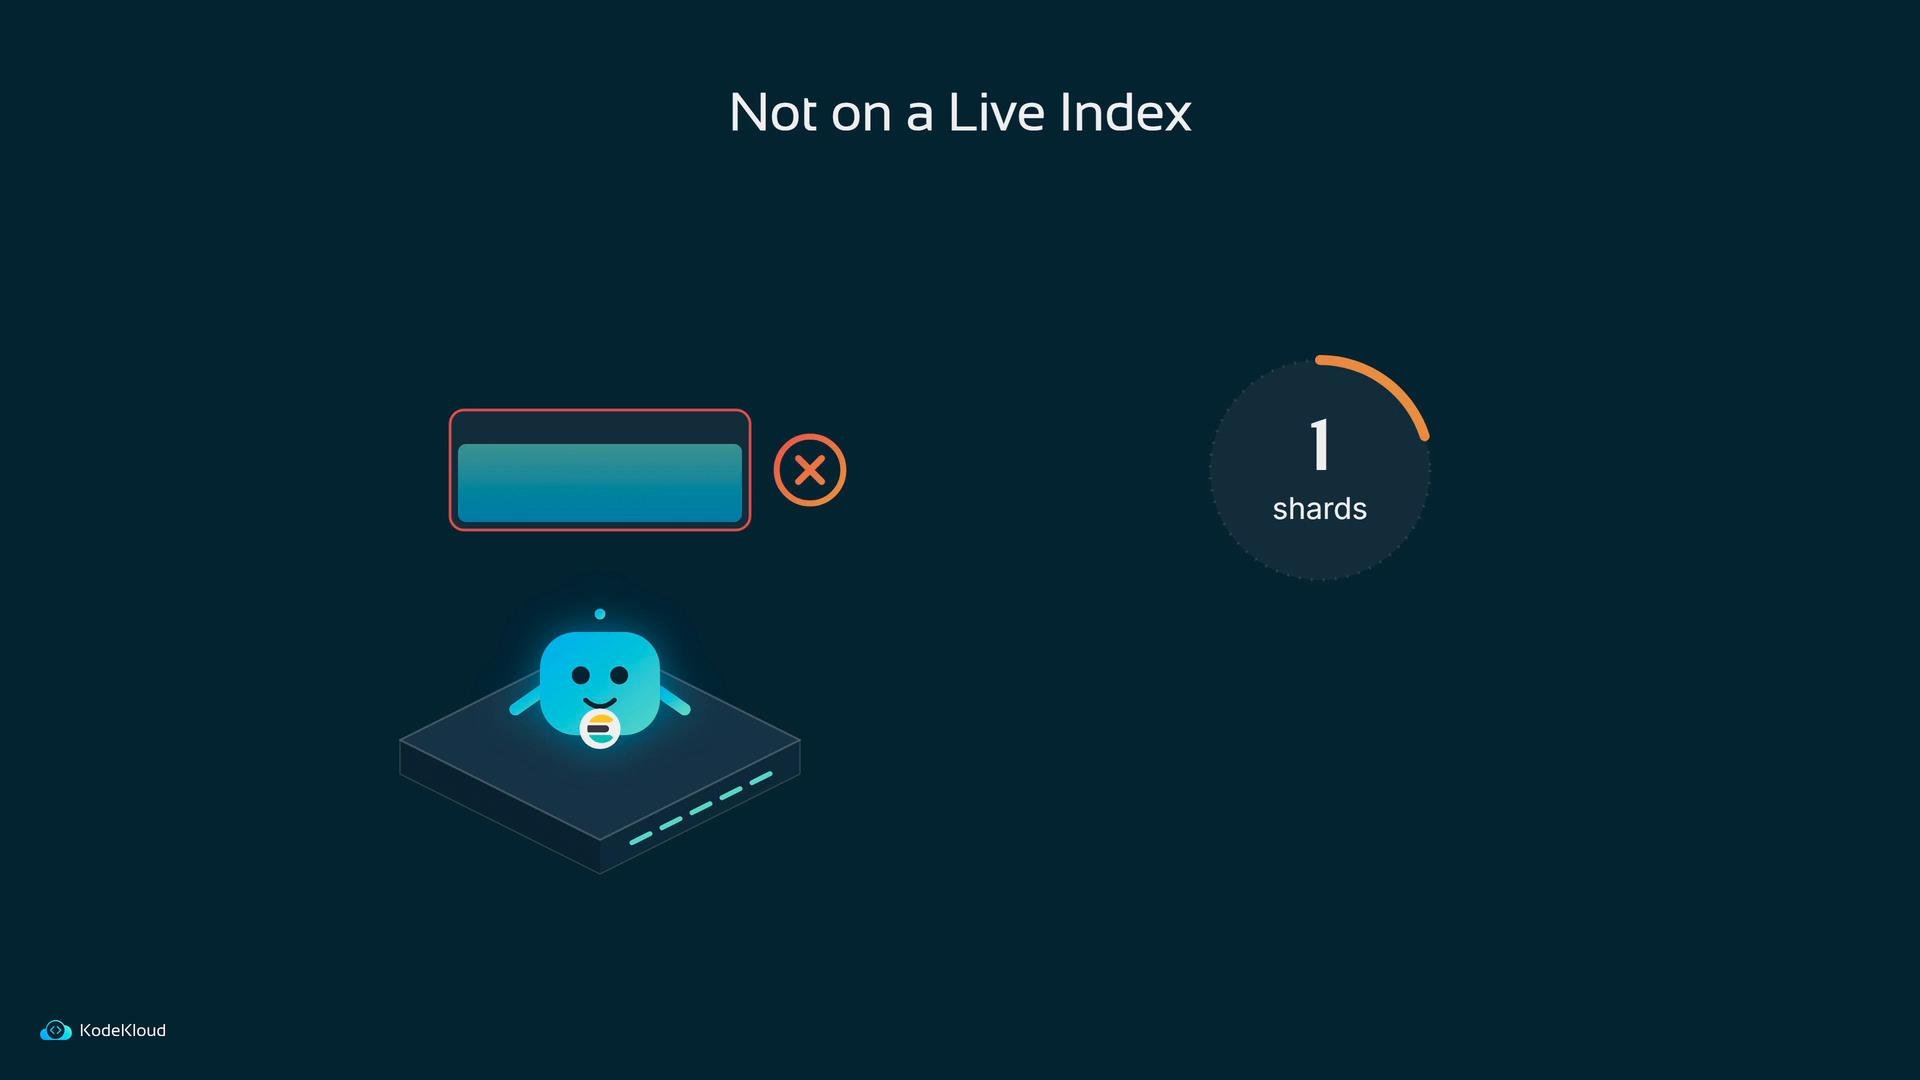
What does that “1” mean? It’s the number of primary shards for that index. A shard is a slice of an index that can live on a separate Elasticsearch node and be searched in parallel. With only one primary shard, all index operations and searches hit the same slice — a single bottleneck.
Can you safely change the primary shard count on a live index? No. Increasing the number of primary shards on an existing index is not supported and doing so improperly can corrupt or make data unavailable.
http://localhost:9200):
myindex with five primaries. Reindexing avoids changing shard allocation for an active index and preserves availability.
Before reindexing in production: take a snapshot of the source index (or the cluster) and validate snapshots on a restore cluster to prevent accidental data loss.
Collector (Fluentd) — buffer and replica options
When applications suddenly emit many more log lines, Fluentd buffers events in memory or files until it can flush them to Elasticsearch. A buffer acts as a waiting room that batches events for efficient delivery and retries on failure. Bob updates the Fluentd match configuration to flush batches every 5 seconds and to retry indefinitely if Elasticsearch becomes unavailable:Elasticsearch pod sizing — vertical scaling (requests & limits)
If Elasticsearch pods are hitting CPU or heap alerts, give them more resources. Bob edits the Elasticsearch StatefulSet container resources to request 250m (0.25 core) and limit 500m (0.5 core). Kubernetes will reserve the requested CPU and enforce the hard ceiling defined by the limit. Example StatefulSet container resources snippet: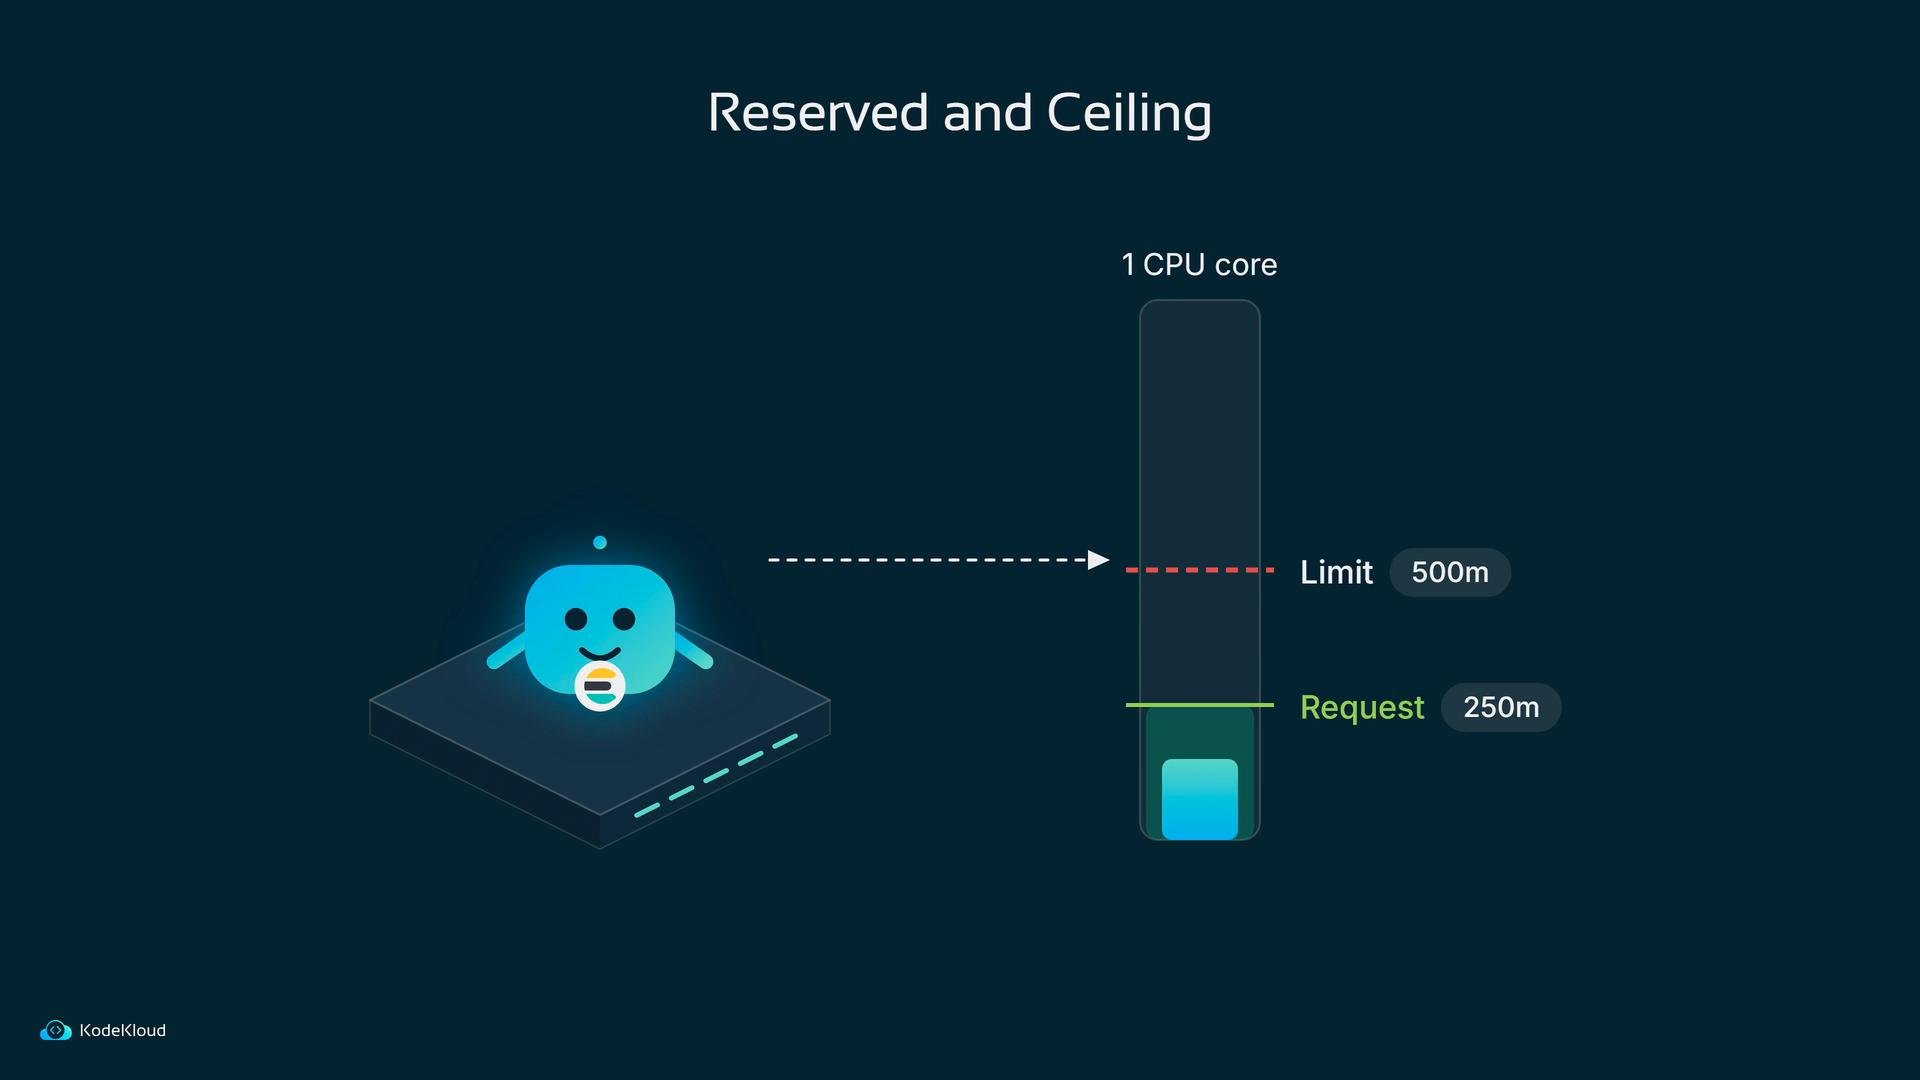
Horizontal scaling — HPA + Metrics Server
For automatic horizontal scaling, use a HorizontalPodAutoscaler (HPA). The HPA needs metrics (typically CPU) from the Kubernetes Metrics Server. Install Metrics Server (example uses v0.5.0 and the lab-only--kubelet-insecure-tls flag):
components.yaml:
The
--kubelet-insecure-tls option disables kubelet certificate verification. It is fine for a lab environment but should NOT be used in production.elasticsearch-0 so a new pod rebuilds and overshoots the target). The HPA observes the increased CPU usage via Metrics Server and scales up:
Quick comparison: scaling options
Secure your Elasticsearch
A properly scaled stack is still vulnerable if Elasticsearch is left exposed without authentication, authorization, and TLS. In Bob’s lab a test pod issued a single request to the open Elasticsearch endpoint and could retrieve every log line from the month — potentially exposing usernames and PII.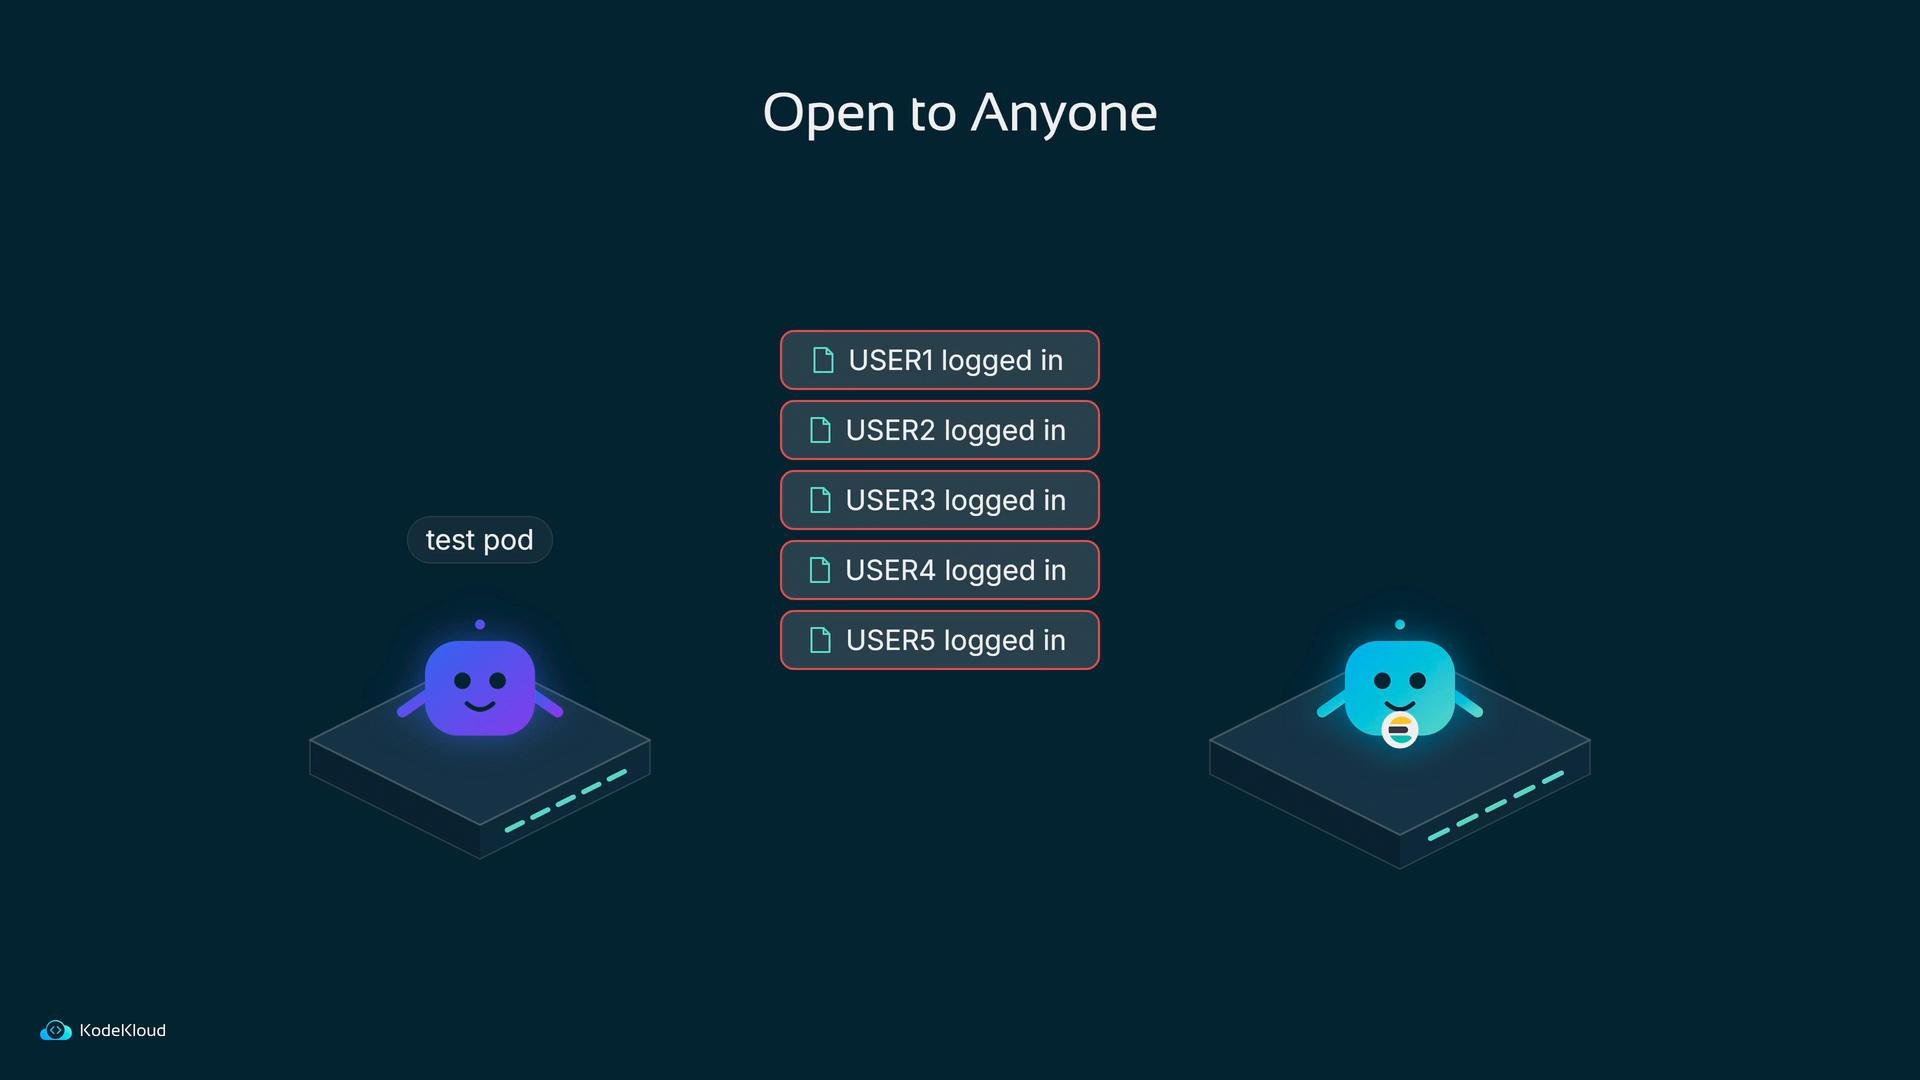
- Enable authentication and role-based access control.
- Use TLS (HTTPS) for both HTTP and transport layers.
- Restrict network access with NetworkPolicies and service-level controls.
- Audit and monitor access to sensitive indices.
Links and references
- Kubernetes Metrics Server: https://github.com/kubernetes-sigs/metrics-server
- Kubernetes Horizontal Pod Autoscaler: https://kubernetes.io/docs/tasks/run-application/horizontal-pod-autoscale/
- Elasticsearch Reindex API: https://www.elastic.co/guide/en/elasticsearch/reference/current/docs-reindex.html
- Kibana Index Management: https://www.elastic.co/guide/en/kibana/current/index-management.html
- Kubernetes docs (resources/requests/limits): https://kubernetes.io/docs/concepts/configuration/manage-resources-containers/