

30200.
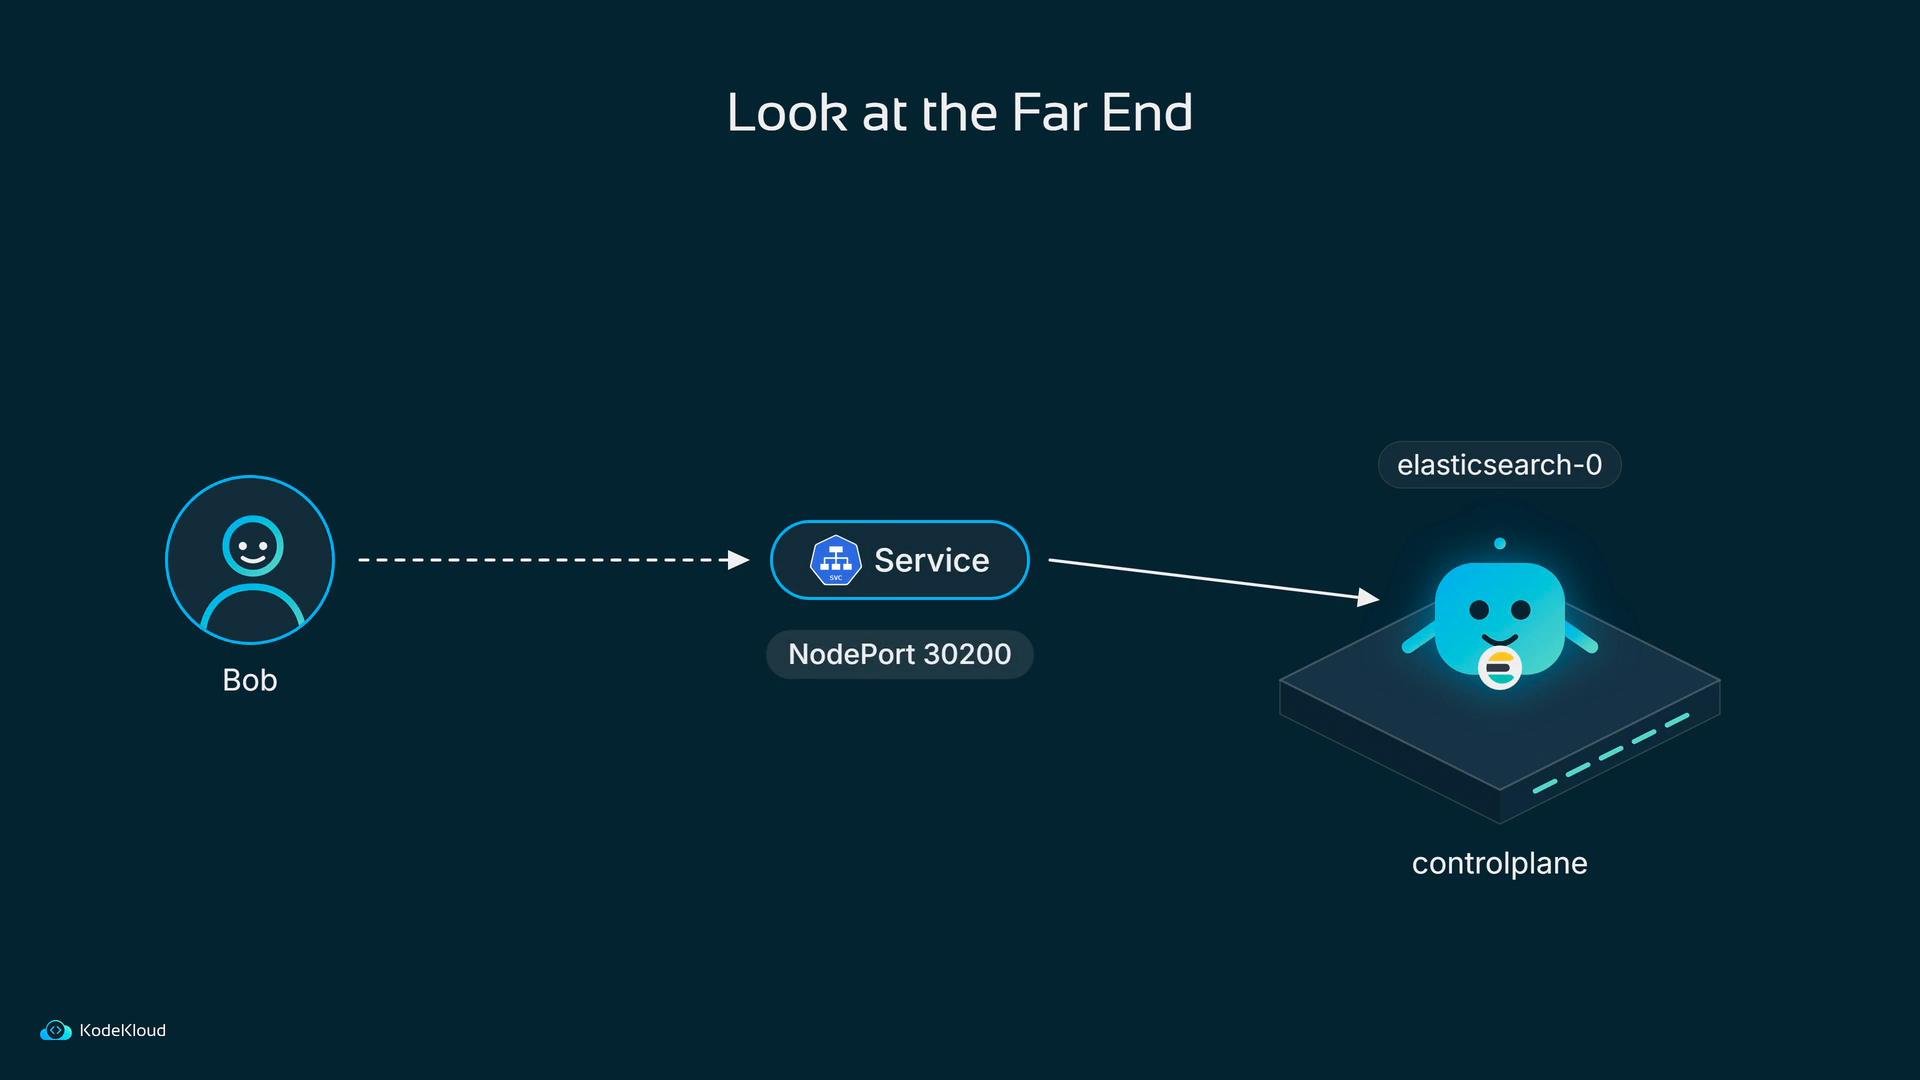
Query Elasticsearch to confirm documents arrive
Start by asking Elasticsearch for everything. The_search endpoint with q=*:* and pretty returns all documents in a readable JSON format:
Fluentd buffers records and flushes them on a schedule (e.g., every 5 seconds). If the first search returns no hits, wait a few seconds and try again.
hits. Each document represents a log line parsed into fields by Fluentd. Example document returned from Elasticsearch:
- A
logfield containing the application message. - A
streamfield indicatingstdout. - An index named with the
fluentdprefix plus the date (as configured). - A
kubernetes.pod_namefield tying the document back to theapppod.
Verify the logs match the pod output
To prove end-to-end delivery, compare the pod’s logs with the documents in Elasticsearch. Bob places two panes side-by-side: one runningkubectl logs and the other showing the Elasticsearch JSON results.
Example pod output:
hits (trimmed):
Searching for specific values
You can query Elasticsearch directly from the terminal. To search for documents mentioningUSER1:
size is 10). A short result doesn’t necessarily mean missing data — increase the size parameter if you expect more results.
Elasticsearch defaults
size to 10. If you expect more results, include a larger size value (for example, size=10000) in the query:size, additional log lines appear in the results:
Quick reference: common terminal checks
Summary: what a successful pipeline looks like
End-to-end success means:- The application writes a line to stdout or to a file on the node.
- Fluentd tails, parses, buffers, and ships the record.
- Elasticsearch receives and stores the document in an index named with the
fluentdprefix + date. - You can query Elasticsearch and verify the stored documents match the original pod logs.