

- Build a small agent that receives a system prompt (the runbook and instructions) plus a ticket and log excerpt.
- Call the model once, inspect the model’s token usage (input_tokens and output_tokens), and compute the cost.
- Scale that single-call cost to a monthly estimate using expected traffic.
Input vs output pricing matters because even modest increases in output length can dominate costs. Measure both.
- Send a single, representative request (system prompt + ticket + logs) to the model.
- Inspect exactly what the provider counts (input & output tokens) in the response usage metadata.
- Compute the cost for that single call, then scale to monthly volume.
- Input tokens: 9,333
- Output tokens: 600
This matches the earlier statement that this Sonnet call costs roughly two cents. If you pick a higher-tier model with higher rates, the same token counts can cost several times more (for example, ~11 cents with a pricier frontier model in a comparative example).
Estimator UI (example)
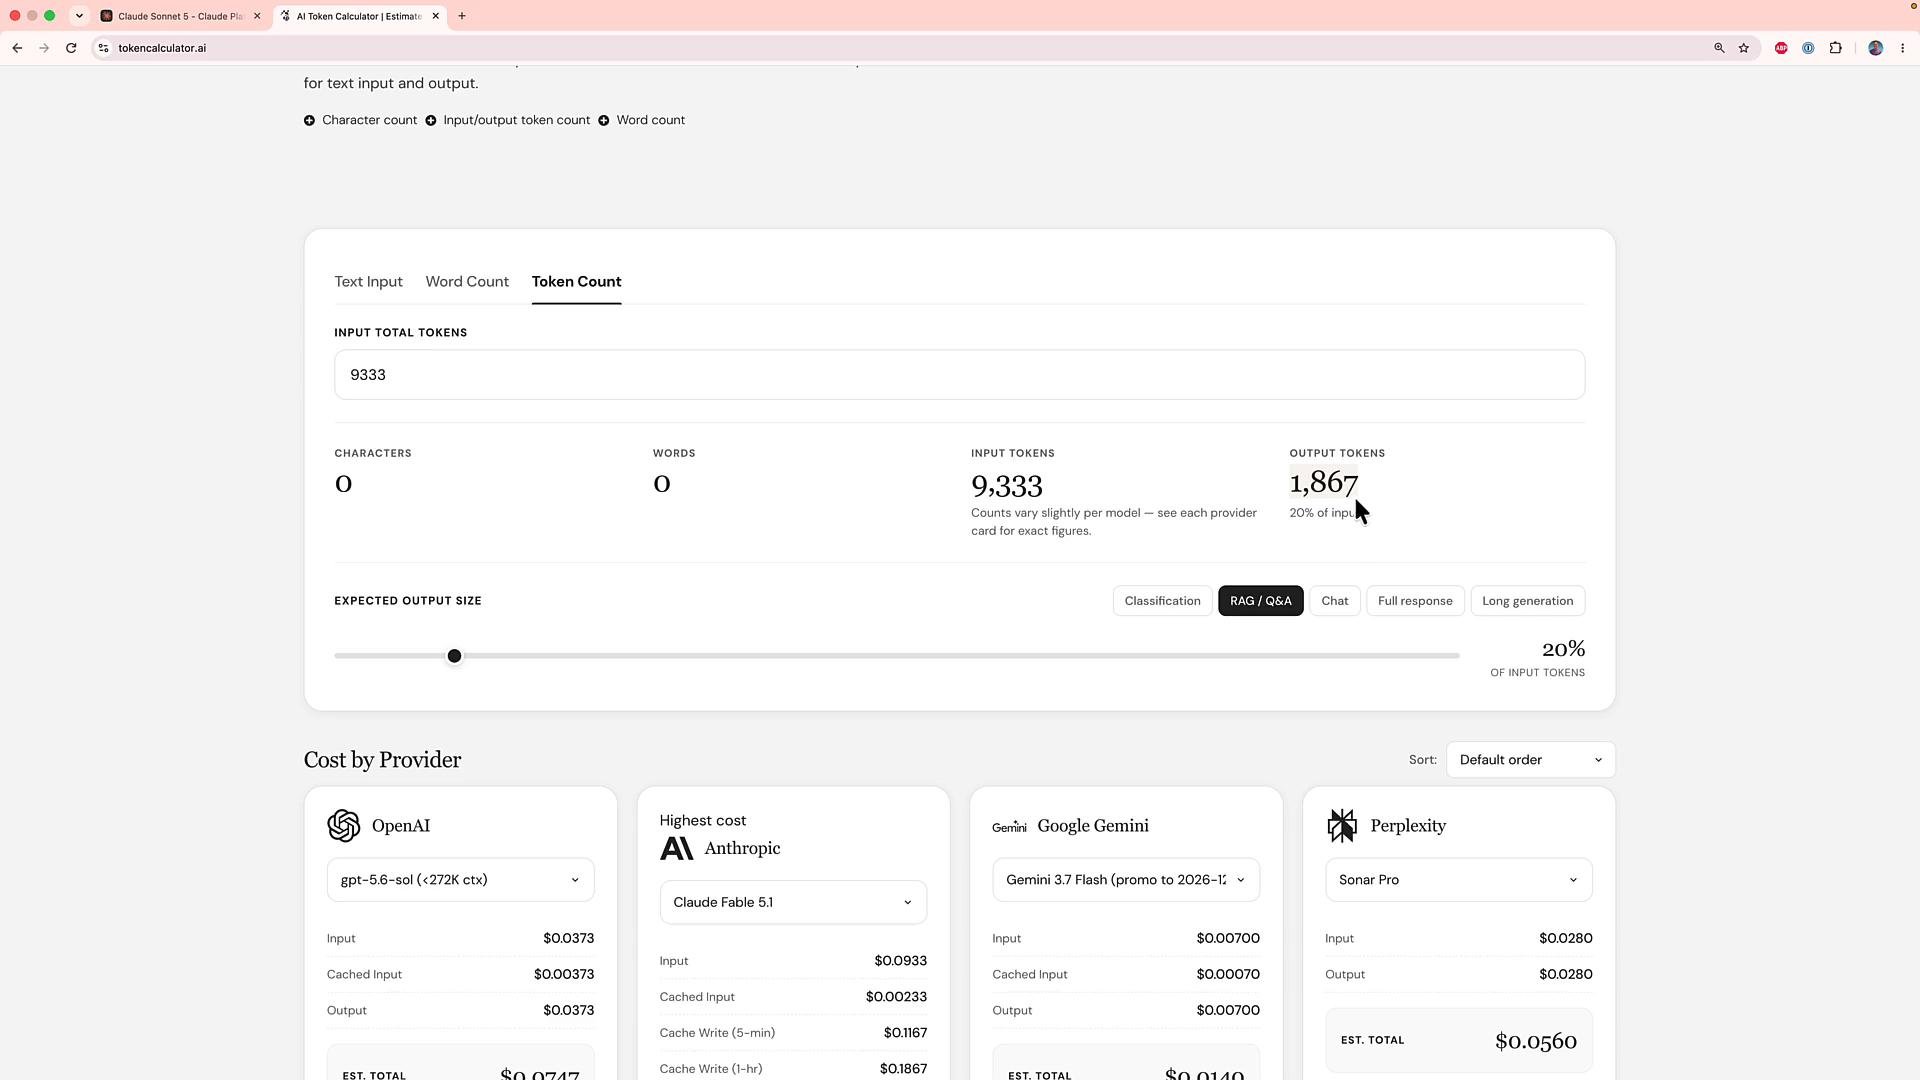
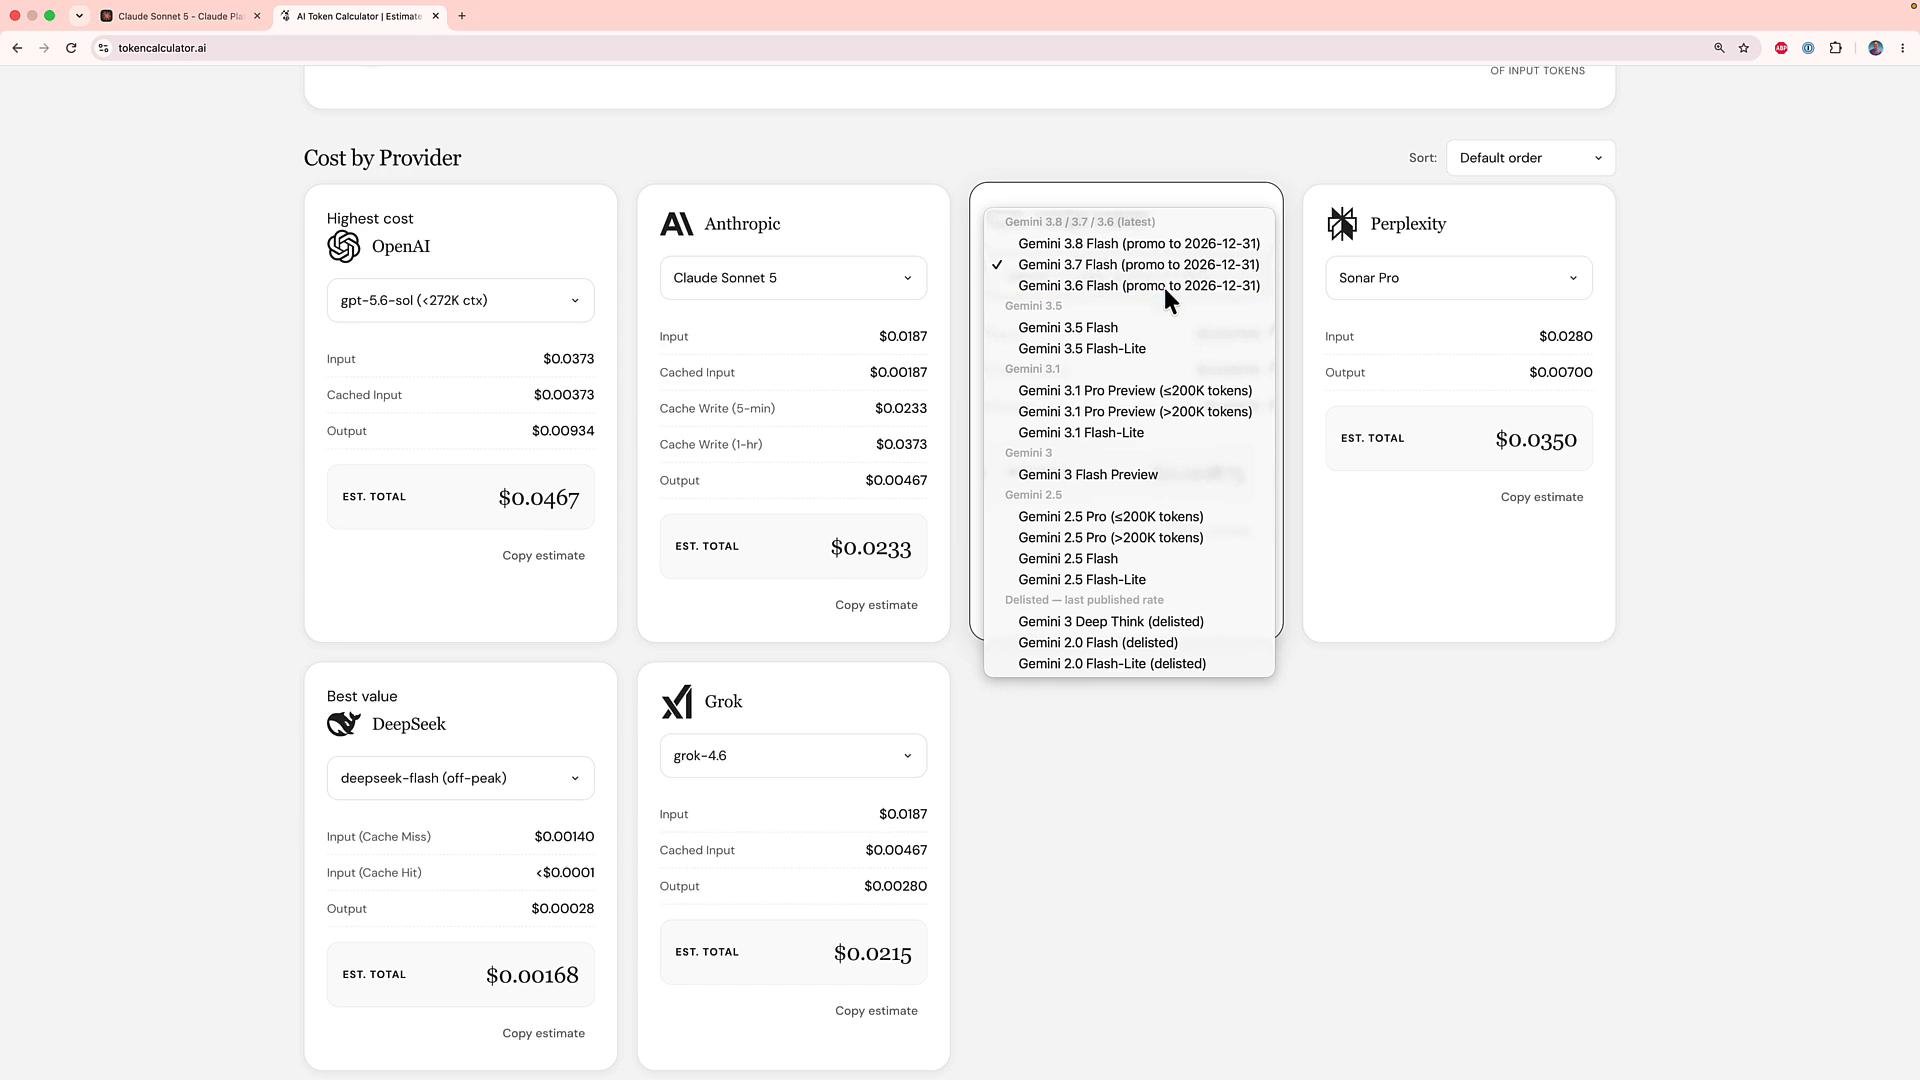
Use a token/cost calculator or a dashboard to experiment with different input/output mixes and providers. For projection you might assume output tokens are a percentage of input tokens (e.g., 20%). The screenshot below shows an input total of 9,333 tokens and an estimated output of ~1,867 tokens (20% of input).
- Measure token usage on representative requests (input + output) — it’s the only reliable way to forecast costs for your workload.
- Output tokens often cost more than input tokens. Small differences in output size or model selection can change costs materially.
- Average over many tickets to produce a stable per-request estimate, then multiply by monthly call volume to get a monthly spend projection.
- Don’t default to the most expensive frontier model — cheaper models may meet accuracy requirements at a fraction of the cost.
Pricing and token accounting vary by provider and model. Always verify the provider’s usage metadata (the response usage fields) and pricing page before projecting monthly costs.
- Anthropic Pricing
- Kubernetes Basics (example reference for infrastructure-related cost comparisons)
- OpenAI Pricing
- Best practices for measuring model usage and reducing token costs
- Designing prompts and outputs to minimize expensive output tokens
- Building dashboards to track per-feature LLM costs and budget forecasts