This article provides a detailed overview of the BlueOcean dashboard interface for managing and troubleshooting Jenkins pipelines.
Now that we’ve observed a pipeline in action, let’s examine the BlueOcean dashboard interface in detail. In this lesson, we will walk through the key components of the pipeline view, highlighting how to navigate and interpret the various elements.
Upon selecting a specific pipeline run, you can inspect the individual stages and steps executed within it. For example, the initial step involves pulling the Go web app sample from GitHub:
The recommended git tool is: NONENo credentials specifiedWarning: JENKINS-30600: special launcher org.jenkinsci.plugins.docker.workflow.WithContainerStep$Decorators$1@656b86d53; decorates RemoteLauncher[hudson.remoting.Channel@326e796b:ubuntuagent] will be ignored (a typical symptom is the Git executable not being found)Cloning the remote Git repositoryAvoid second fetchChecking out Revision 8b15445397d3fa8110566c45b8d98f0b8f7a6 (refs/remotes/origin/master)Commit message: "dockerfile"First time build. Skipping changelog.Cloning repository https://github.com/AdminTurnedDevOps/go-webapp-sample.git> git init /home/newuser/workspace/gobuild # timeout=10
The log above confirms that the pipeline successfully cloned the repository and checked out the specified commit.
Make sure that your Git configuration is set correctly to avoid warnings related to missing credentials or executables.
Another crucial step is verifying that the correct Go environment is set up for your build. Within the pipeline, the Go version is explicitly executed to ensure that the appropriate Go environment is available:
go version
This command confirms the Go version installed on the build agent, ensuring compatibility with your project’s requirements.
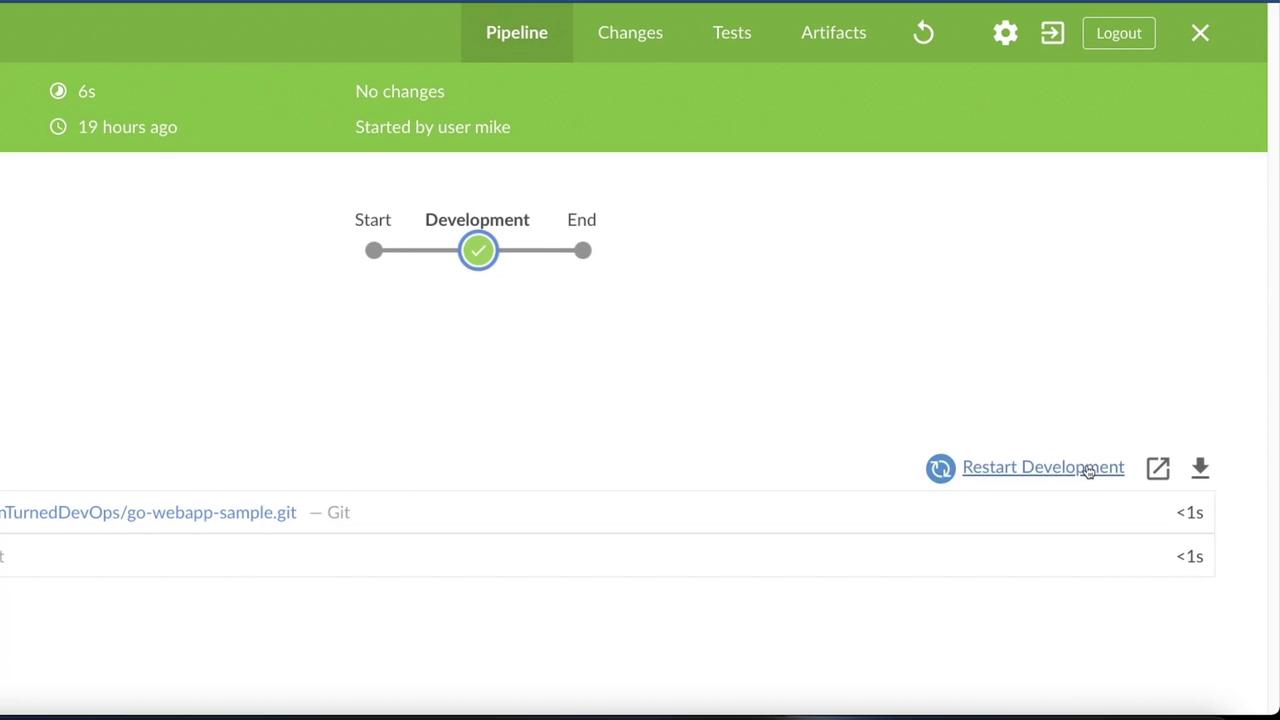
If you need to troubleshoot or analyze pipeline execution further, the BlueOcean dashboard provides two key features:
Restart the Pipeline: Quickly re-run the pipeline to test fixes or updates.
Download the Log File: Access a comprehensive log file that includes detailed insights into the pipeline’s performance and any issues encountered.
Below is an image illustrating the dashboard interface with options to restart the pipeline and view execution details:
Downloading the log file is especially useful for troubleshooting, as it includes critical information such as tests archived, artifacts created, runtime duration, change timings, and the user who initiated the build.
The BlueOcean interface is designed primarily to enhance visualization and provide an intuitive user experience for monitoring and interacting with your pipelines. It leverages familiar patterns to make managing complex builds straightforward.
Now that you have an in-depth look at the BlueOcean dashboard and its functionalities, continue with further hands-on exercises to deepen your understanding of managing and troubleshooting Jenkins pipelines.For additional resources and detailed documentation, consider visiting Jenkins Documentation or BlueOcean Overview.Keep exploring to master the intricacies of Jenkins pipelines and optimize your continuous integration and delivery processes.