This article explains how to integrate Prometheus with Jenkins to automatically expose and monitor Jenkins metrics.
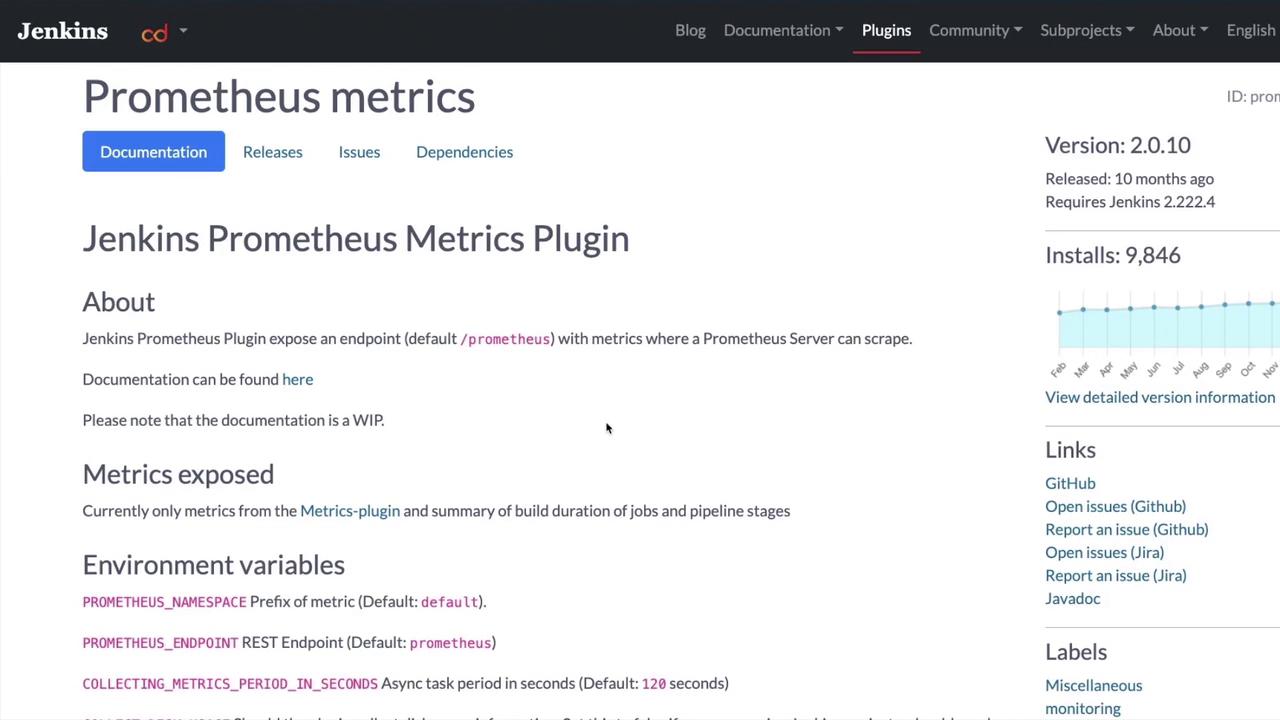
In this lesson, we explore how the Jenkins Prometheus Metrics Plugin automatically exposes Jenkins metrics on a dedicated endpoint. By accessing the URL http://<jenkins_server_ip>:8080/Prometheus, you can view metrics output similar to the sample below:
# HELP process_cpu_seconds_total Total user and system CPU time spent in seconds.# TYPE process_cpu_seconds_total counterprocess_cpu_seconds_total 32.15# HELP process_start_time_seconds Start time of the process since unix epoch in seconds.# TYPE process_start_time_seconds gaugeprocess_start_time_seconds 1.64579412765559# HELP process_open_fds Number of open file descriptors.# TYPE process_open_fds gaugeprocess_open_fds 347.0# HELP process_max_fds Maximum number of open file descriptors.# TYPE process_max_fds gaugeprocess_max_fds 1048576.0# HELP process_virtual_memory_bytes Virtual memory size in bytes.# TYPE process_virtual_memory_bytes gaugeprocess_virtual_memory_bytes 2.71161149449E9# HELP process_resident_memory_bytes Resident memory size in bytes.# TYPE process_resident_memory_bytes gaugeprocess_resident_memory_bytes 3.969925128E8# HELP default_jenkins_up Is Jenkins ready to receive requests# TYPE default_jenkins_up gaugedefault_jenkins_up 1.0# HELP default_jenkins_uptime Time since Jenkins machine was initialized# TYPE default_jenkins_uptime gaugedefault_jenkins_uptime 182986.0# HELP jvm_classes_loaded The number of classes that are currently loaded in the JVM# TYPE jvm_classes_loaded gaugejvm_classes_loaded 14283.0# HELP jvm_classes_loaded_total The total number of classes that have been loaded since the JVM has started execution# TYPE jvm_classes_loaded_total counterjvm_classes_loaded_total 128484.0# HELP jvm_classes_unloaded_total The total number of classes that have been unloaded since the JVM has started execution# TYPE jvm_classes_unloaded_total counterjvm_classes_unloaded_total 143.0# HELP default_jenkins_build_duration_milliseconds_summary Summary of Jenkins build times in milliseconds by Job# TYPE default_jenkins_build_duration_milliseconds_summary summarydefault_jenkins_build_duration_milliseconds_summary_count{jenkins_job="test1",repo="NA"} 1.0default_jenkins_build_duration_milliseconds_summary_sum{jenkins_job="test1",repo="NA"} 5634.0default_jenkins_build_duration_milliseconds_summary_count{jenkins_job="test2",repo="NA"} 1.0default_jenkins_build_duration_milliseconds_summary_sum{jenkins_job="test2",repo="NA"} 951.0default_jenkins_build_duration_milliseconds_summary_count{jenkins_job="go-full-pipeline",repo="NA"} 18.0default_jenkins_build_duration_milliseconds_summary_sum{jenkins_job="go-full-pipeline",repo="NA"} 501911.0
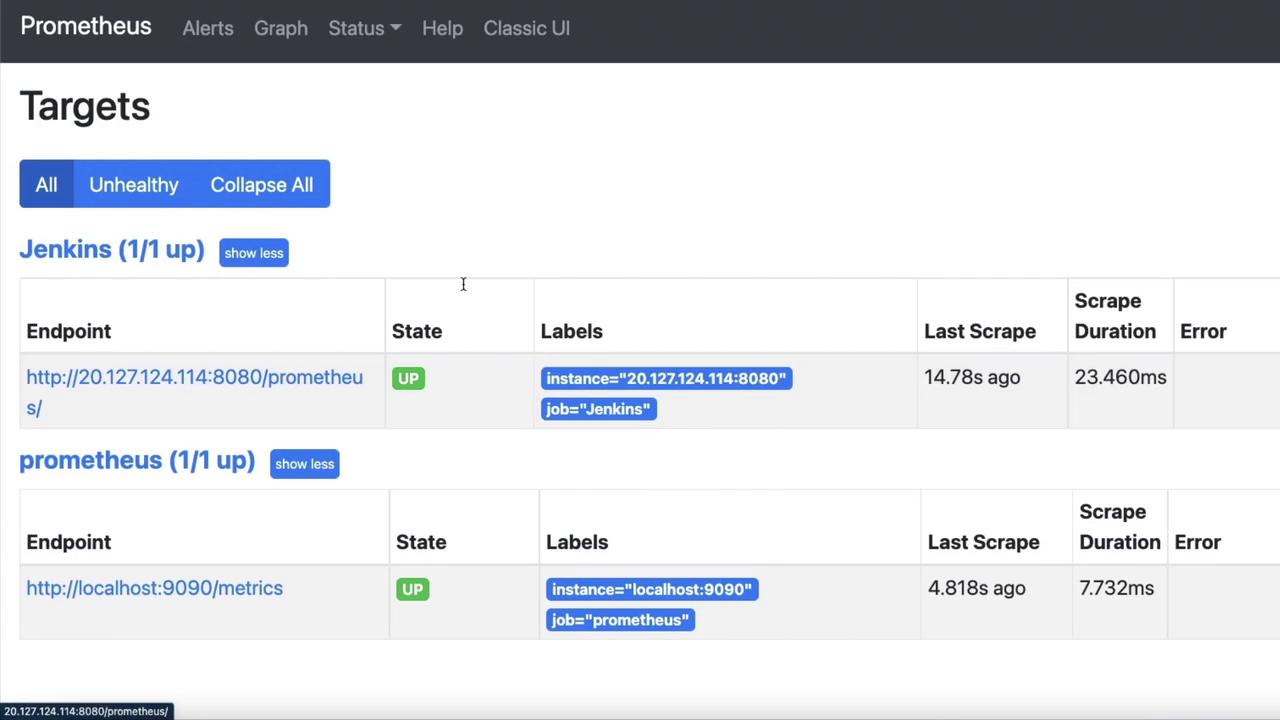
The Prometheus plugin installed on your Jenkins server automatically generates this output. The plugin configures the /Prometheus endpoint to expose metrics in a format that Prometheus can seamlessly scrape.
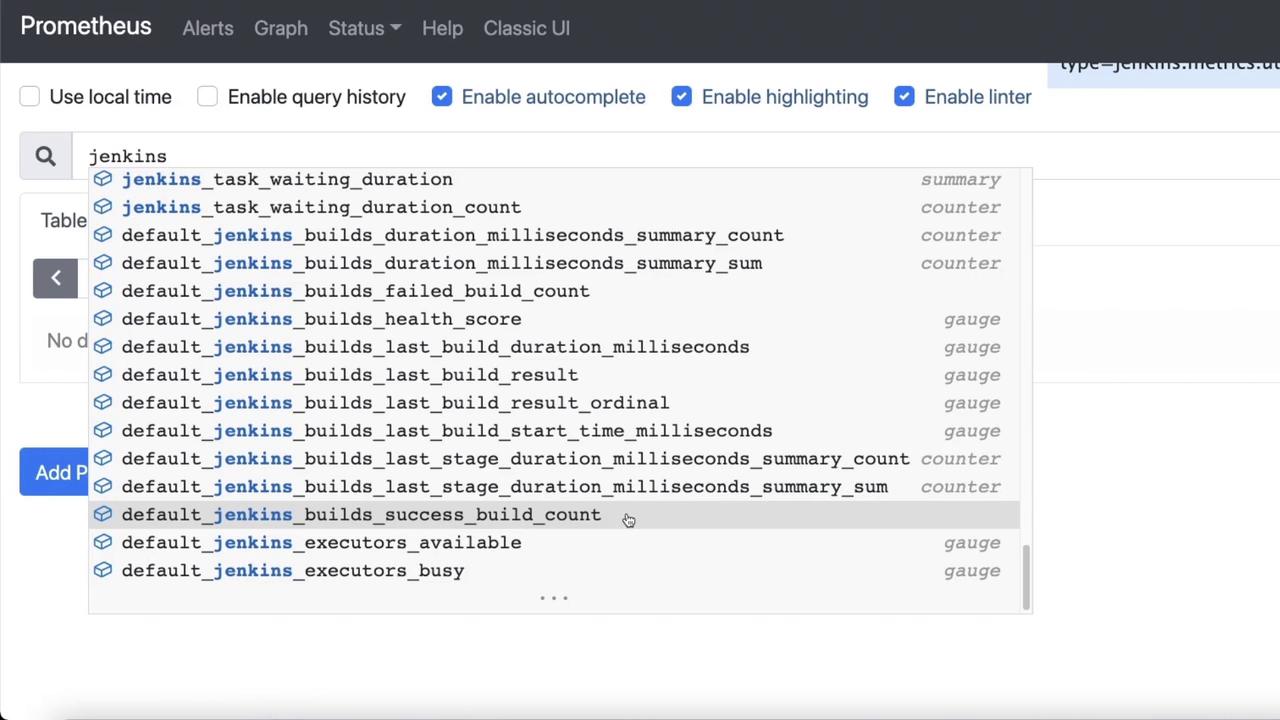
The metrics output follows a structured format that is similar to JSON or key-value pairs. Consistent formatting ensures that Prometheus understands and properly ingests the data. Although subsequent scrapes might reflect updated values or minor variations in metric names—such as differences in build duration or class loading statistics—the overall structure remains unchanged.Once Prometheus scrapes the /Prometheus endpoint, you can explore these metrics directly within the Prometheus dashboard. For example, entering a query like “Jenkins” in the Prometheus expression browser retrieves various Jenkins-specific metrics, including build success counts. Consider the following query output:
This output confirms that your Jenkins jobs—specifically “go-full-pipeline,” “test1,” and “test2”—have successfully completed builds. Jobs that have not been triggered, such as “Git test build pipeline” or “SH test build pipeline,” will not appear in these metrics.
You can further analyze your Jenkins data by experimenting with different queries in the Prometheus web interface. Typing “Jenkins” in the expression field displays all available metrics, including task durations and build counts, to help you better understand your CI/CD performance.
Keep in mind that the IP address shown in the examples might differ from your actual setup, as it reflects the specific instance or runtime conditions of your Jenkins server.
This lesson has provided an overview of how Prometheus scrapes and displays Jenkins metrics. We hope this helps you effectively monitor and analyze your Jenkins environment. See you in the next lesson!