

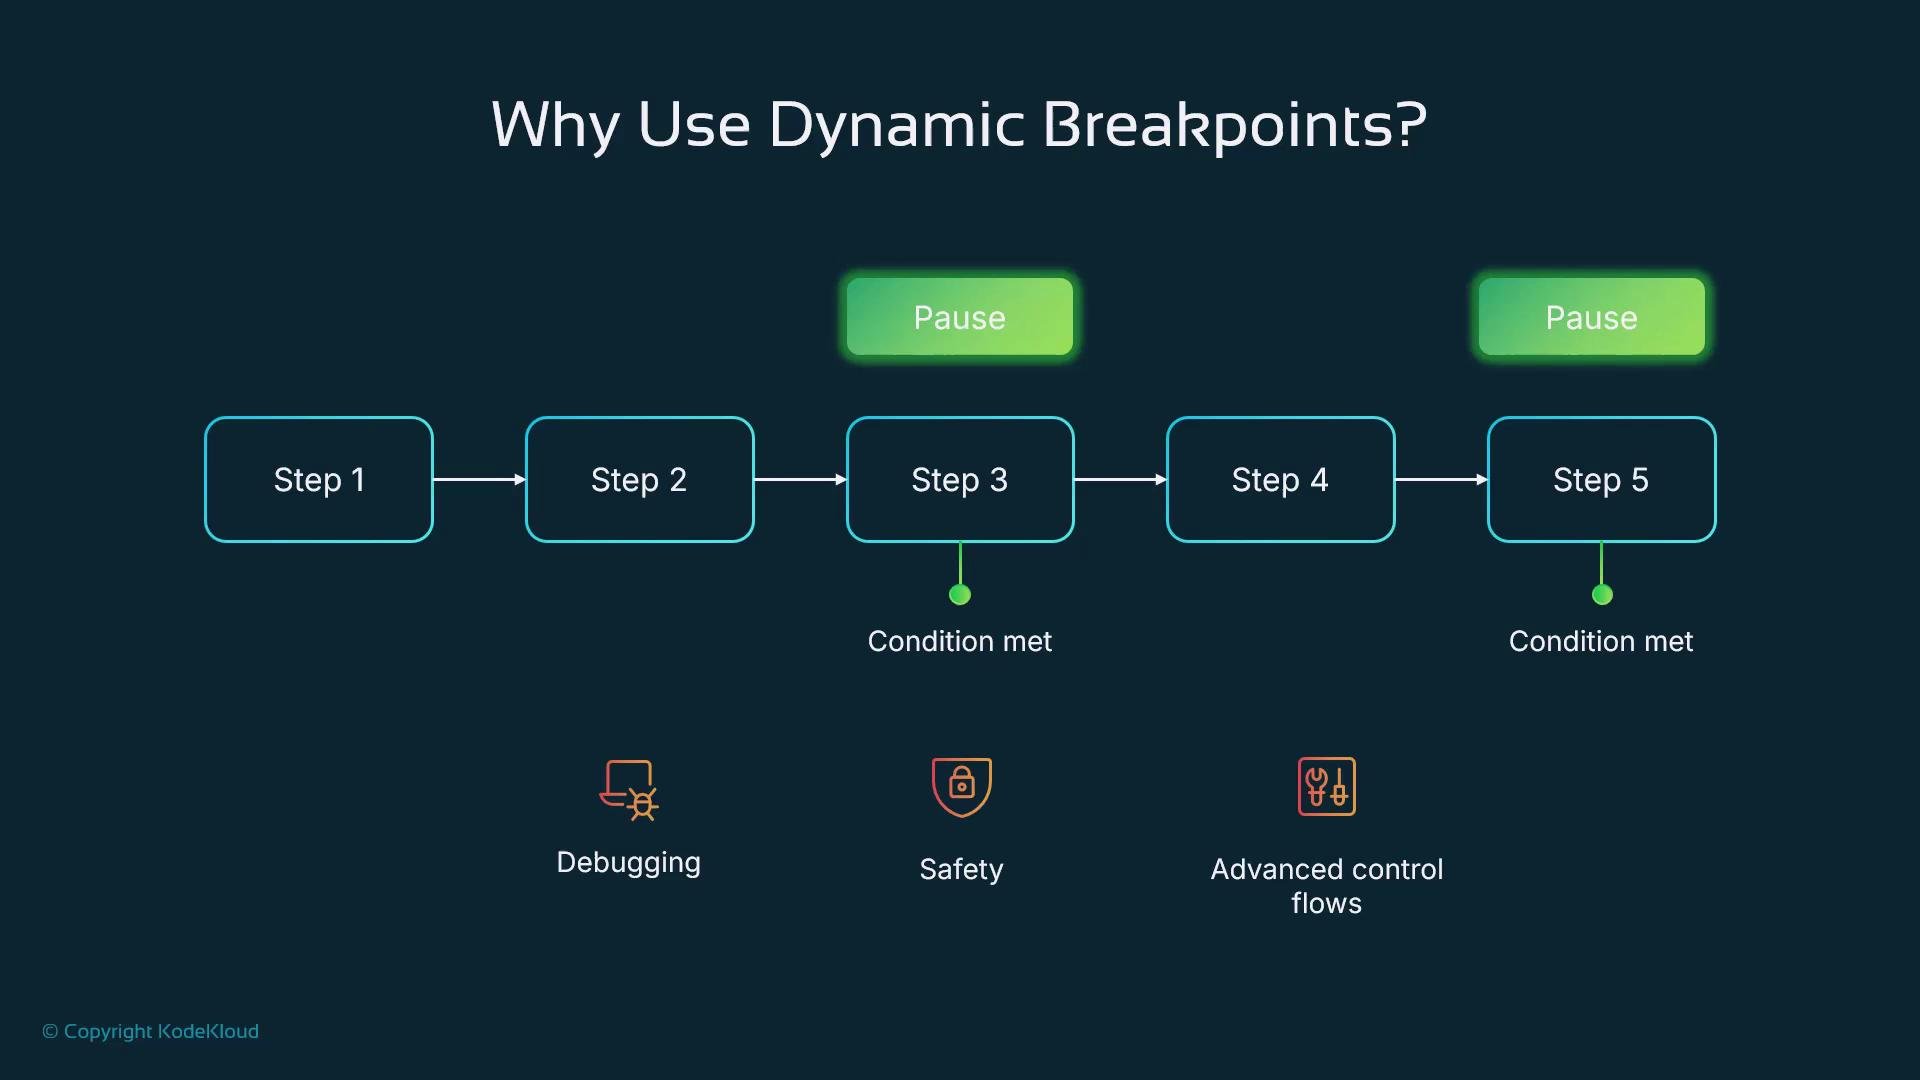
state—for example, confidence, tool_name, or a retry_count. When the condition is true, the graph issues an interrupt and pauses so the current state can be inspected, modified, or logged. When the condition is false, execution proceeds uninterrupted. This yields context-aware pauses that reduce noise and focus developer attention where it’s needed.
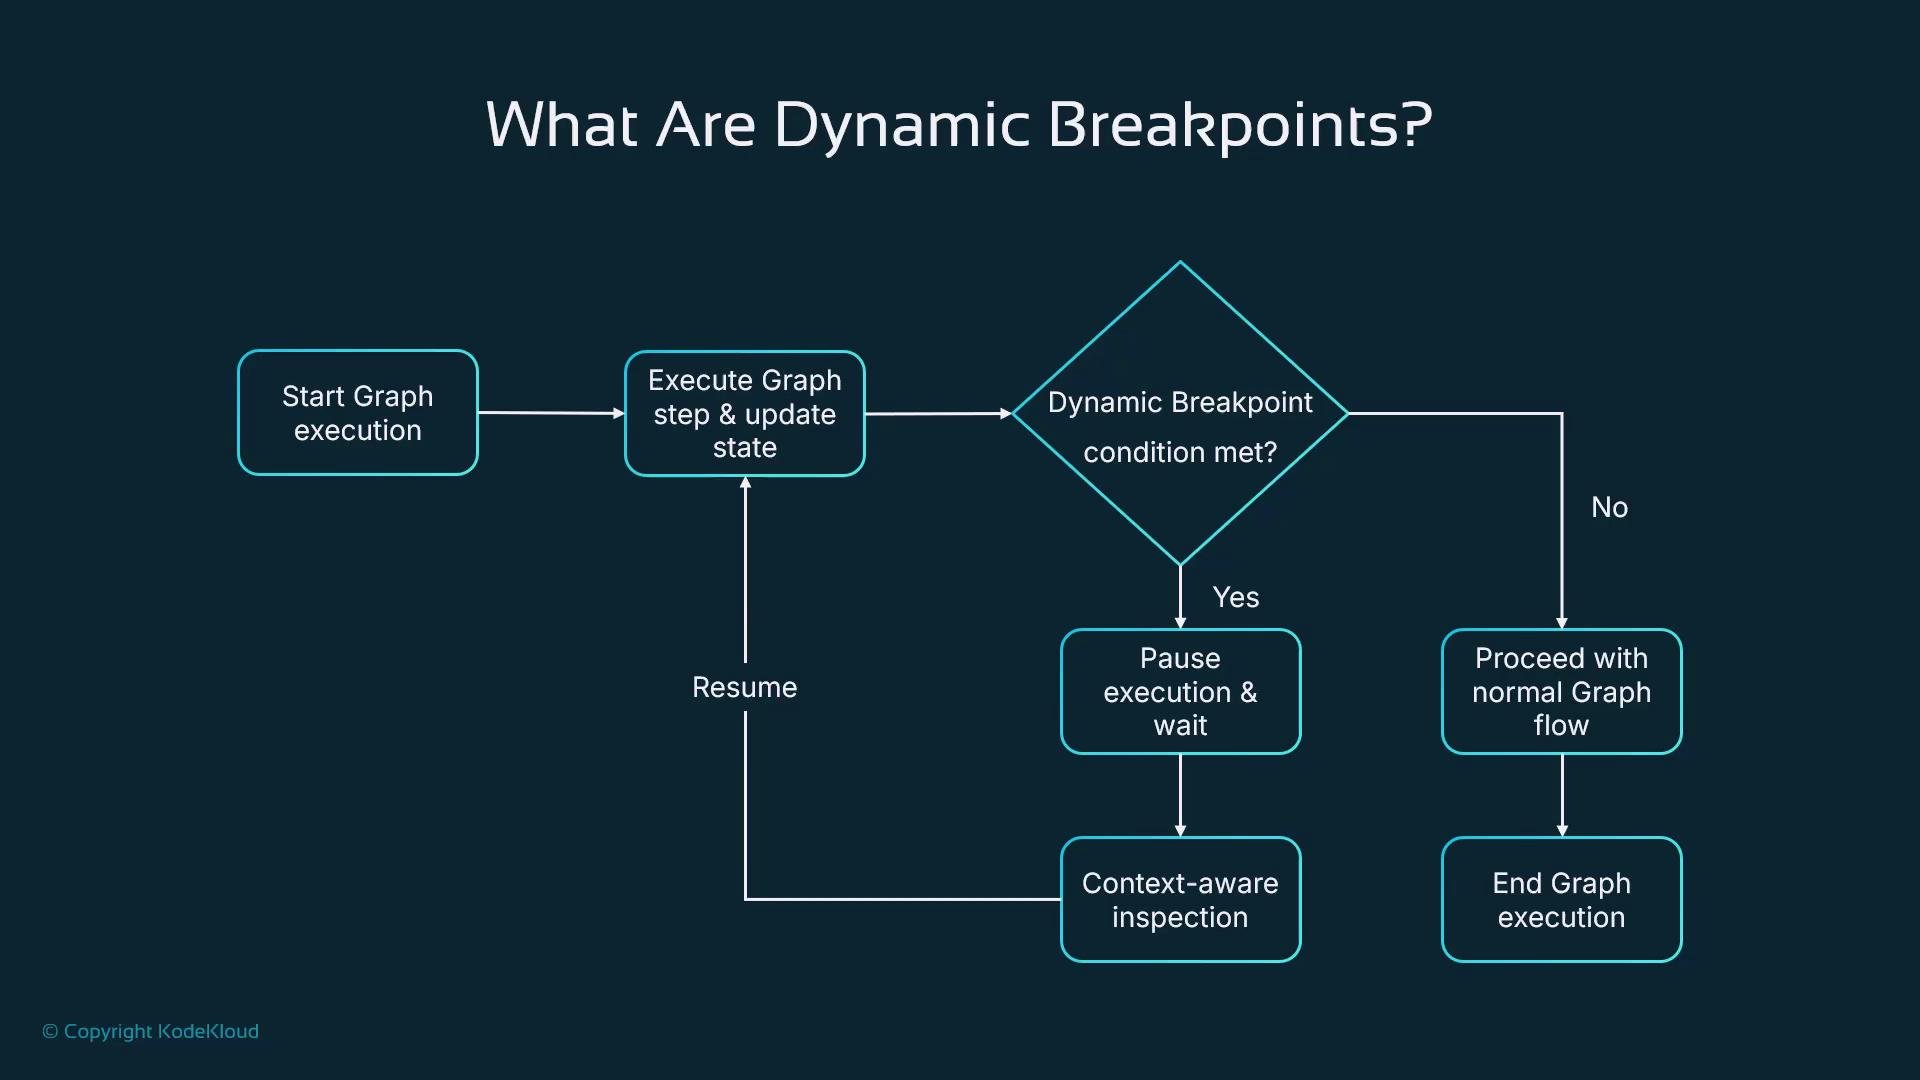
state’s confidence value falls below 0.7. Use state.get(...) with a sensible default to avoid KeyError and to keep the graph robust.
interrupt(...) pauses the run and surfaces the provided payload (for example, the state_snapshot), letting a developer or UI inspect and act. If it doesn’t fire, the node returns the state and execution continues.
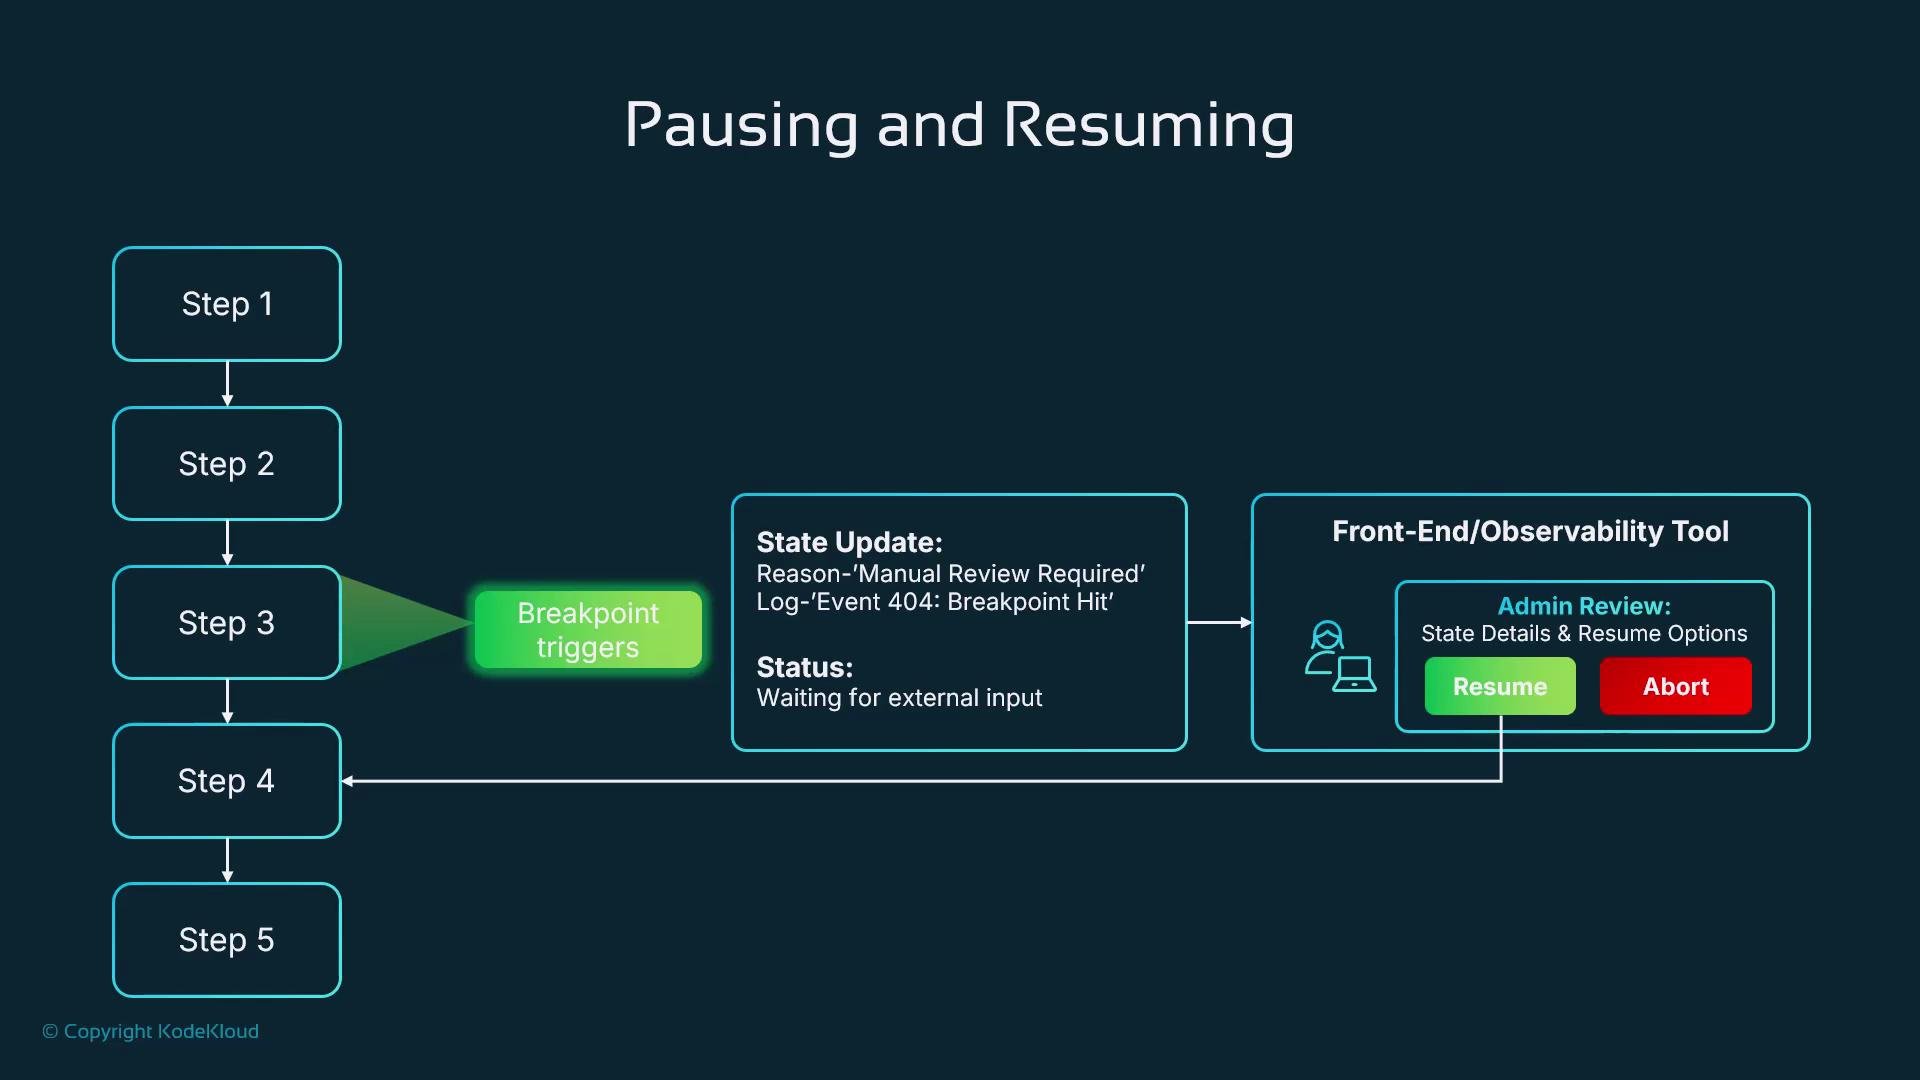
- Surface the full
stateand the pause reason in a developer or operator UI. - Attach debug logs, metrics, and relevant metadata for quick triage.
- Allow the operator to resume, abort, or modify the
stateand continue the run. - Tag traces and archive evidence for audits and post-mortems.
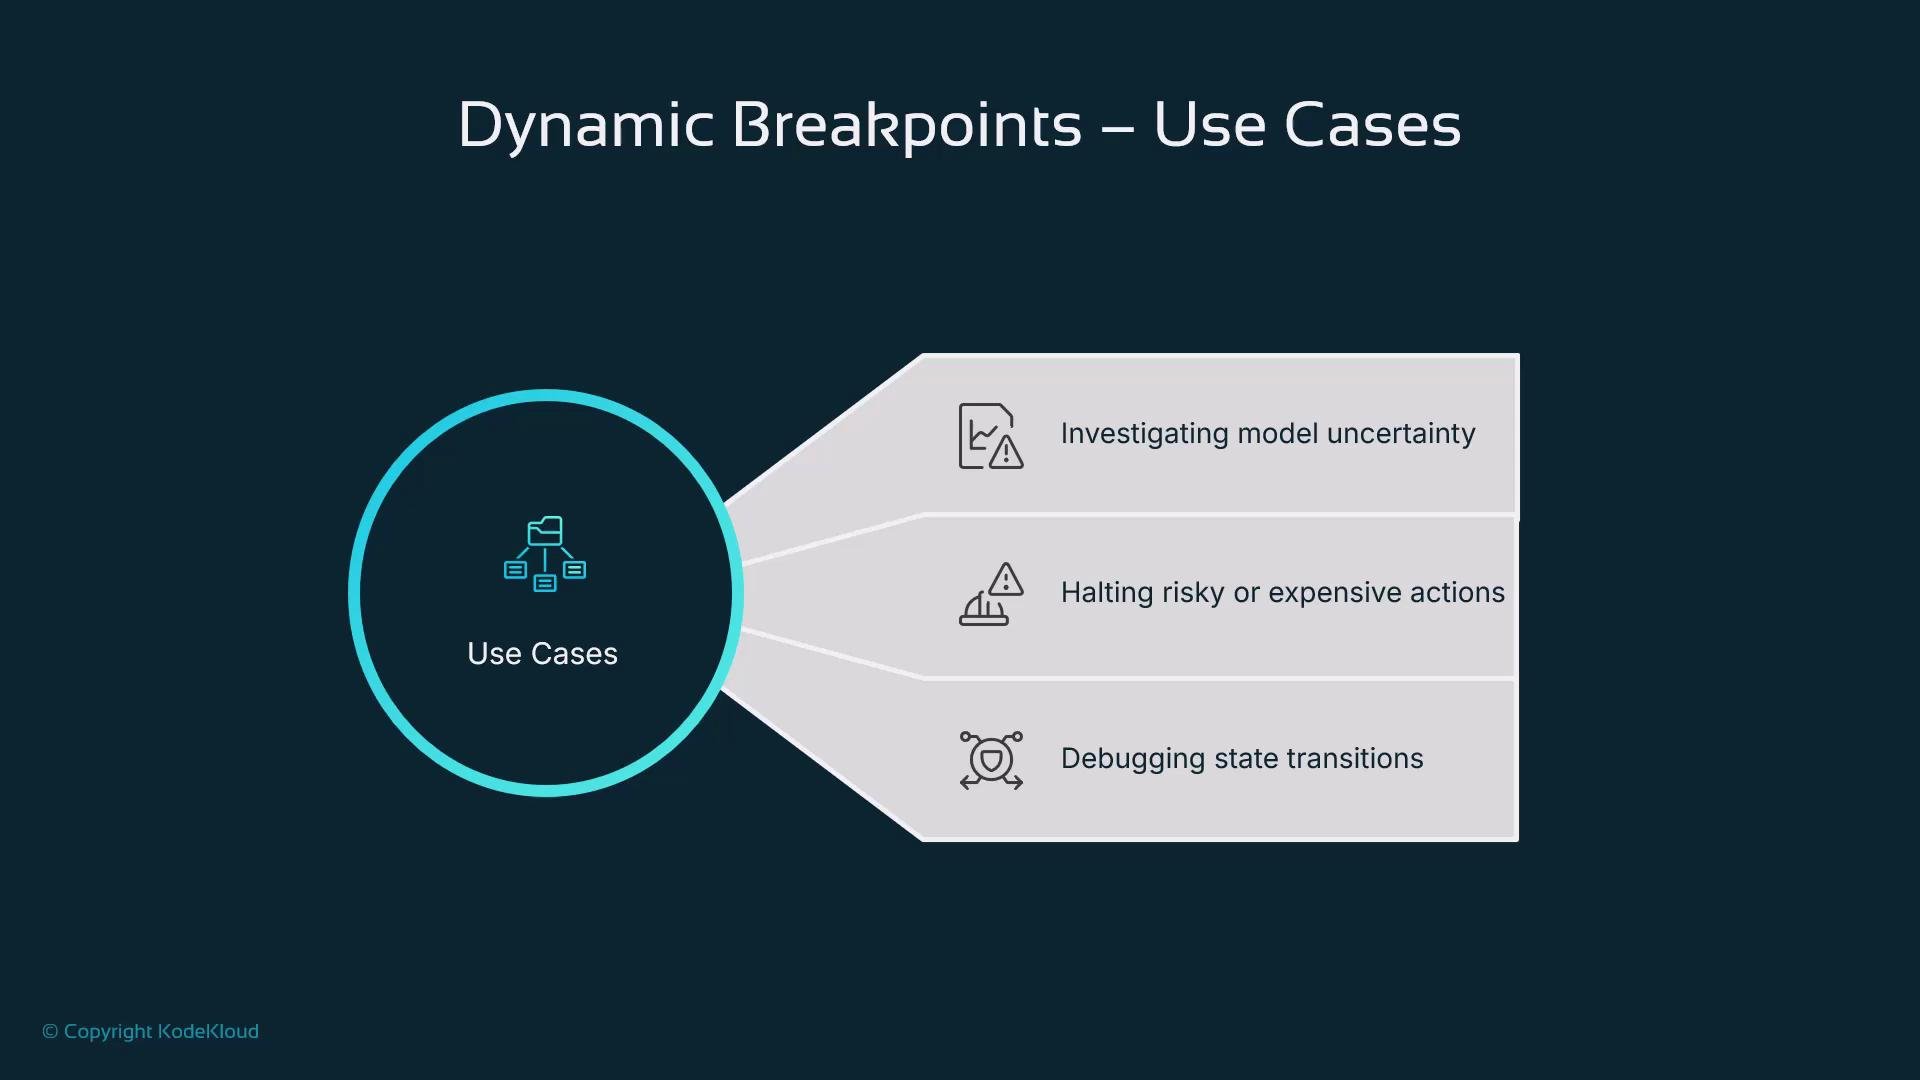
- Surface the full
state, logs, and the explicit reason for the pause in the UI or observability platform. - Provide controls to resume, abort, or update the
stateand continue execution. - Tag traces for easy filtering and post-incident analysis.
- Enable dynamic breakpoints selectively (for example via a
debug: truestate flag or environment checks). - Log the location and reason for every pause for audits and debugging.
- Avoid heavy use of breakpoints in high-volume production paths—use them primarily in development, staging, or for flagged users.
- Complement breakpoints with automated checks, rate limits, and other safeguards.
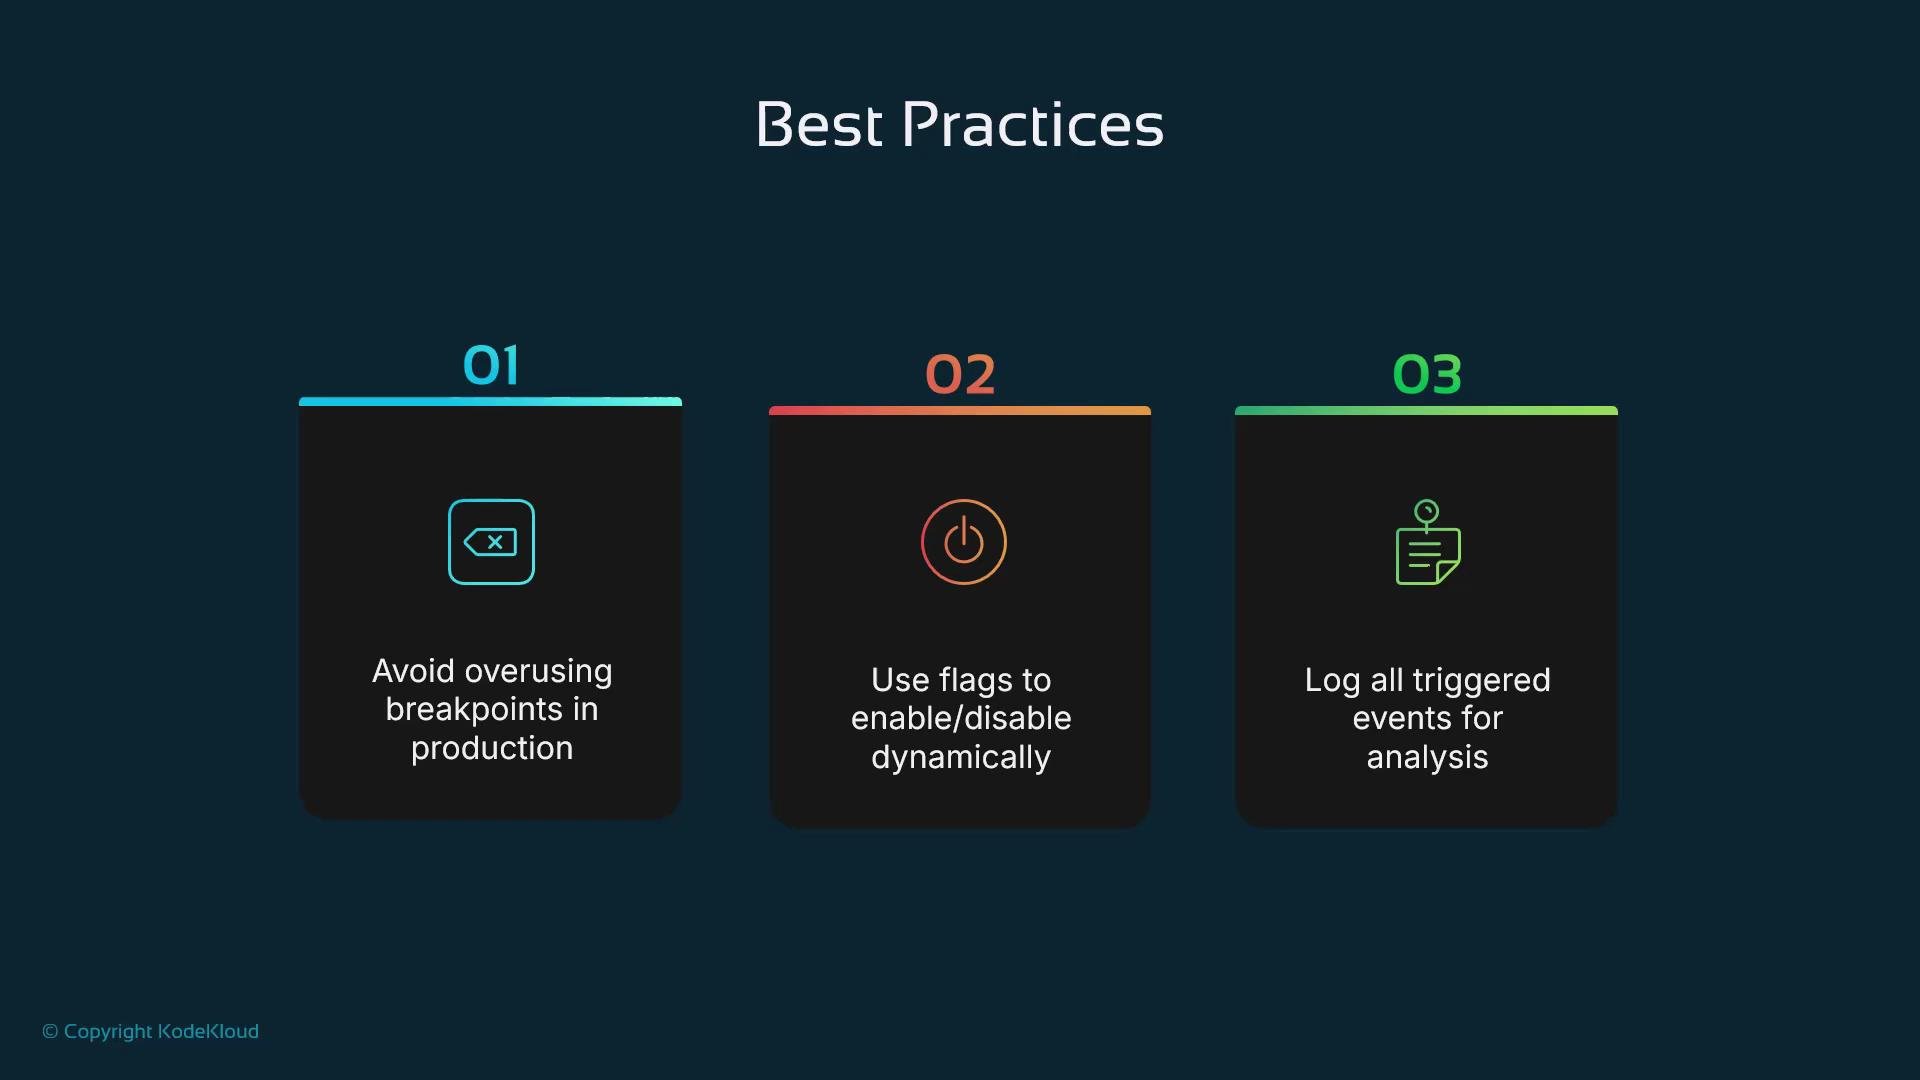
Enable dynamic breakpoints only when needed. Prefer a state flag (for example,
debug: true) or environment-based checks to avoid impacting production performance or user experience.Do not rely on dynamic breakpoints as the only safety mechanism. Use them alongside automated checks, rate limits, and other safeguards to prevent accidental or malicious actions.
interrupt(...) mechanism, you can implement targeted checks that pause execution only when a condition truly requires human or automated intervention—improving safety, debuggability, and operational control.
Links and references
- LangGraph docs (reference for graph state and node APIs)
- Observability best practices (principles for logging and operational controls)