In this guide, you’ll configure an Amazon CloudWatch alarm that notifies you via email whenever an EC2 instance’s average CPU usage exceeds 70% over a five-minute period. This is essential for maintaining optimal performance and responding swiftly to resource bottlenecks.Documentation Index
Fetch the complete documentation index at: https://notes.kodekloud.com/llms.txt
Use this file to discover all available pages before exploring further.
Prerequisites
| Requirement | Description |
|---|---|
| AWS account with CloudWatch access | Permissions to view metrics and create alarms |
| Running EC2 instance | The instance you intend to monitor |
| Verified email subscription for SNS | Confirmed subscription to receive alarm notifications |
Make sure your IAM user or role has the following managed policies:
CloudWatchFullAccessAmazonSNSFullAccess
1. Open the Alarms Dashboard
- Sign in to the AWS Management Console and open CloudWatch.
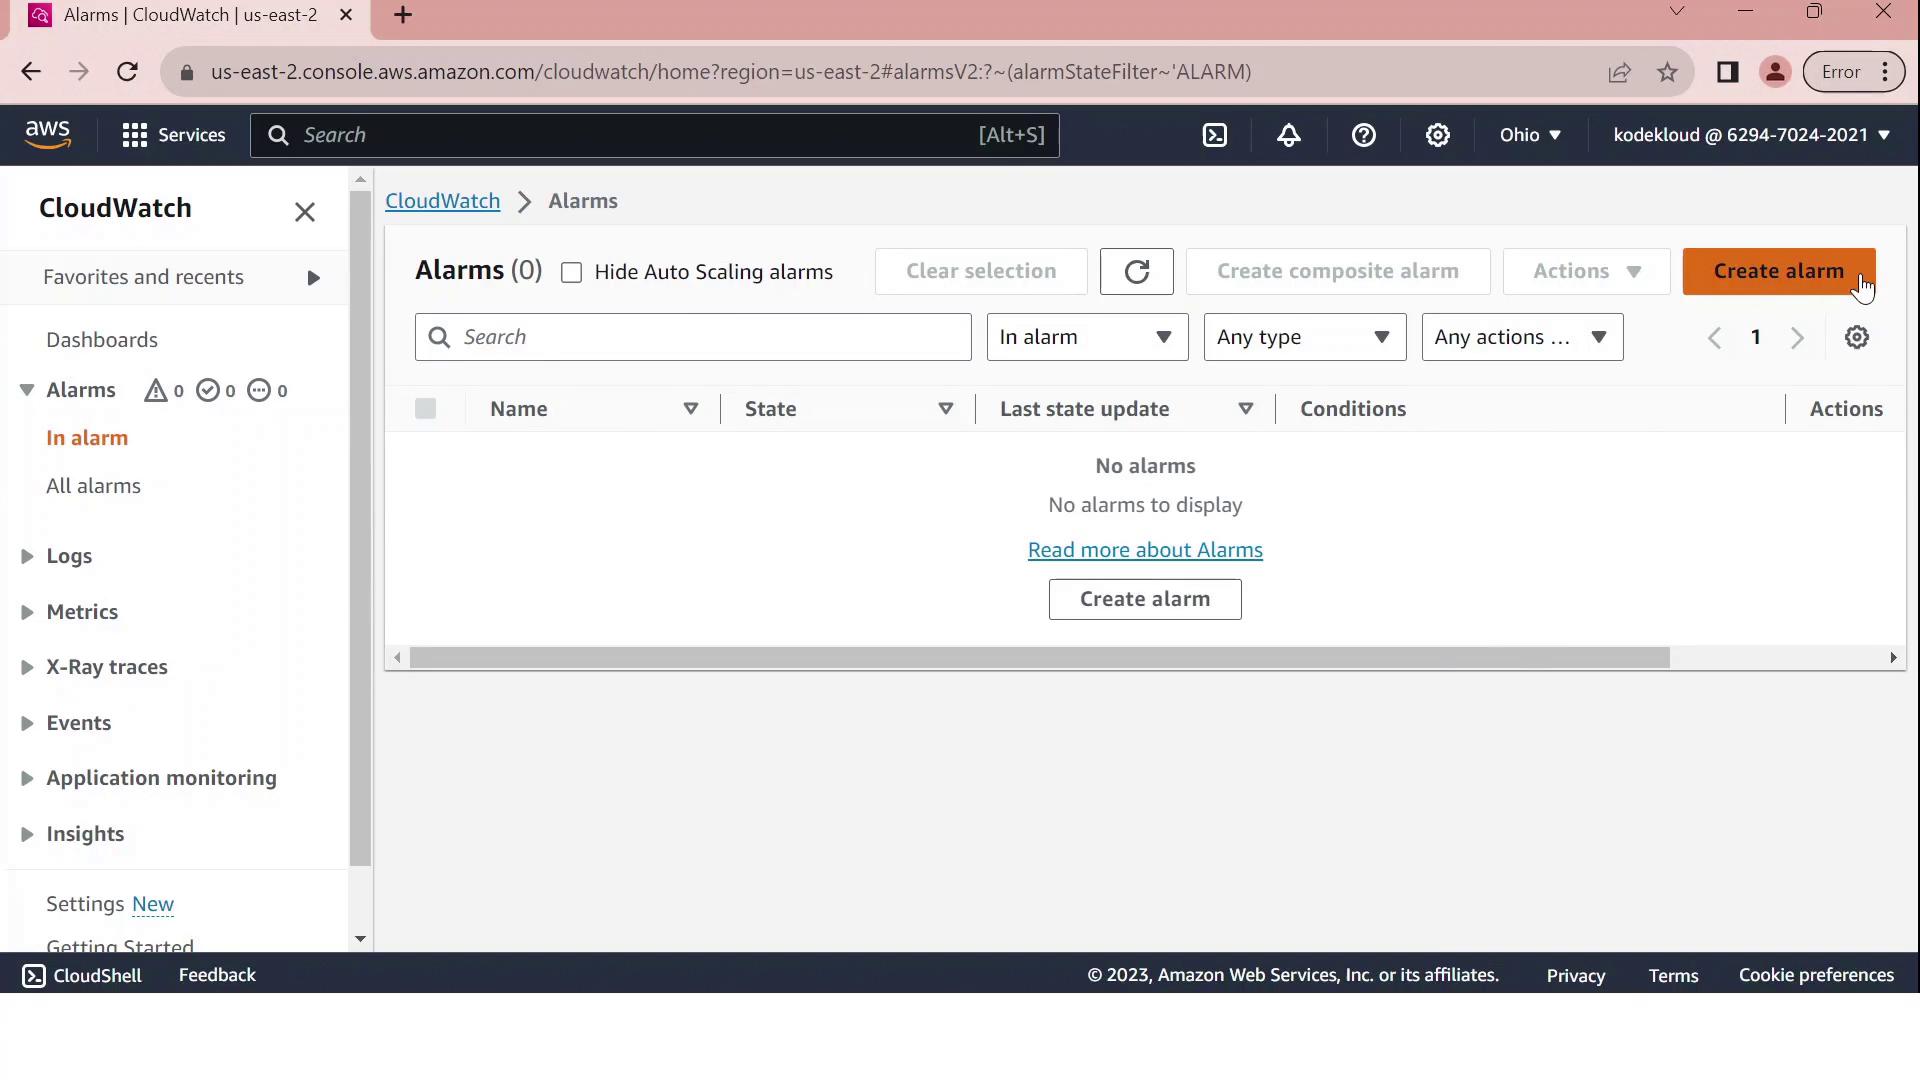
- In the left navigation pane, choose Alarms, then click Create alarm.
2. Select the EC2 CPUUtilization Metric
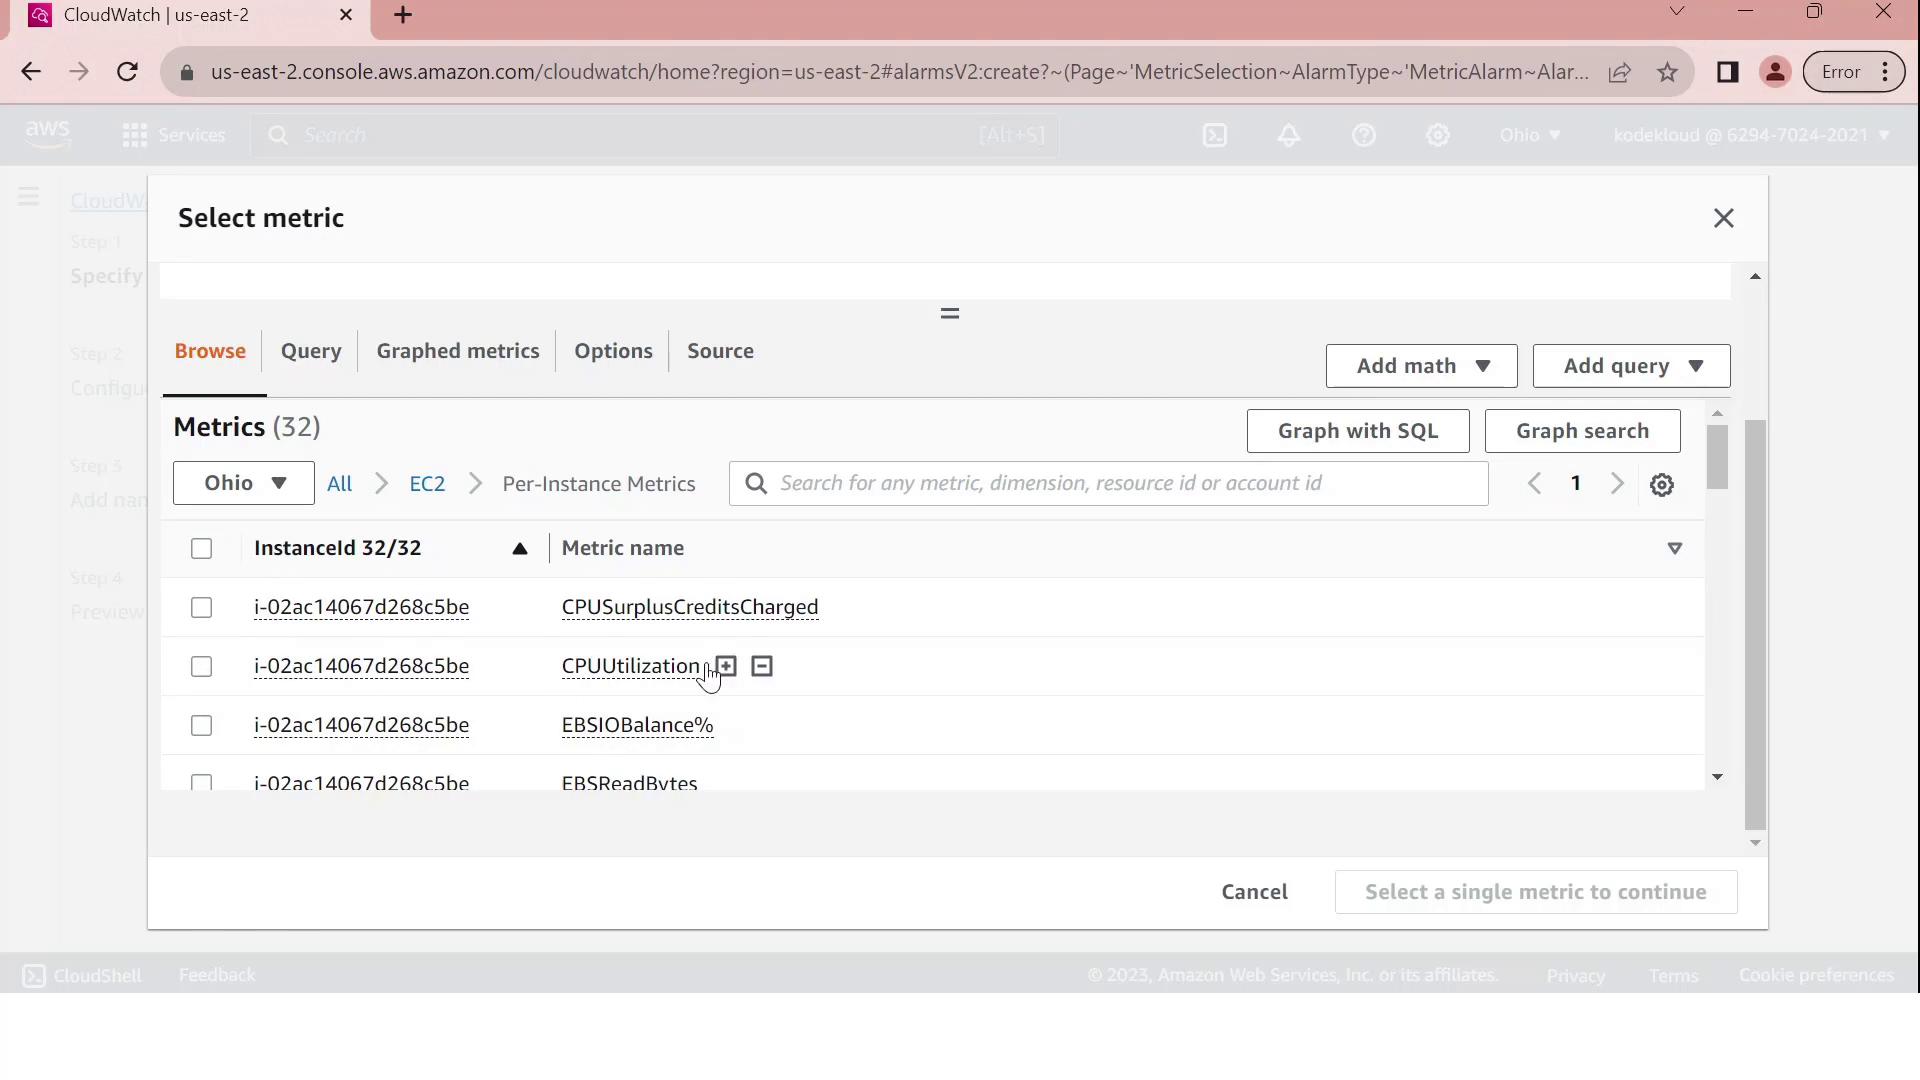
- On Select metric, pick EC2.
- Under Per-Instance Metrics, locate and select your instance’s CPUUtilization metric.
- Click Select metric.
3. Define the Alarm Threshold
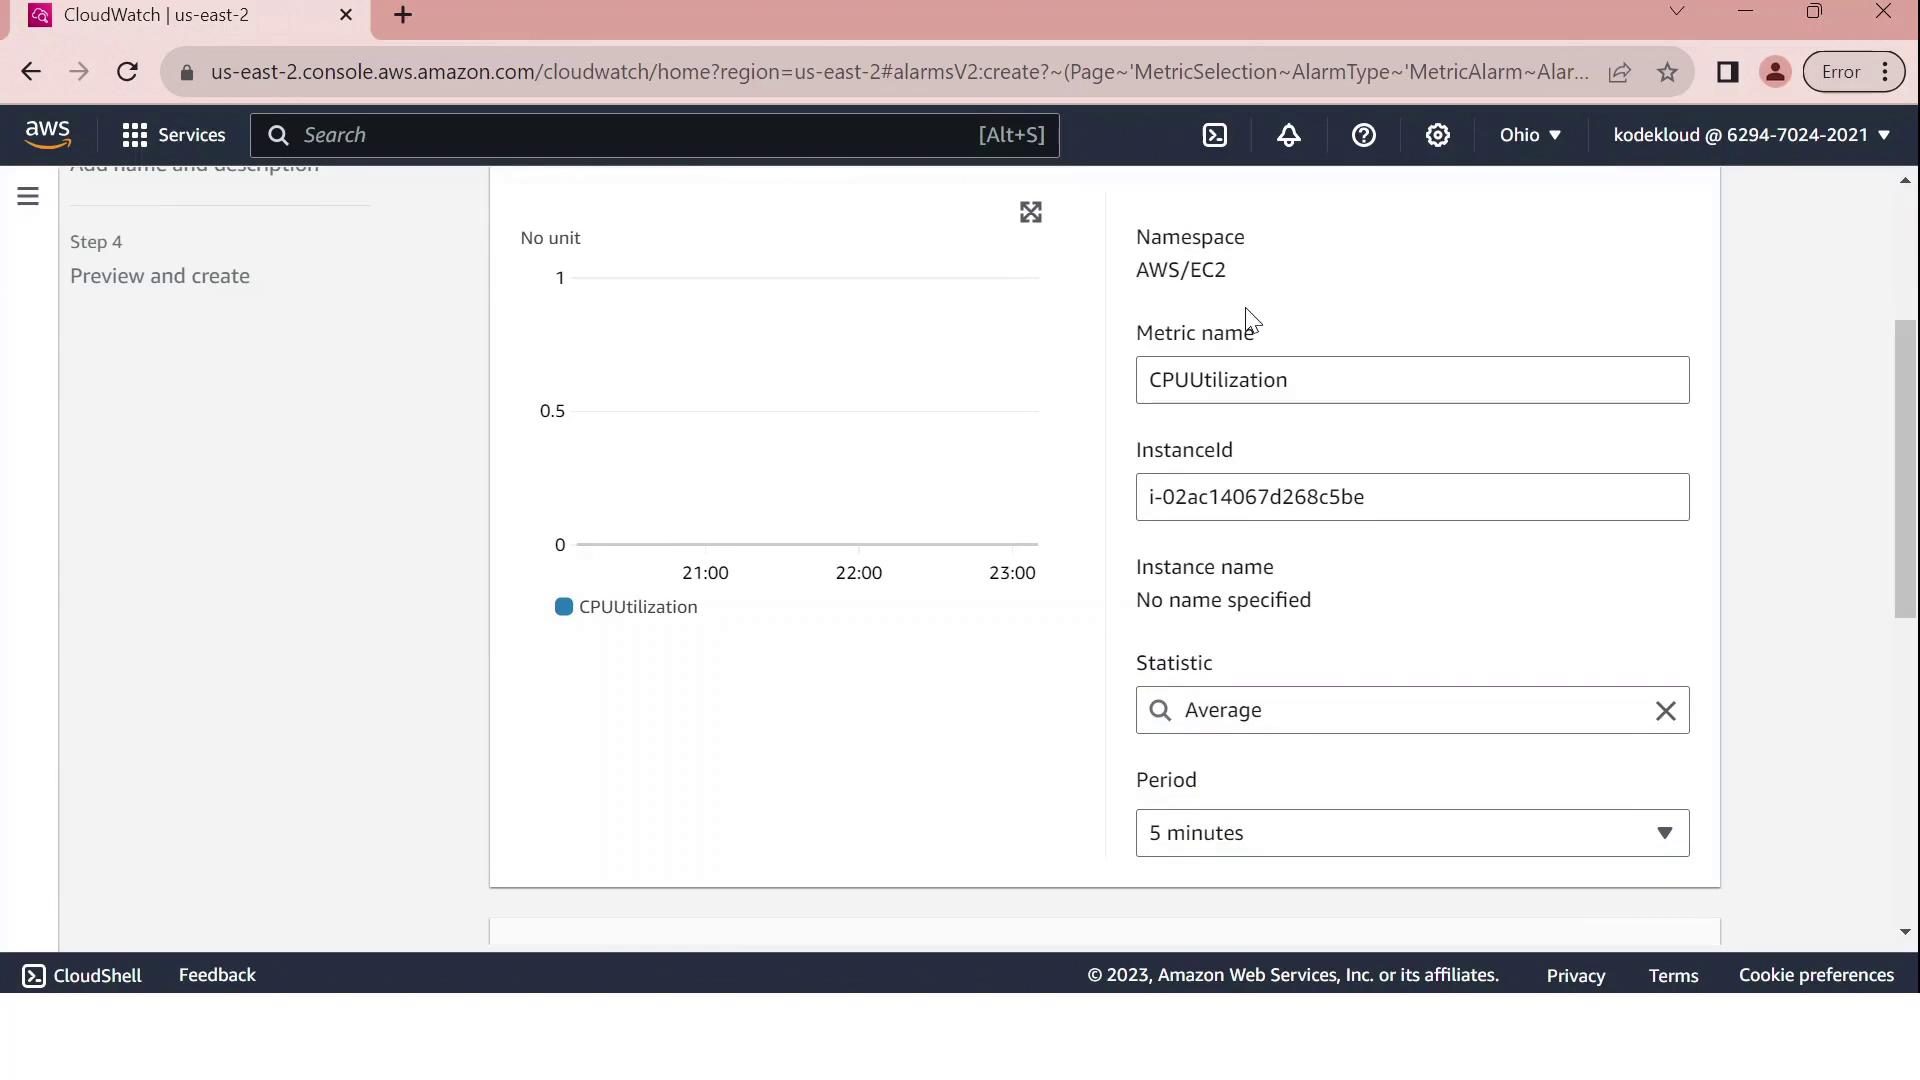
Configure the alarm conditions on the Configure metric page:| Setting | Value |
|---|---|
| Statistic period | 5 minutes |
| Threshold type | Static |
| Condition | GreaterThanThreshold |
| Threshold value | 70 |
Custom metrics and long-term storage can incur additional charges. Review CloudWatch pricing before enabling high-frequency monitoring.
4. Configure Notifications via SNS
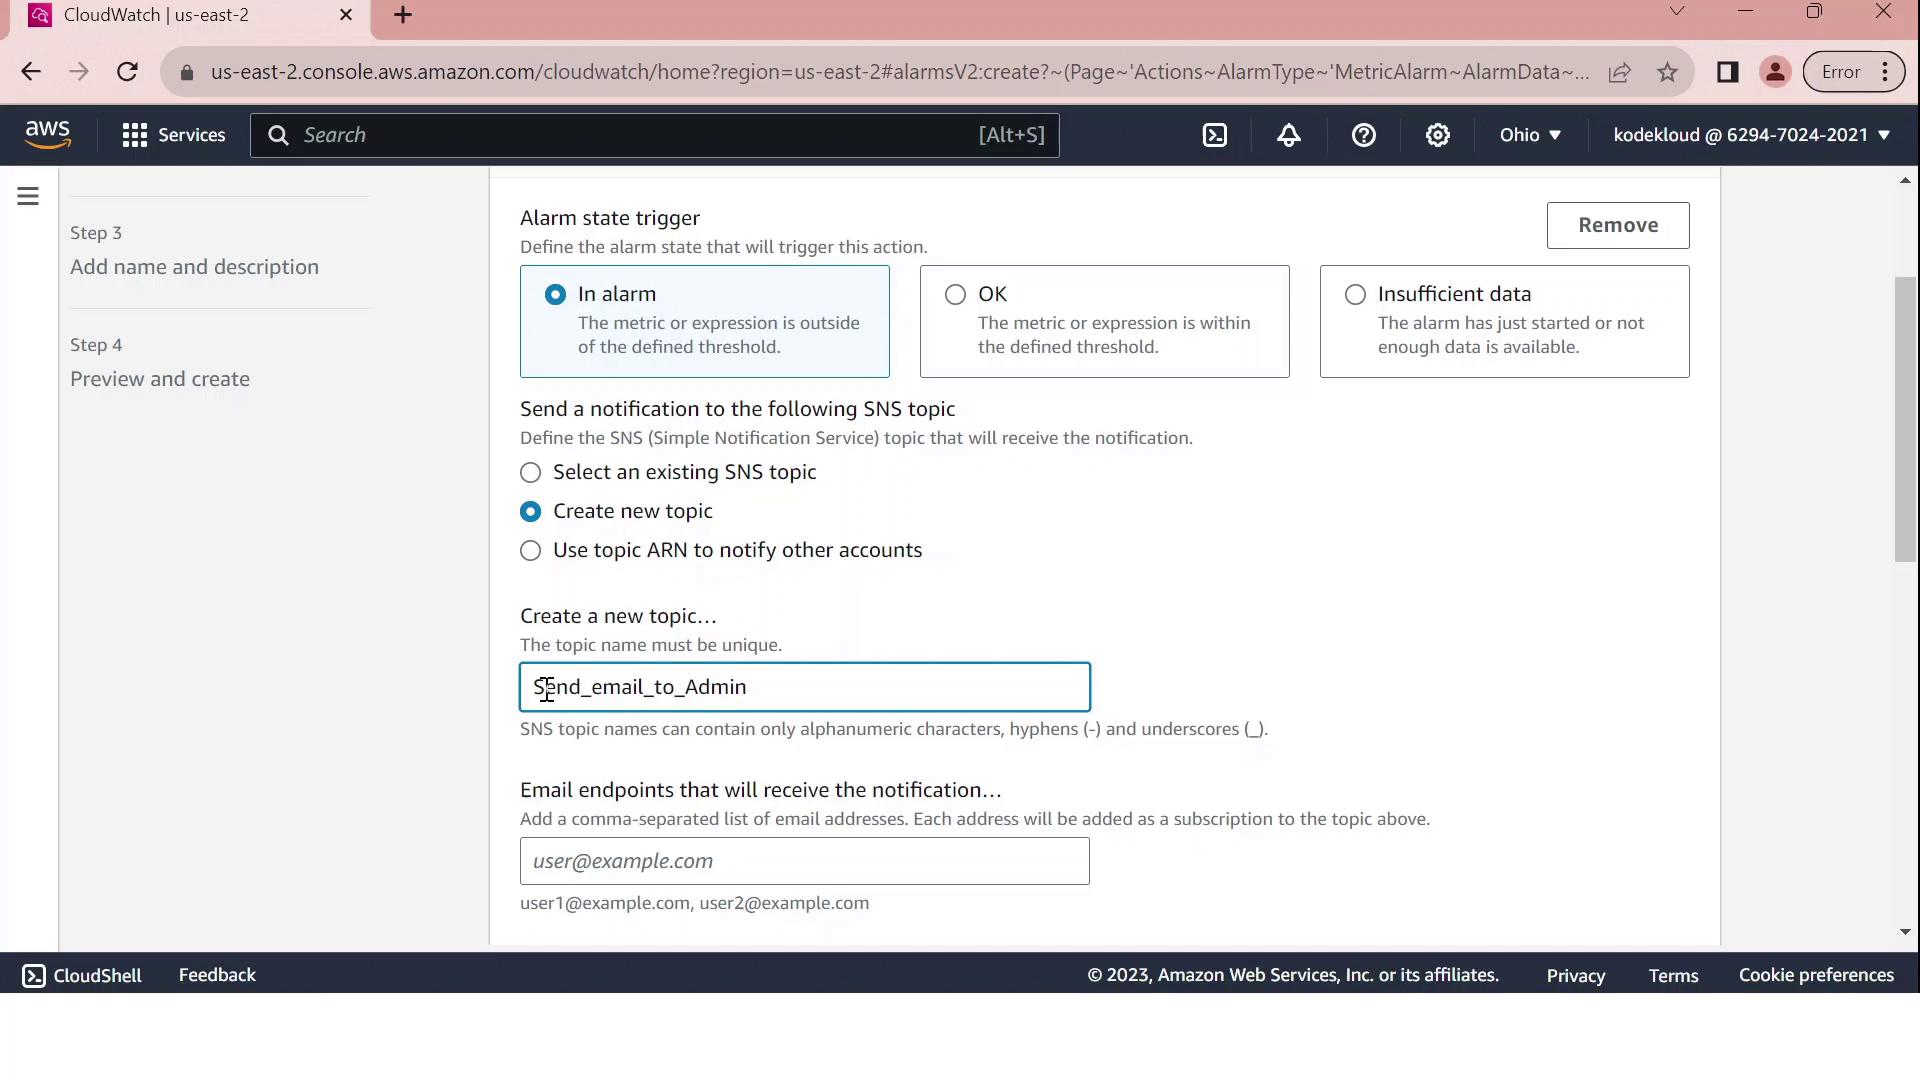
Under Notification, choose Create new topic and enter:- Topic name: Send_email_to_Admin
- Endpoint: admin@test.com
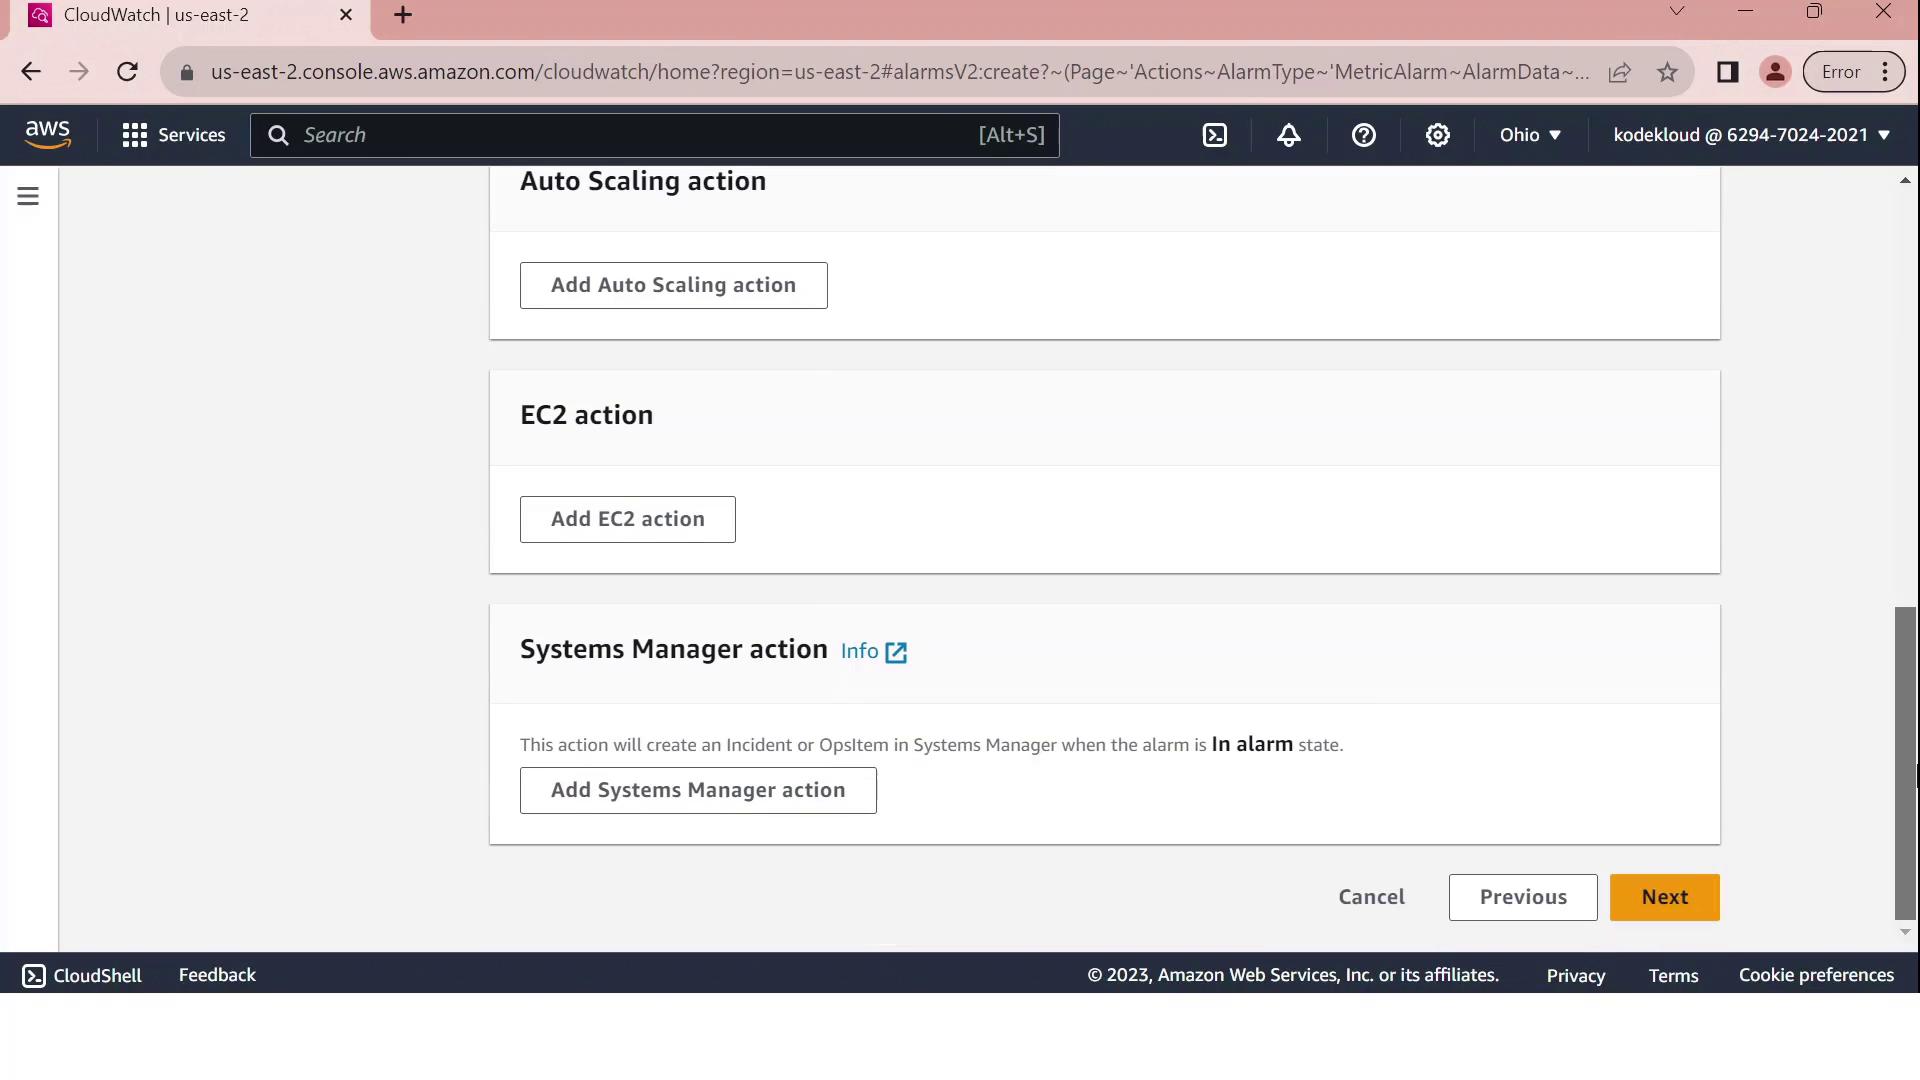
5. Name, Review, and Create
- Provide a name such as
CPUUtilizationAbove70and an optional description. - Review all settings:
- Metric: CPUUtilization for your EC2 instance
- Period and statistic
- Threshold: GreaterThan 70
- Notification: SNS email to admin@test.com
- Click Create alarm.
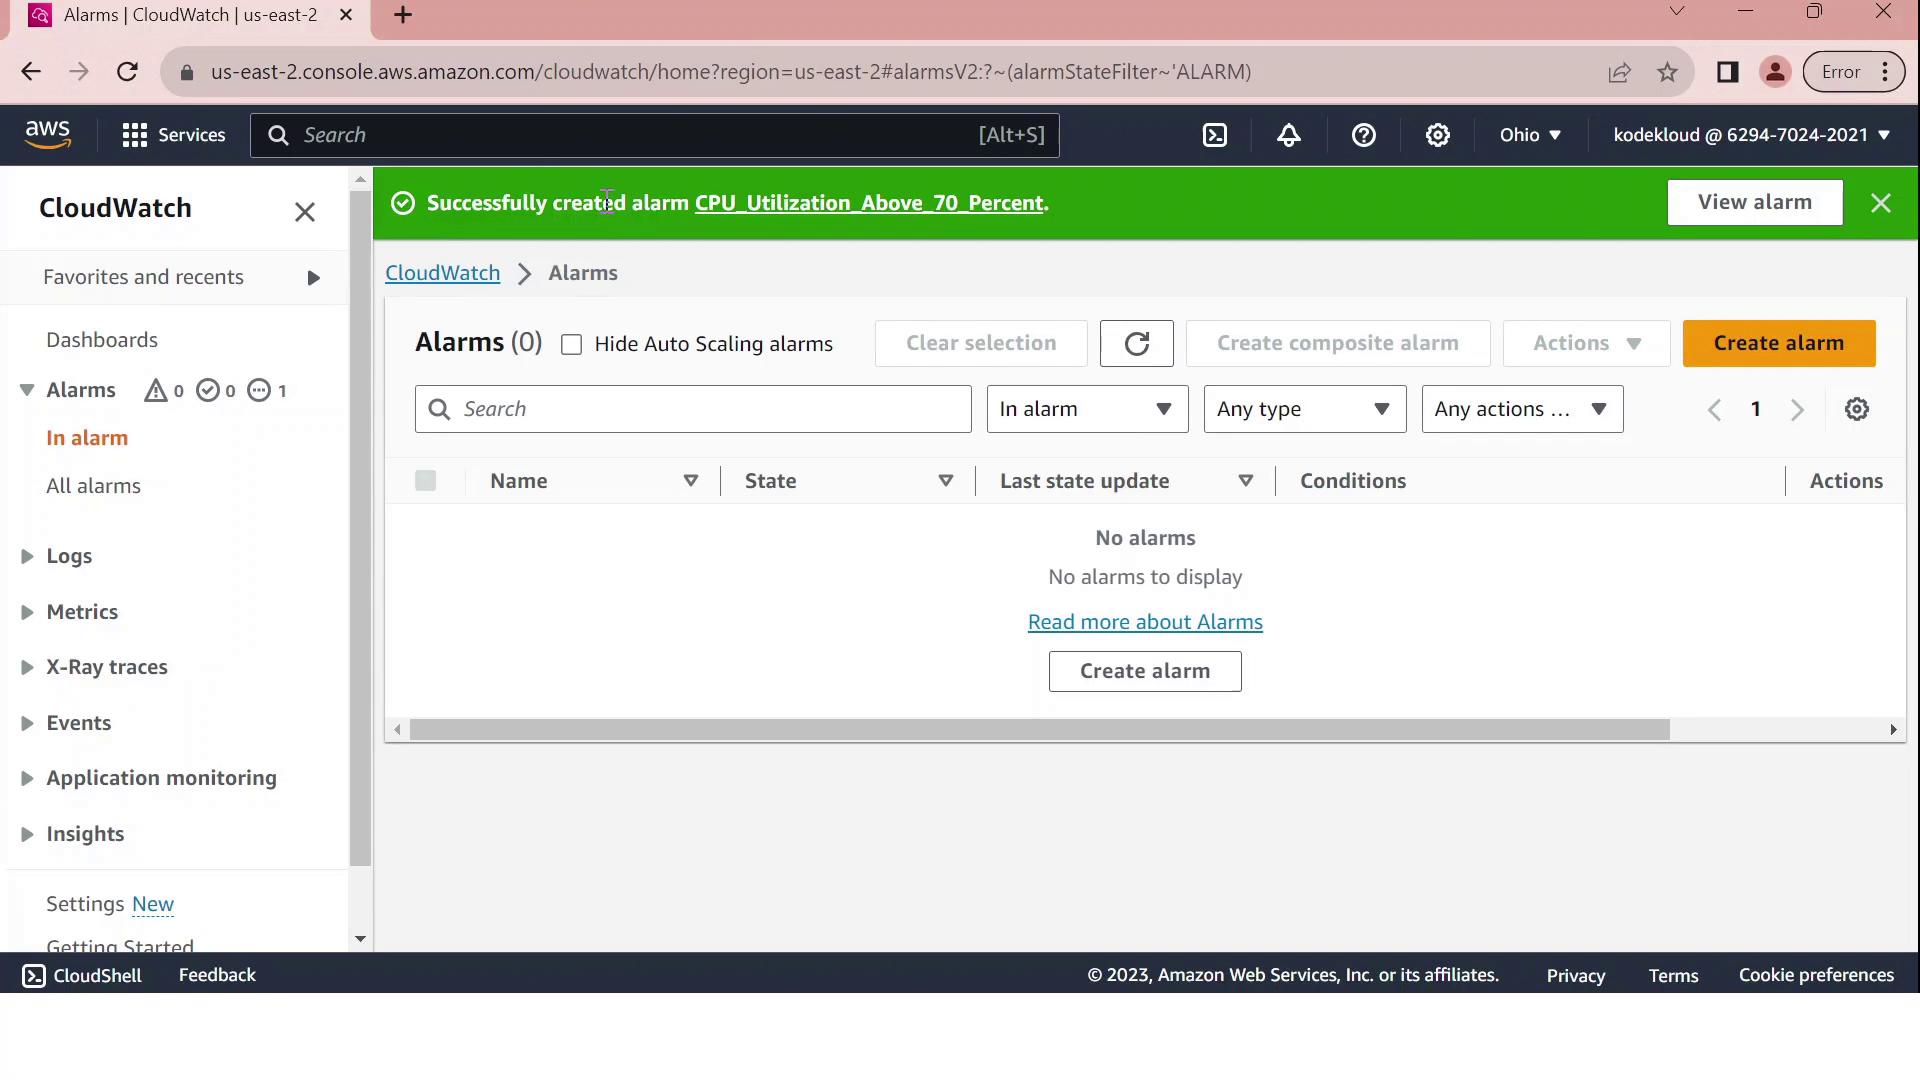
Your CloudWatch alarm is now active. When the average CPU utilization exceeds 70% over a five-minute span, an email is sent to the administrator. Monitor and adjust thresholds as needed to align with your application’s performance requirements.