What Are Custom Metrics?
Custom metrics are in-cluster, application-specific data points—distinct from CPU/memory (native) and external metrics. They help:- Maintain optimal performance under variable workloads
- Scale based on business-critical or user-centric KPIs
Workflow Components
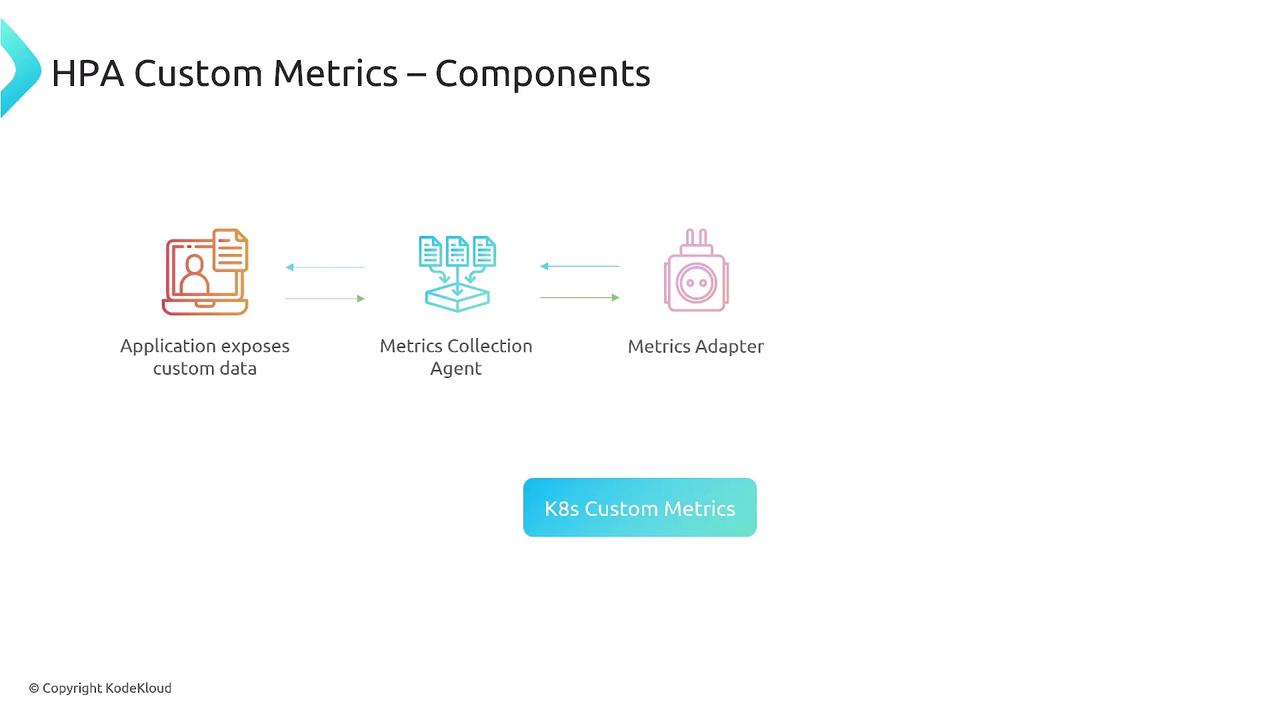
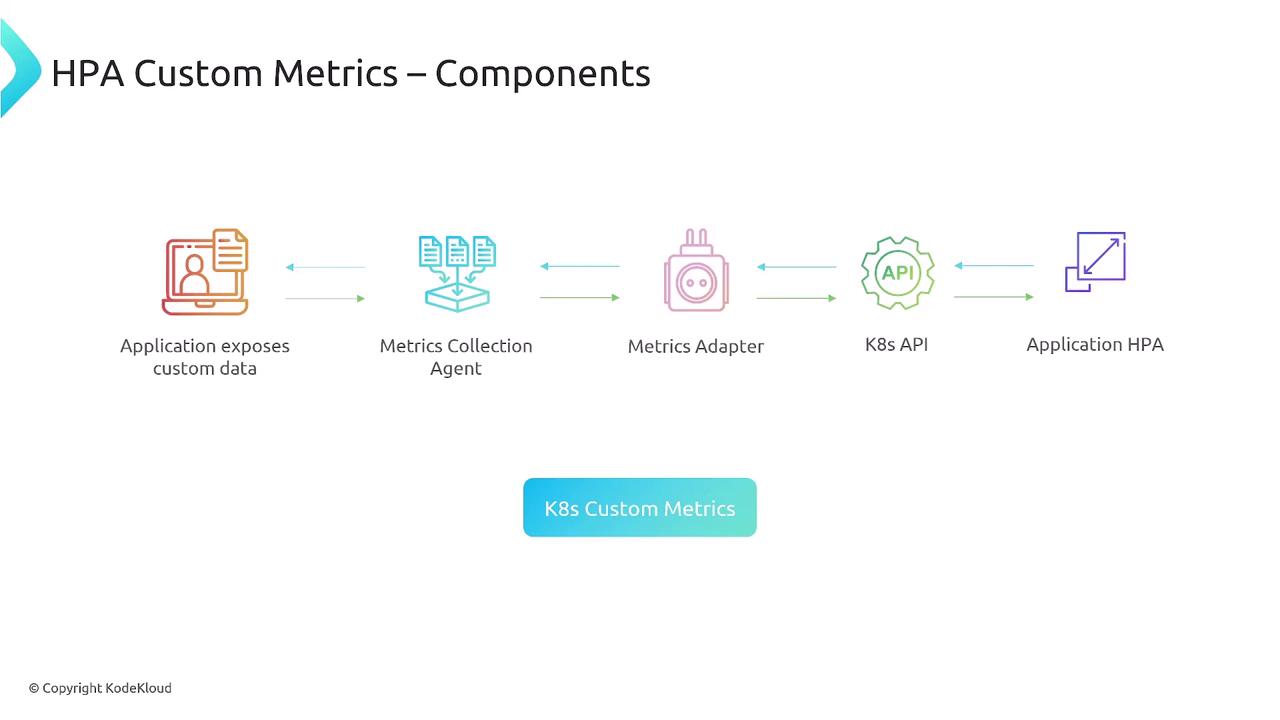
At a high level, custom metrics integration with HPA involves the following flow:| Component | Role | Example |
|---|---|---|
| Application | Exposes metrics via a monitoring library | Micrometer, client_golang |
| Metrics Collection Agent | Scrapes and stores metrics | Prometheus exporter |
| Metrics Adapter | Translates stored metrics to the Kubernetes Custom Metrics API | prometheus-adapter |
| Kubernetes API Server | Serves custom metrics to consumers | N/A |
| HPA Controller | Queries metrics and adjusts ReplicaSets | HorizontalPodAutoscaler |
Deploying Custom Metrics Support
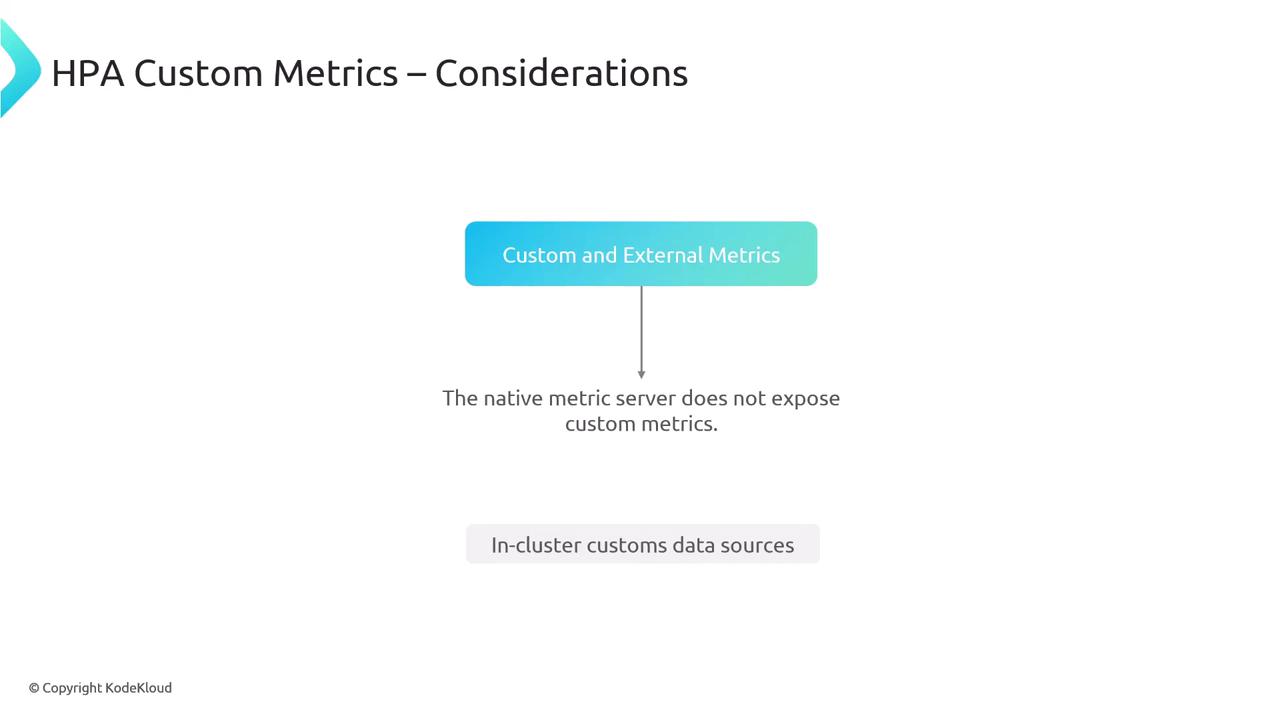
The default Kubernetes metrics-server only exposes CPU and memory. You must install a monitoring backend and metrics adapter to enable custom metrics.
- Deploy Prometheus (or another monitoring system) with exporters in your cluster.
- Install
prometheus-adapterand configurevalues.yamlto map Prometheus metrics to the Custom Metrics API. - Ensure the adapter exposes metrics under the correct API group (e.g.,
custom.metrics.k8s.io).
Sample HPA Definition
Below is a simplified example of an HPA using a custom Pods metric (requests_per_second):
Scrape interval and query timeouts can impact HPA responsiveness. Adjust your adapter’s
prometheus.yaml mapping and scrape configs accordingly.Key Considerations
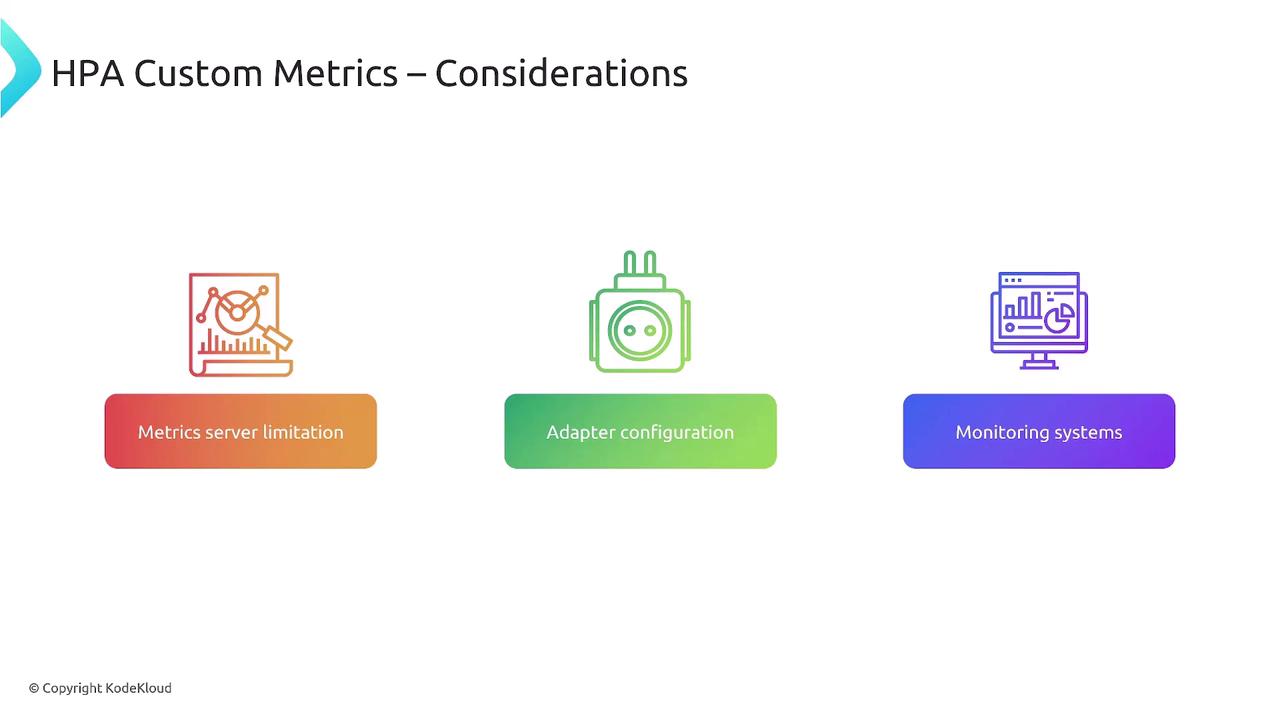
- Native
metrics-serverdoesn’t serve custom metrics - You need an in-cluster data source (e.g., Prometheus)
- The adapter bridges your monitoring backend to Kubernetes