

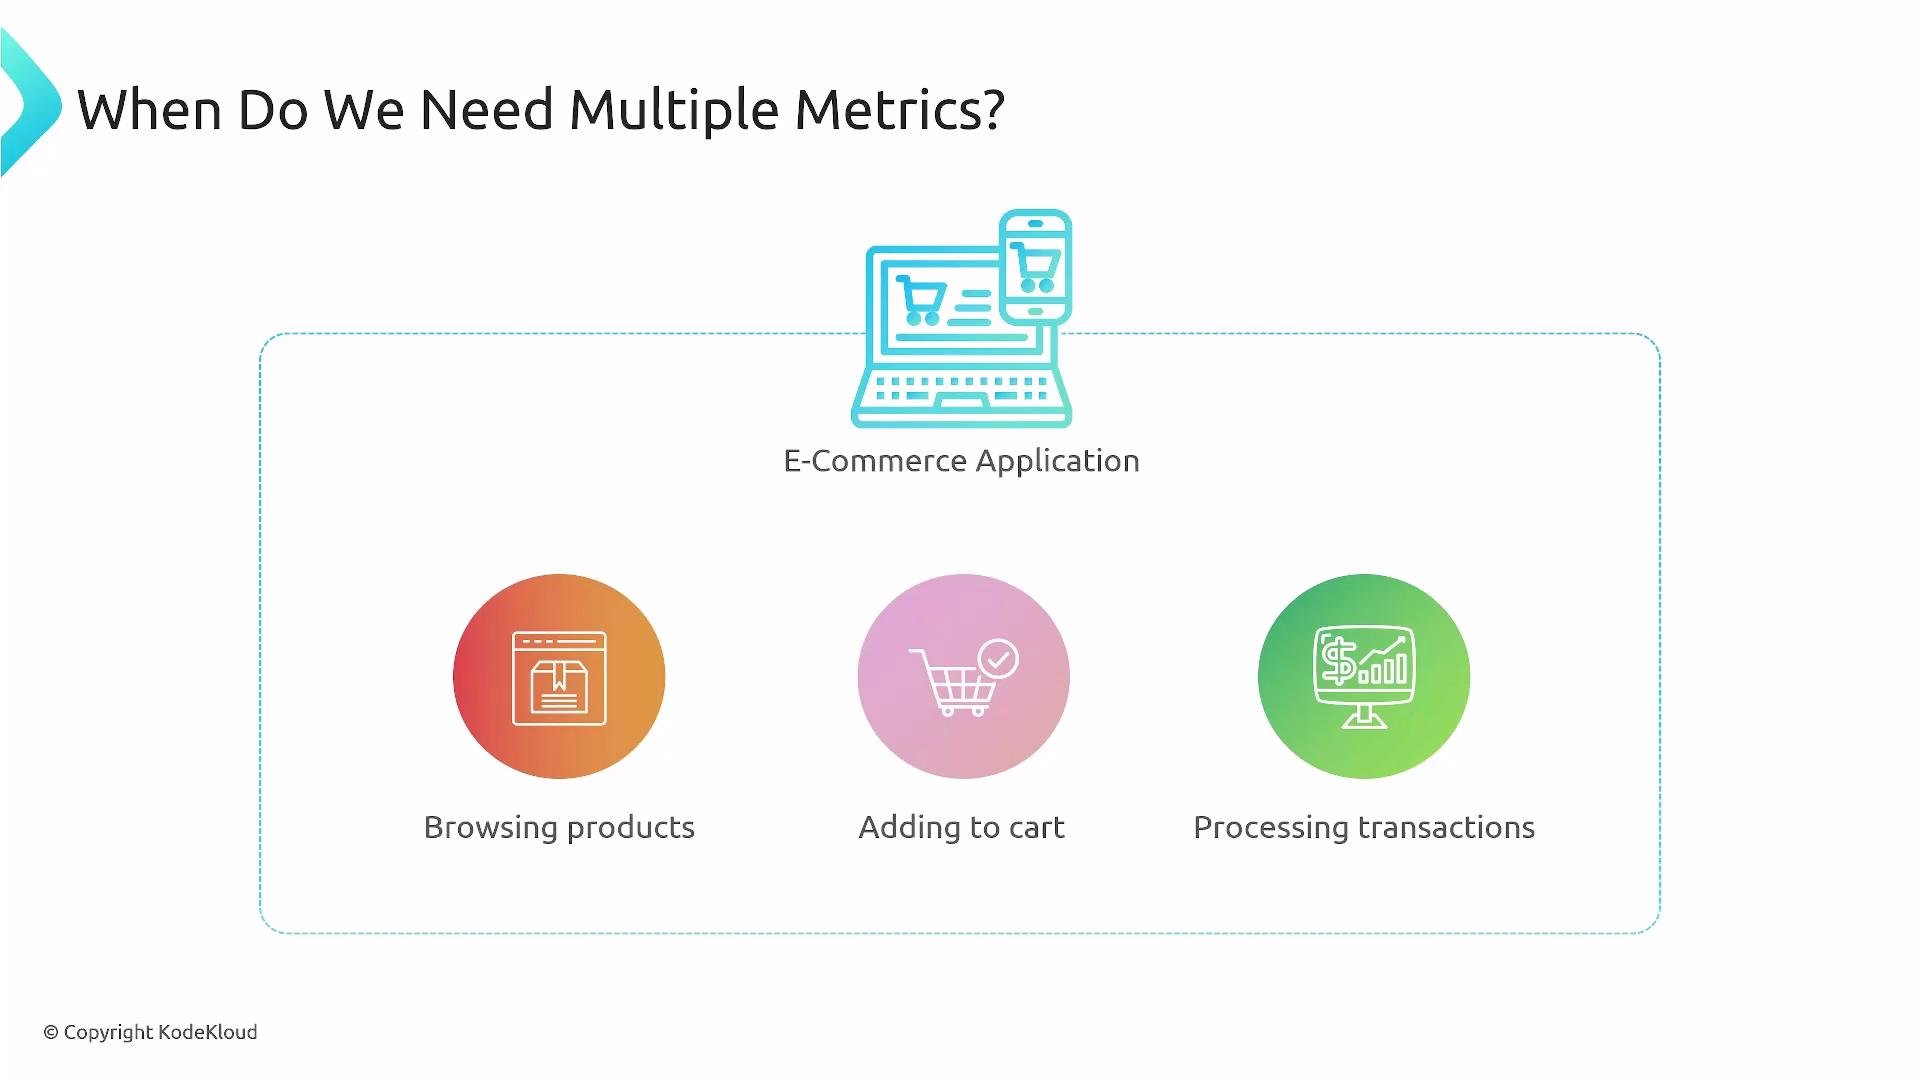
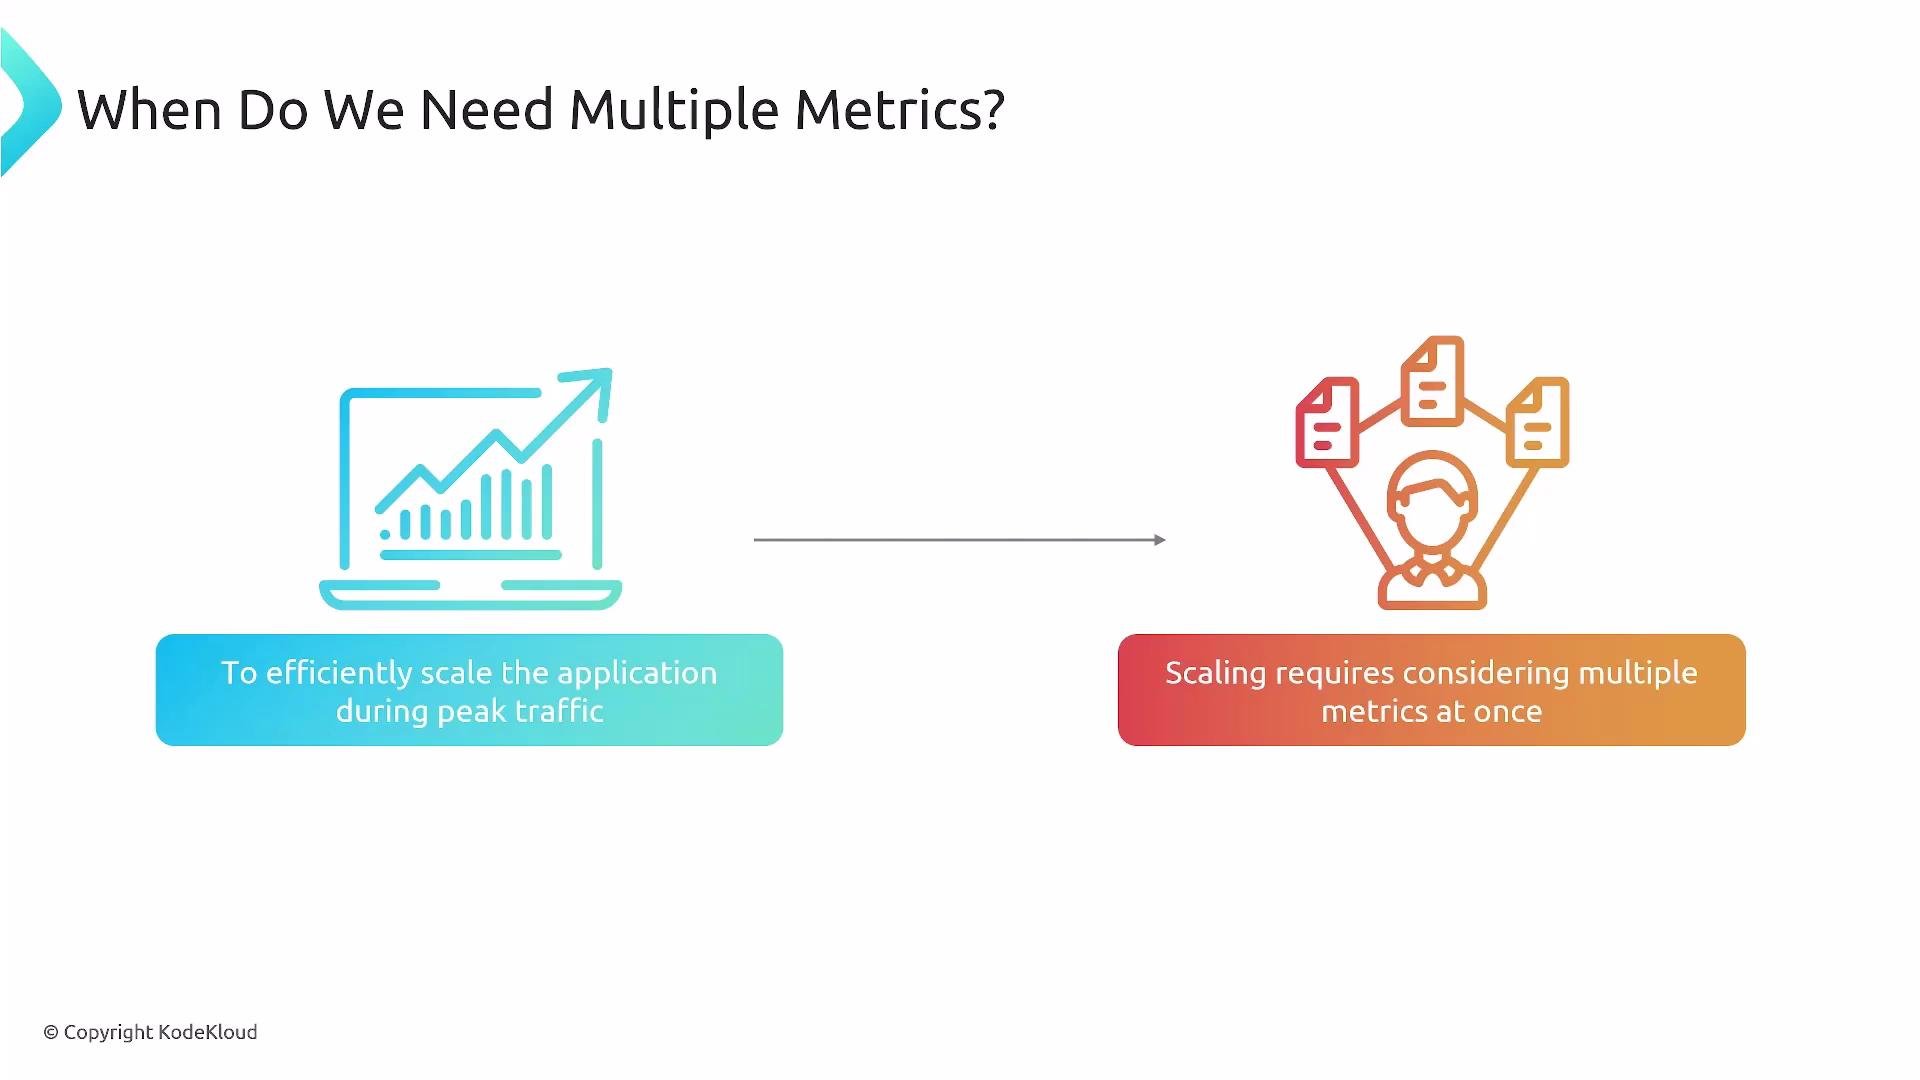
- Cluster resource metrics: Ensure a working cluster metrics pipeline (metrics-server) to provide resource metrics like CPU and memory.
- Application instrumentation: Expose custom application metrics (e.g., active HTTP requests, requests per second, queue length) via Prometheus or another collector.
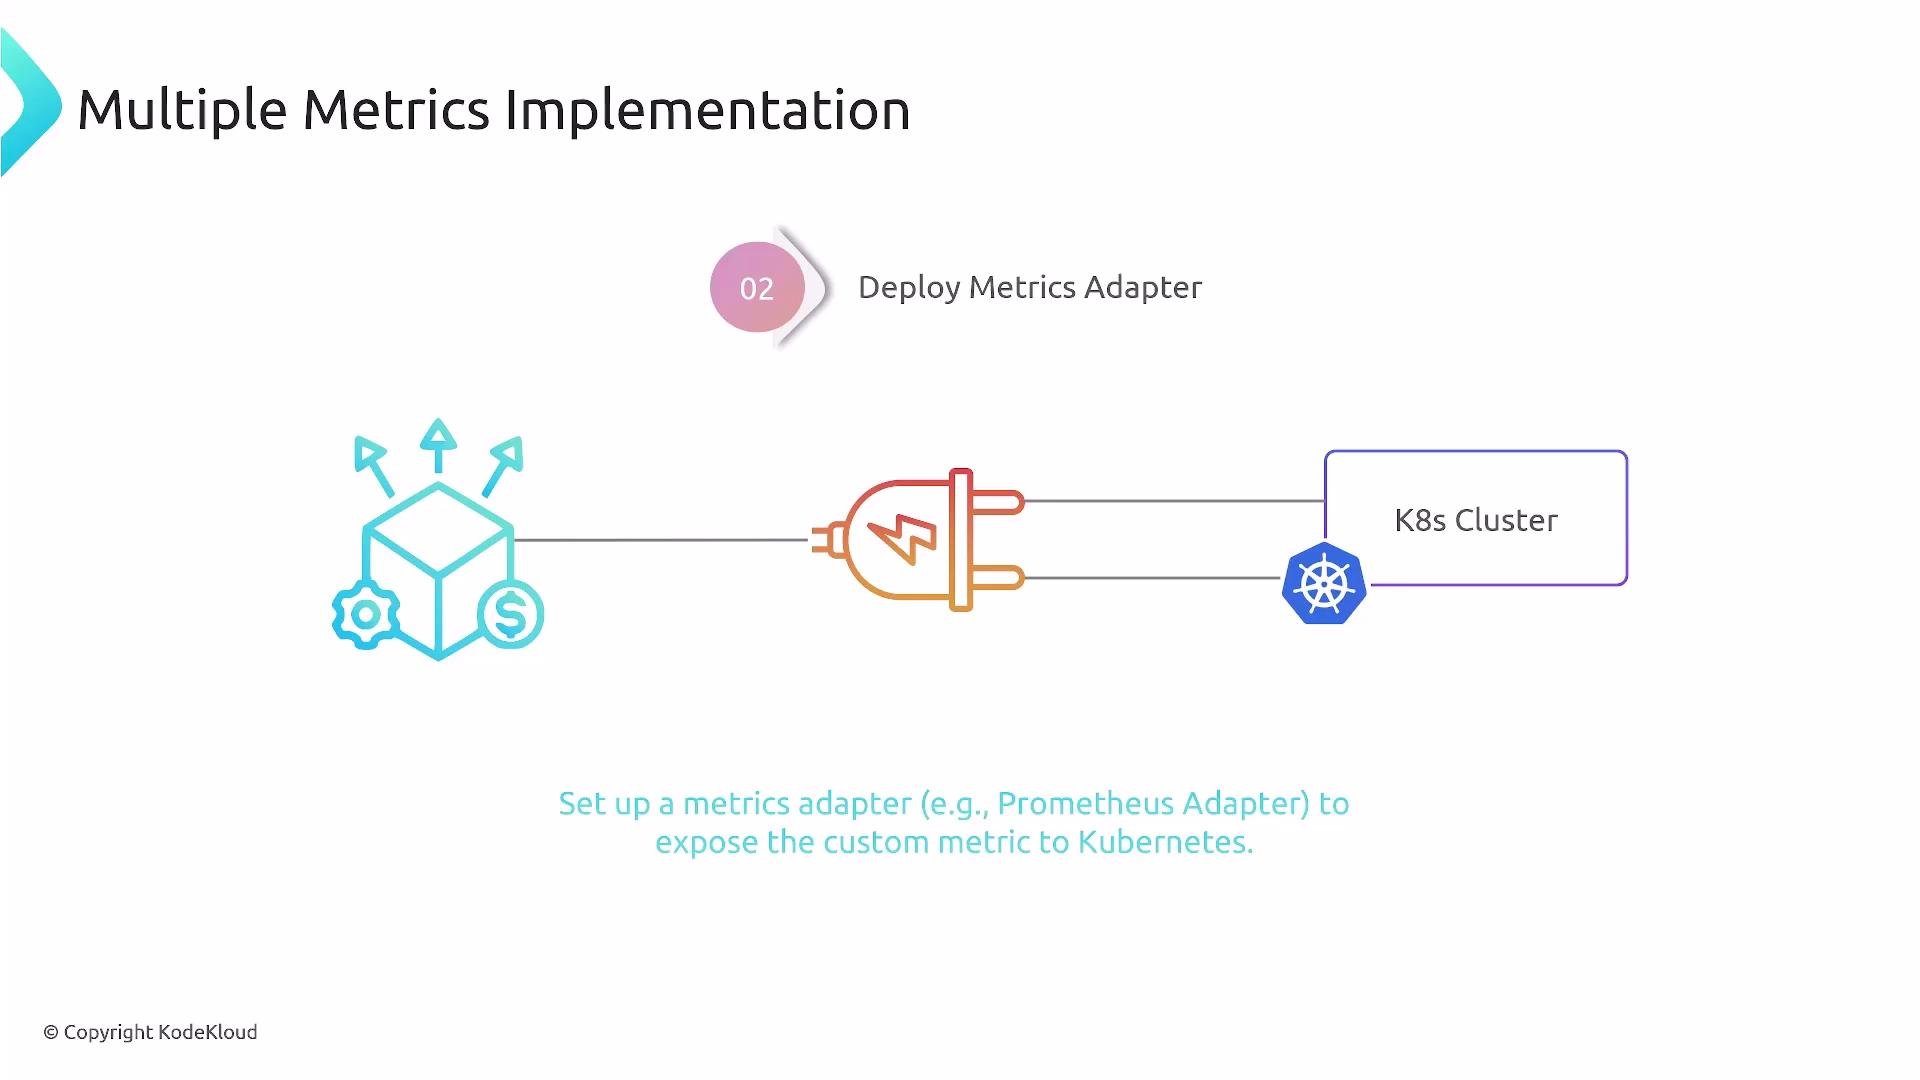
- Metrics adapter: Deploy an adapter (for example, Prometheus Adapter) to make custom metrics available through the Kubernetes metrics API so HPA can consume them.
- HPA reads all configured metrics (resource and external/custom).
- For each metric, HPA computes the desired replica count required to meet that metric’s target.
- The HPA then scales to the highest of those desired replica counts so that all targets are satisfied.
backend-service by CPU utilization and a custom per-pod metric active_http_requests:
averageUtilization: 70targets ~70% CPU utilization across the pods.- The
Podsmetric type withAverageValuetargets an average of100active_http_requestsper pod. The adapter must exposeactive_http_requestsas a pods-scoped metric. - HPA evaluates both metrics and scales to the highest computed replica count.
When NOT to use multiple metrics
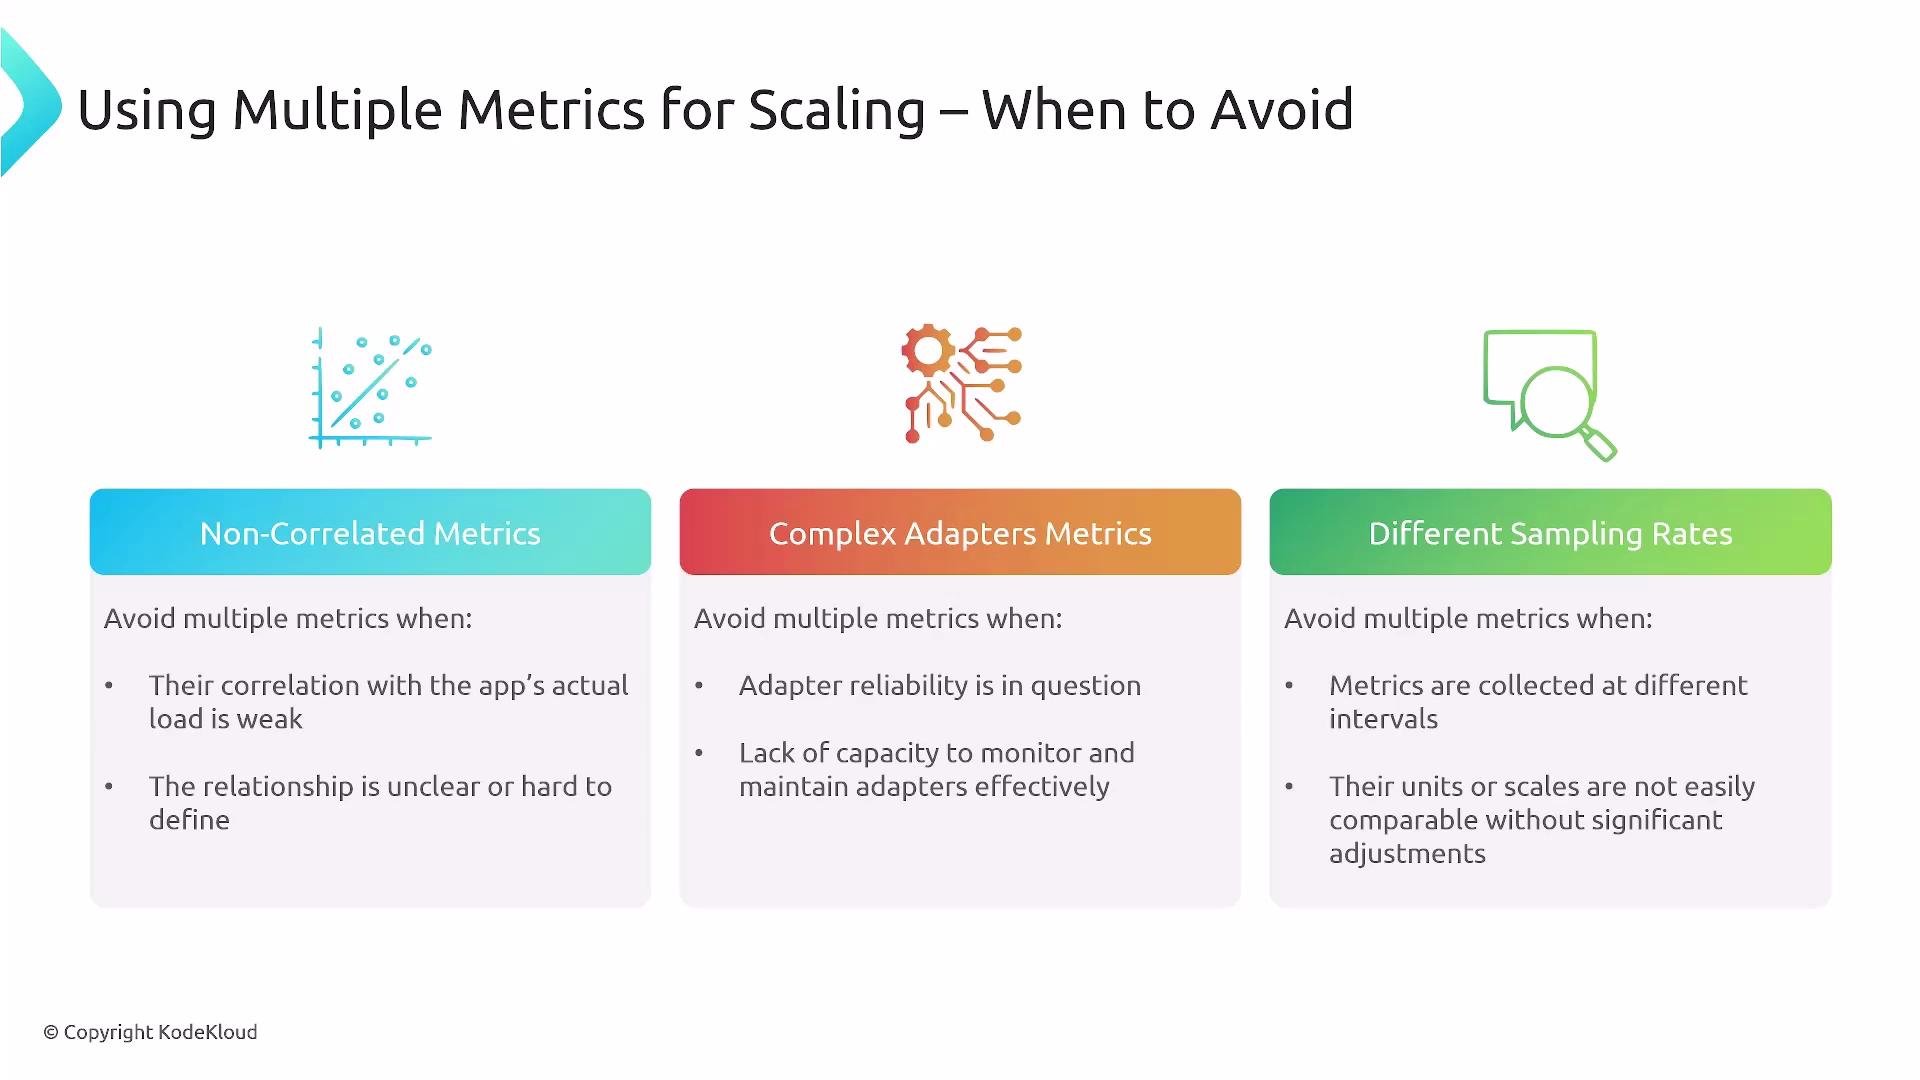
- Metrics are not correlated to actual service load (e.g., CPU stuck at high value with no request changes).
- The metrics adapter or metric source is unreliable or hard to maintain.
- Metrics have incompatible sampling intervals or units (one metric sampled every second vs another every 10 minutes).
- The added complexity of reconciling multiple metrics outweighs autoscaling benefits.
Ensure your cluster has a working metrics pipeline (
metrics-server) and a compatible adapter (for example, the Prometheus Adapter) before relying on custom metrics for HPA. Verify sampling intervals, metric names, and scope (pods vs. external) to avoid surprising behavior.- Start simple: use a single well-understood metric and validate behavior.
- Use per-pod metrics when the metric is tightly coupled to workload per replica (like concurrent requests).
- Ensure consistent scraping intervals and retention in your monitoring system.
- Test scaling behavior under realistic load patterns and validate that the highest computed replica count is the correct safe option.
- Kubernetes Autoscaling (HPA): https://learn.kodekloud.com/user/courses/kubernetes-autoscaling
- metrics-server: https://github.com/kubernetes-sigs/metrics-server
- Prometheus Adapter: https://github.com/prometheus-community/prometheus-adapter
- Prometheus monitoring course: https://learn.kodekloud.com/user/courses/youtube-labs-monitoring-kubernetes-with-prometheus