

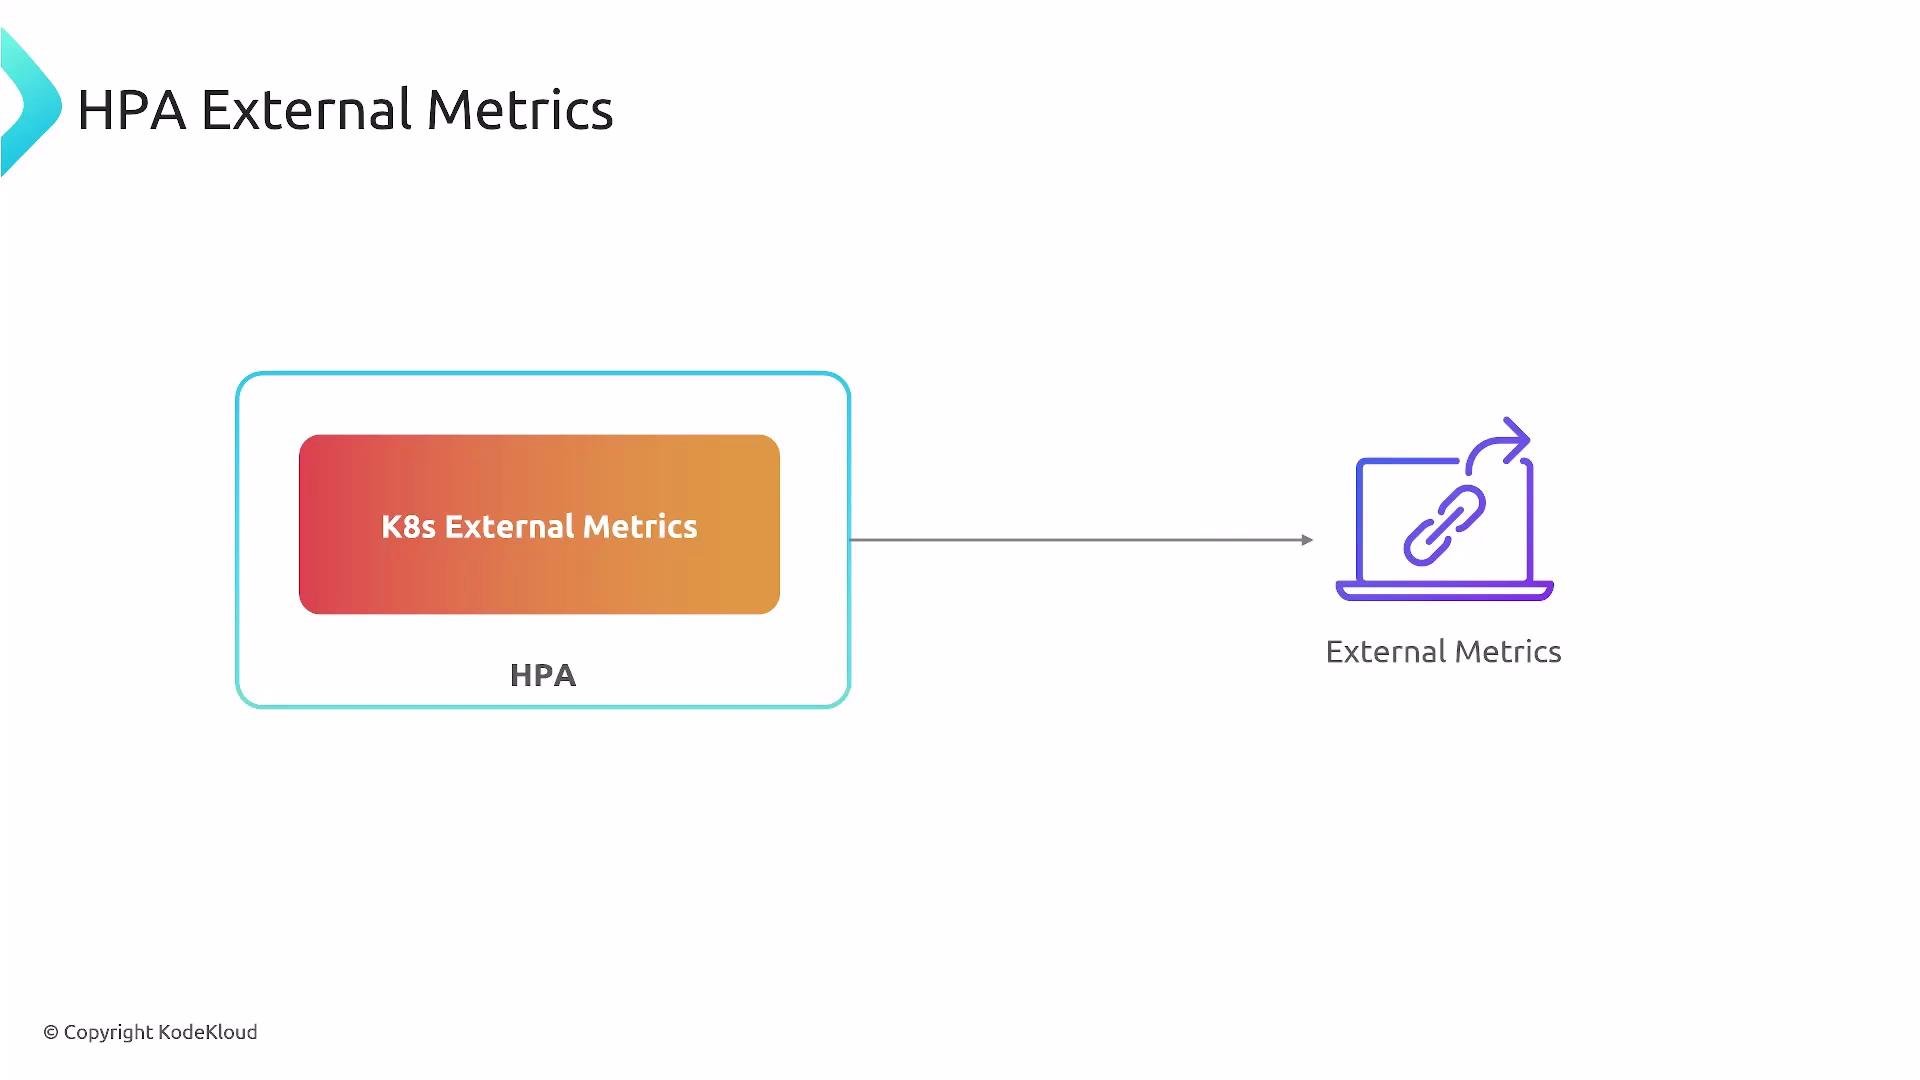
- Scale based on external systems such as cloud-managed queues, third-party APIs, or external load balancers.
- Make proactive scaling decisions from signals that don’t exist inside pod metrics (for example, queue backlog or external request rate).
- Integrate infrastructure- or business-level signals (billing events, backlog thresholds, SaaS metrics) into Kubernetes autoscaling.
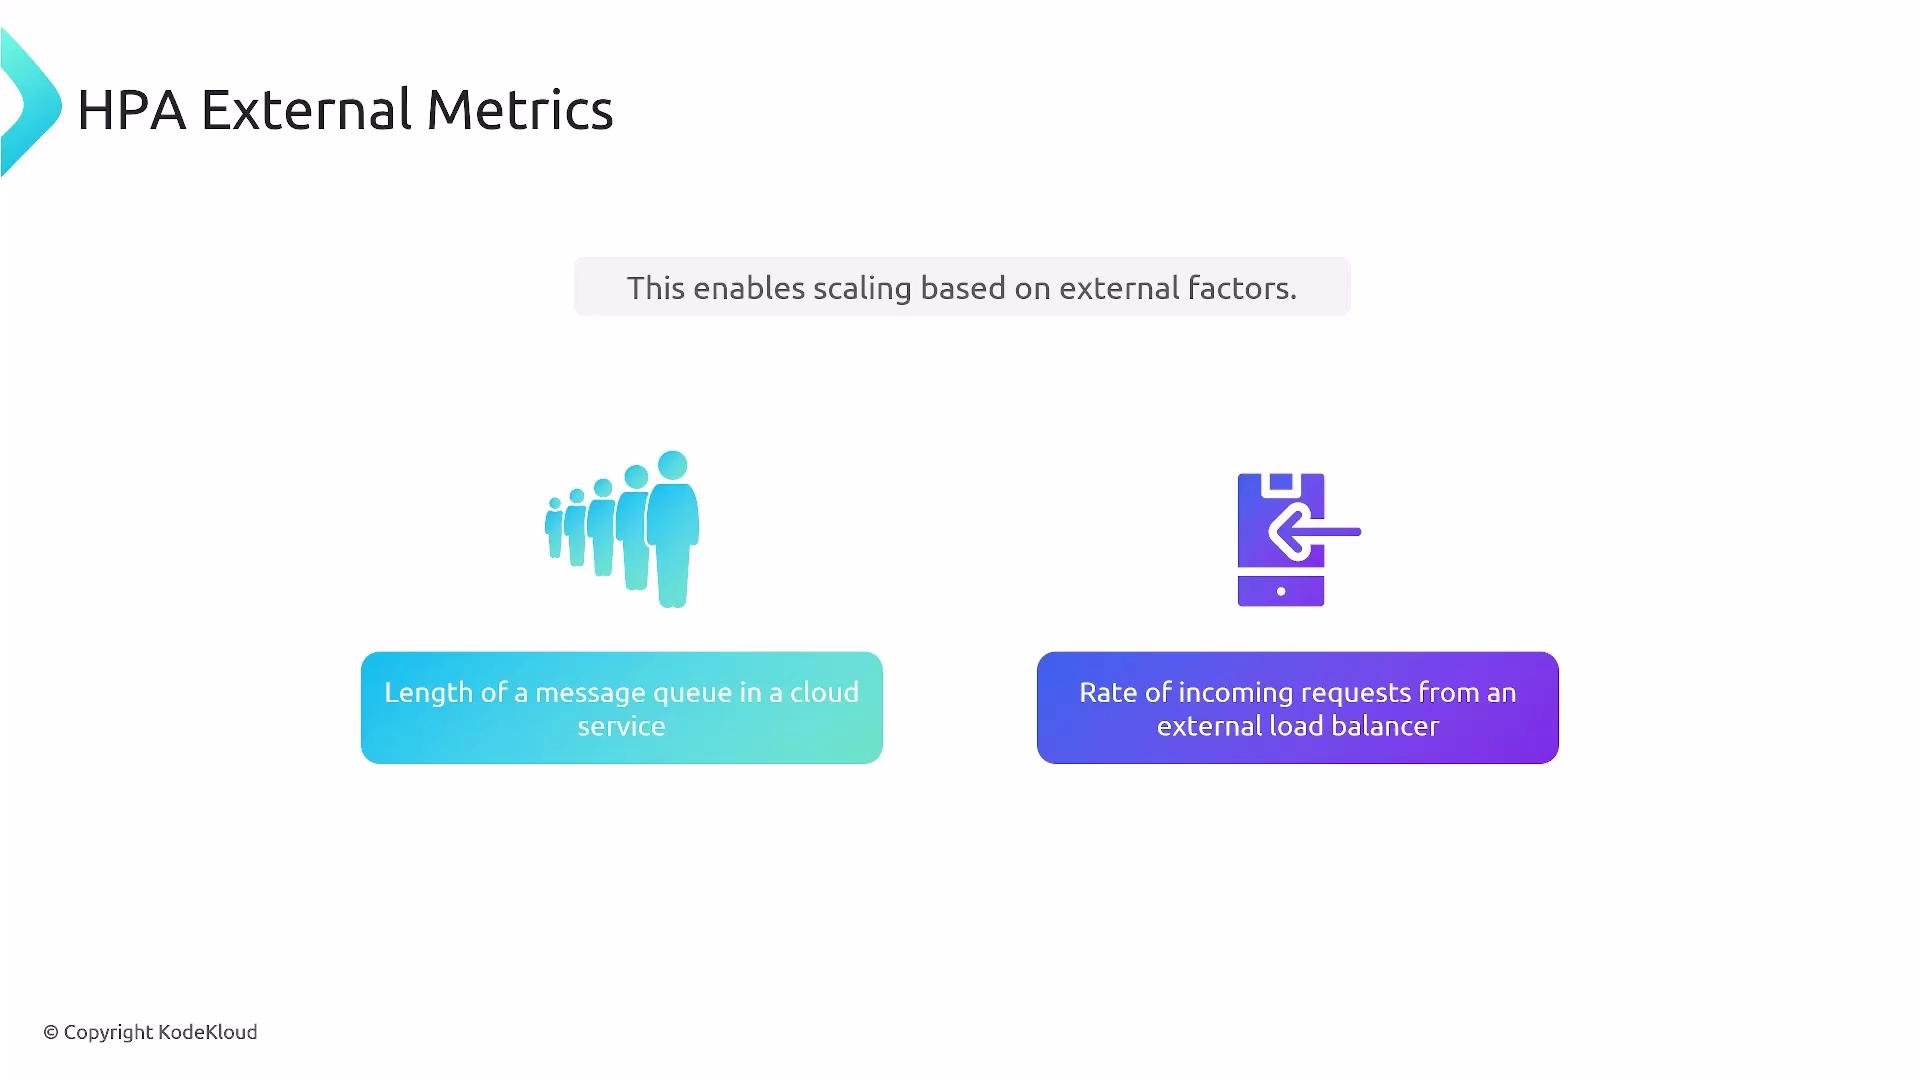
- A cloud-based message queue backlog drives additional consumers.
- An external load balancer’s observed request rate determines replica count.
- External metric source: the cloud provider, message queue, or third-party service exposing the metric.
- Collection/monitoring system: gathers metrics from the external source (examples: Prometheus, cloud monitoring like Cloud Monitoring / CloudWatch).
- Metrics adapter: translates collected metrics into the Kubernetes External Metrics API so the HPA can query them.
- HPA: requests metrics via the Kubernetes API and uses the returned values to scale workloads.
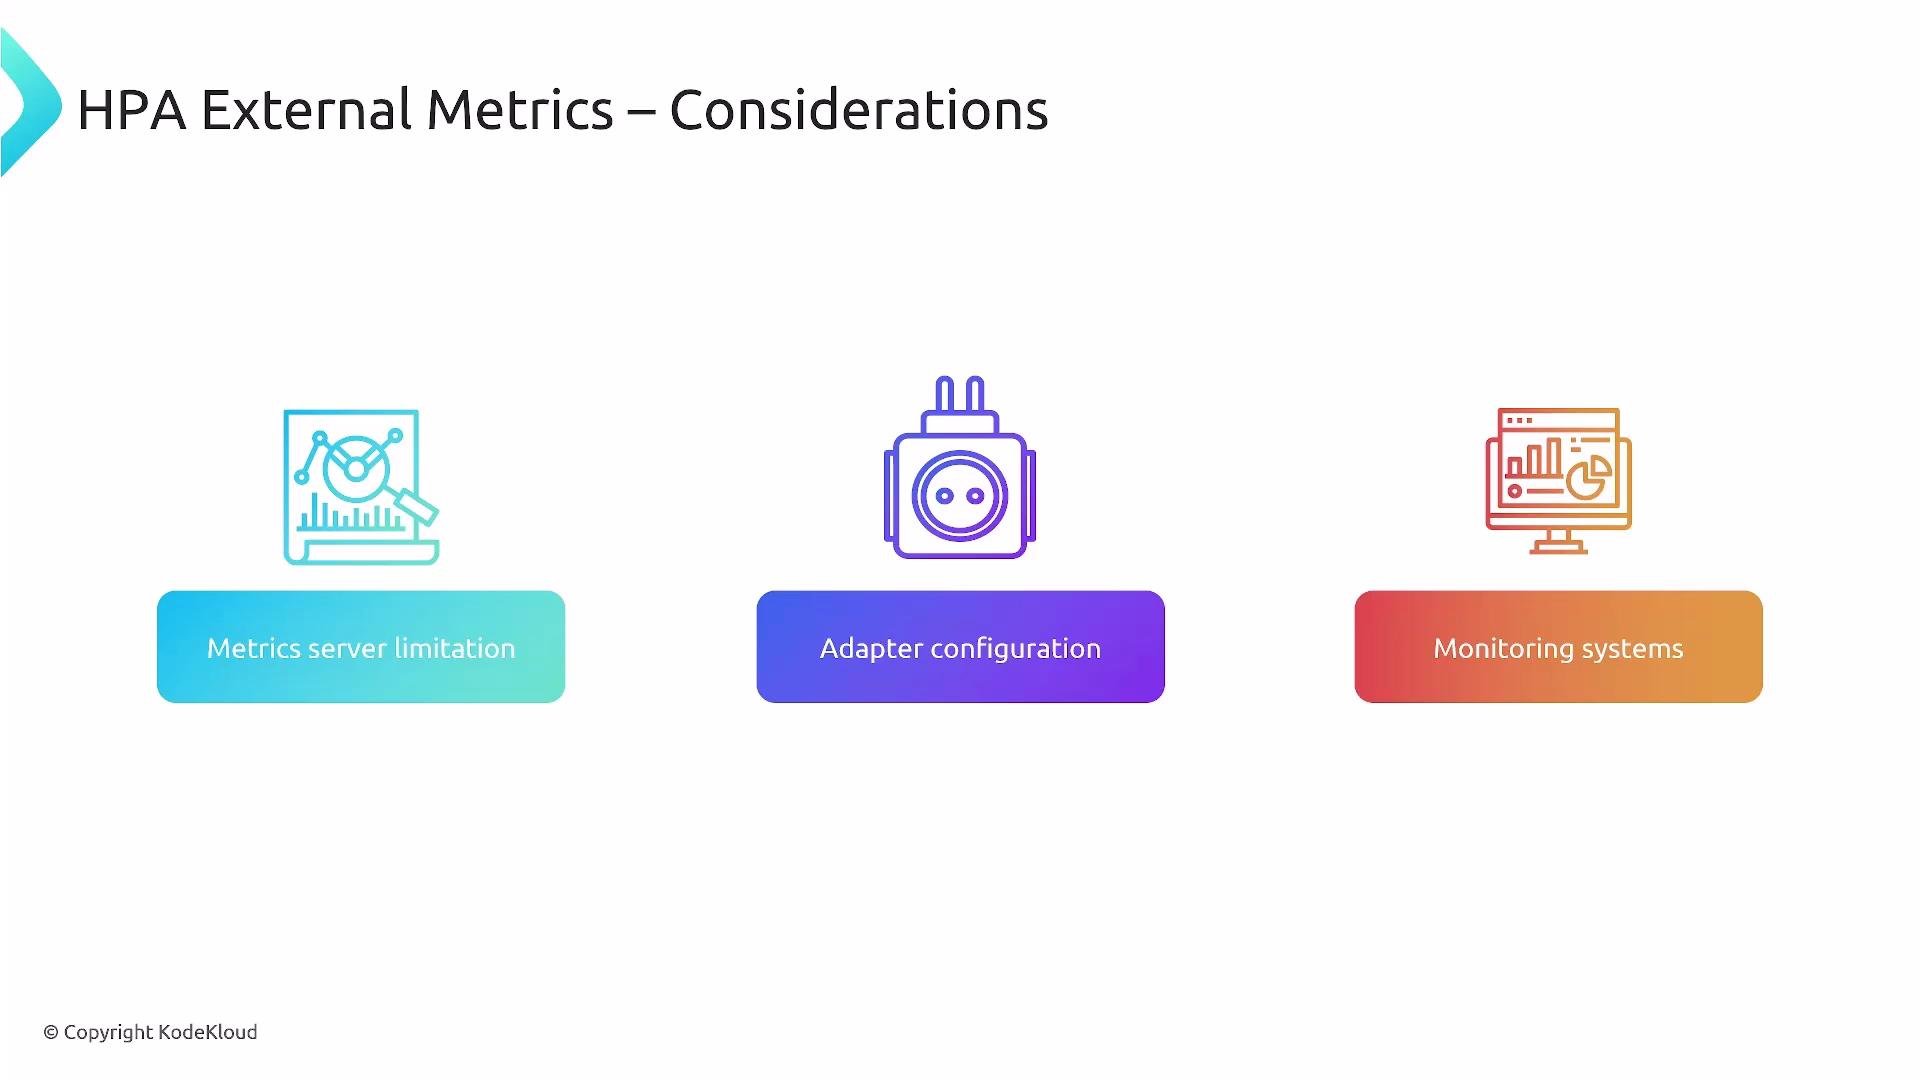
The default Kubernetes Metrics Server only serves resource metrics (CPU/memory) and does not expose external metrics. Deploy a metrics adapter that implements the External Metrics API (for example, the Prometheus Adapter or a cloud-specific adapter) to allow the HPA to consume external signals.
- You need a reliable collector/monitoring layer that can fetch external values (via scraping, API polling, or event ingestion).
- An in-cluster metrics adapter must be configured to expose metrics through the Kubernetes External Metrics API.
- The adapter must support querying metrics by name and labels so the HPA can target the correct time series.
- Validate auth, network connectivity, and metric naming between source → collector → adapter → HPA.
- Choose a monitoring backend that reliably collects your external signal (queue depth, request rate, third-party metric).
- Select an adapter compatible with your metric store (for Prometheus, use the Prometheus Adapter; for cloud metrics, use the cloud provider’s adapter).
- In the HPA spec, reference the external metric by name and supply label selectors if required to match the right series.
- Test the full pipeline (external source → collector → adapter → Kubernetes API → HPA) and validate both metric accuracy and timeliness.
- Confirm the collector is scraping/pulling the external metric and exposing it in the monitoring backend.
- Verify the adapter reports the metric through the Kubernetes External Metrics API:
kubectl get --raw "/apis/external.metrics.k8s.io/v1beta1"(adapter dependent)
- Check HPA events and status:
kubectl describe hpa example-external-hpa
- Monitor adapter and collector logs/alerts to detect failures or missing series.
If the adapter or collector is misconfigured or unavailable, the HPA will not receive external metrics and scaling may not occur. Continuously monitor adapter health and metric endpoints to avoid gaps in autoscaling.
- Kubernetes Horizontal Pod Autoscaler docs: External Metrics
- Prometheus: https://prometheus.io/
- Prometheus Adapter (example): https://github.com/kubernetes-sigs/prometheus-adapter