

- Automatically adjusts the number of pod replicas for a target workload (Deployment, StatefulSet, ReplicaSet, etc.).
- Can use resource metrics (CPU/memory), custom in-cluster metrics, or external metrics from third-party monitoring/APM systems.
- Requires metric adapters or a Metrics Server to expose non-native metric sources through the Kubernetes Metrics APIs.
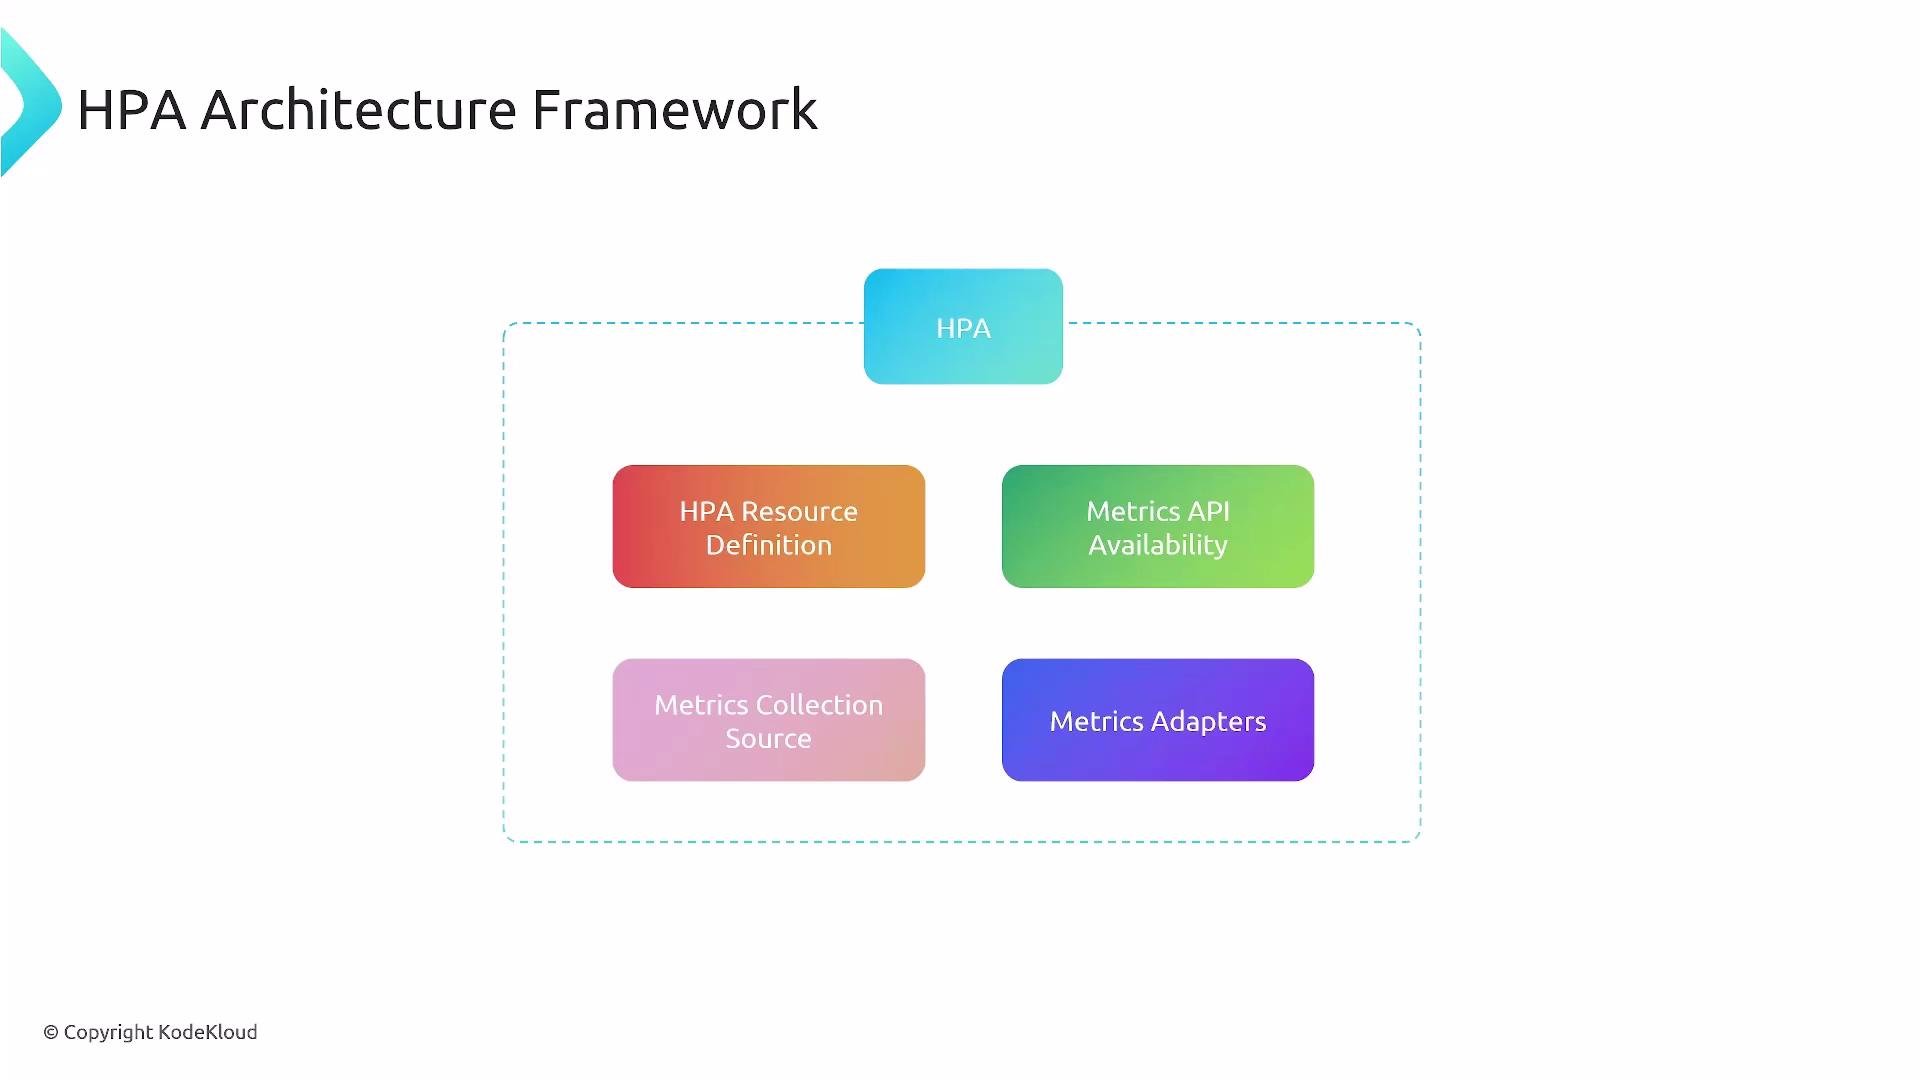
- HPA resource definition: YAML manifest that designates the target workload, minimum/maximum replicas, and the metric targets.
- Metrics API availability & collection sources: the Kubernetes metric API endpoints that the HPA controller queries.
- Metrics adapters: bridge external or custom metric sources into Kubernetes via
custom.metrics.k8s.ioorexternal.metrics.k8s.io.
- This HPA keeps average CPU utilization across pods at 50%, with a minimum of 2 replicas and a maximum of 10.
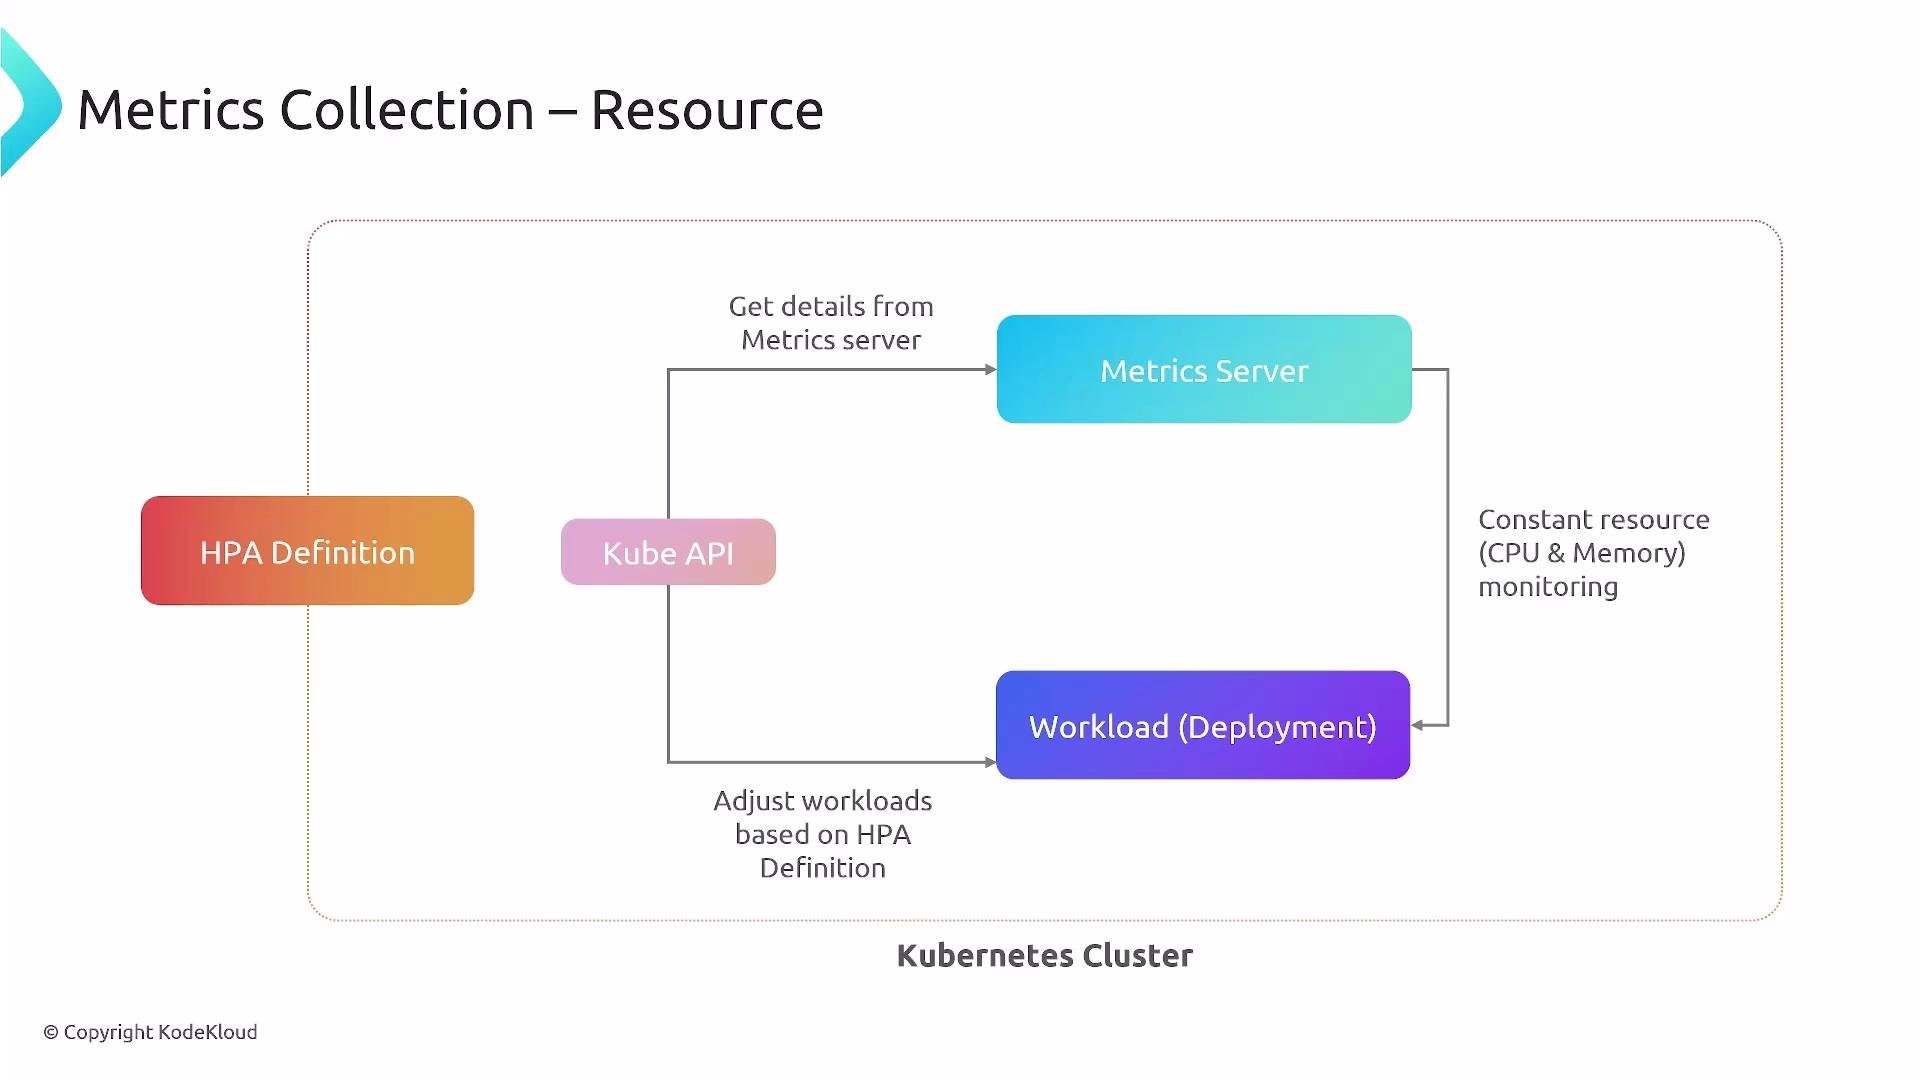
- HPA queries the Metrics APIs through the kube-apiserver.
- Metrics may come from the built-in Metrics Server (resource metrics), from in-cluster sources exposed via a custom metrics adapter, or from external systems via an external metrics adapter.
- Adapters translate or proxy metrics so the HPA controller sees them through Kubernetes-standard API groups.
- The Metrics Server exposes CPU and memory metrics under
metrics.k8s.io. HPA reads these via the kube-apiserver and uses them for resource-based scaling.
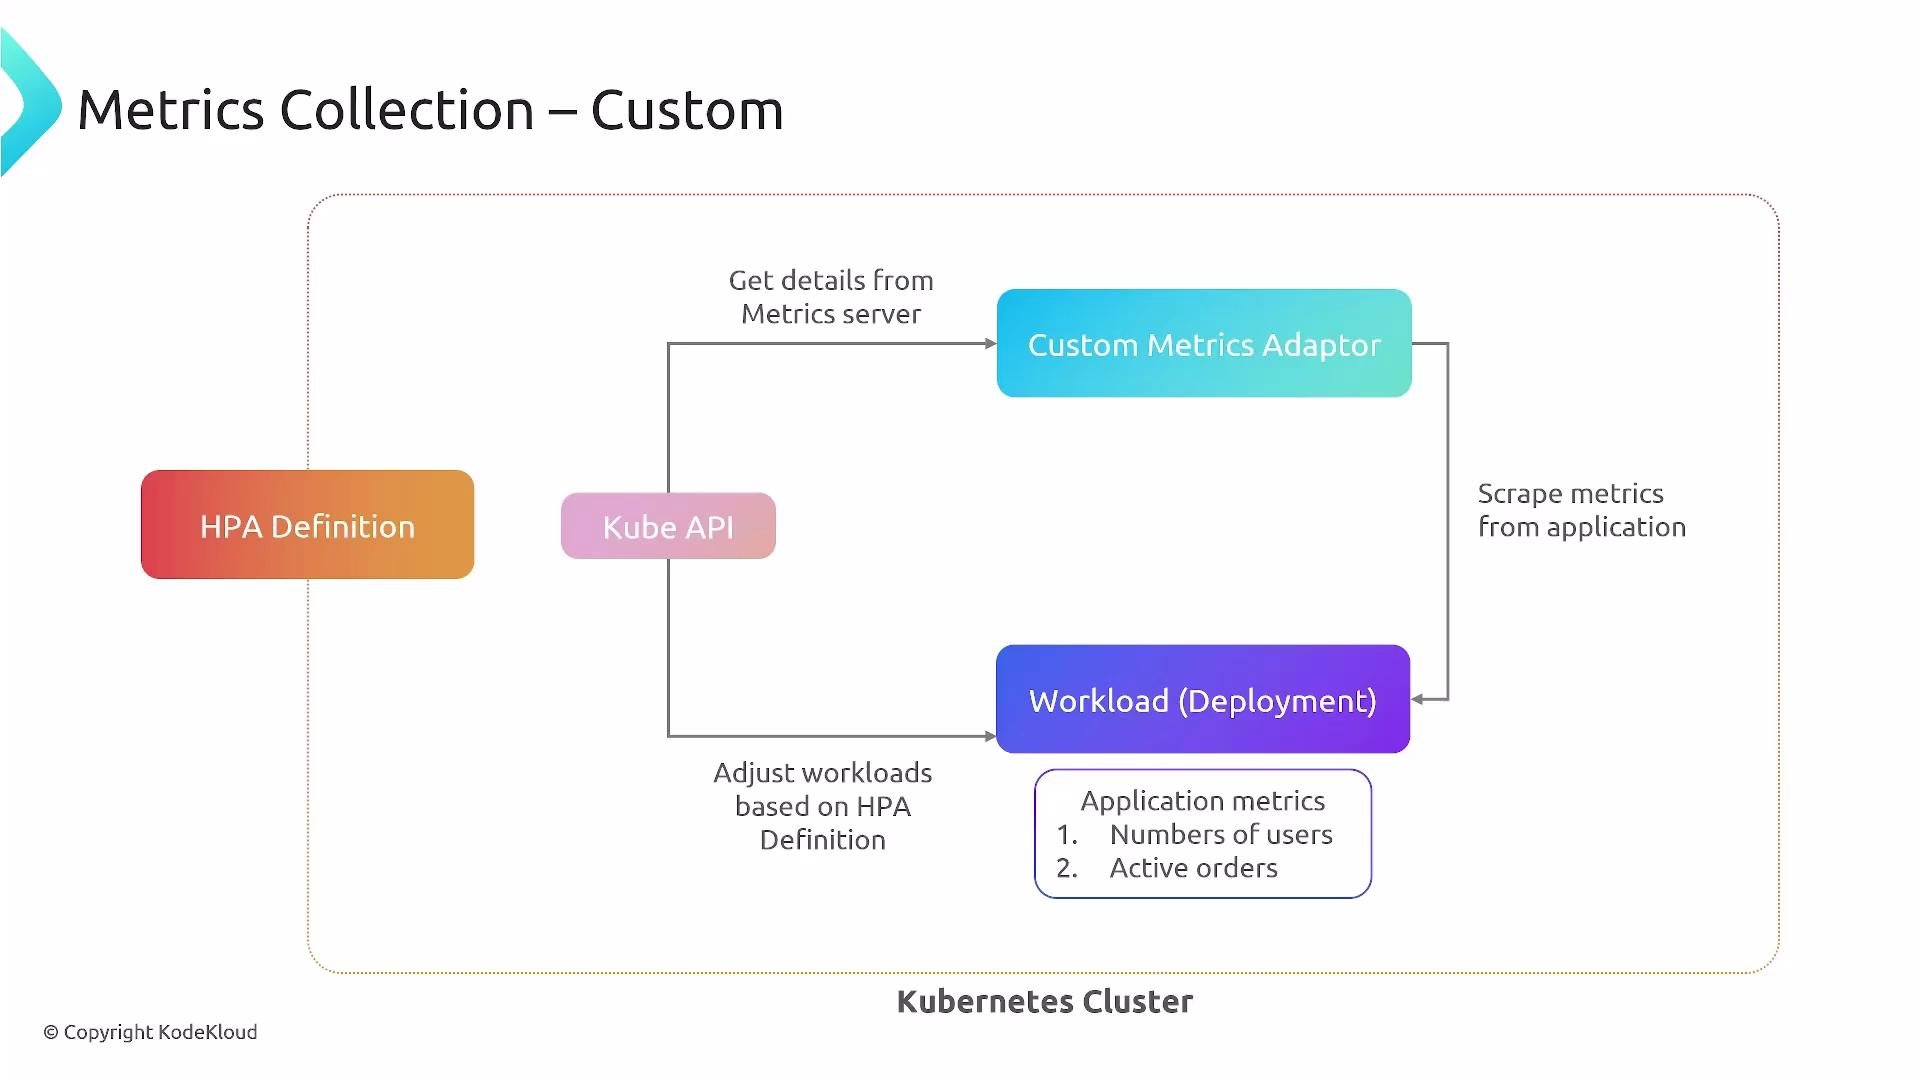
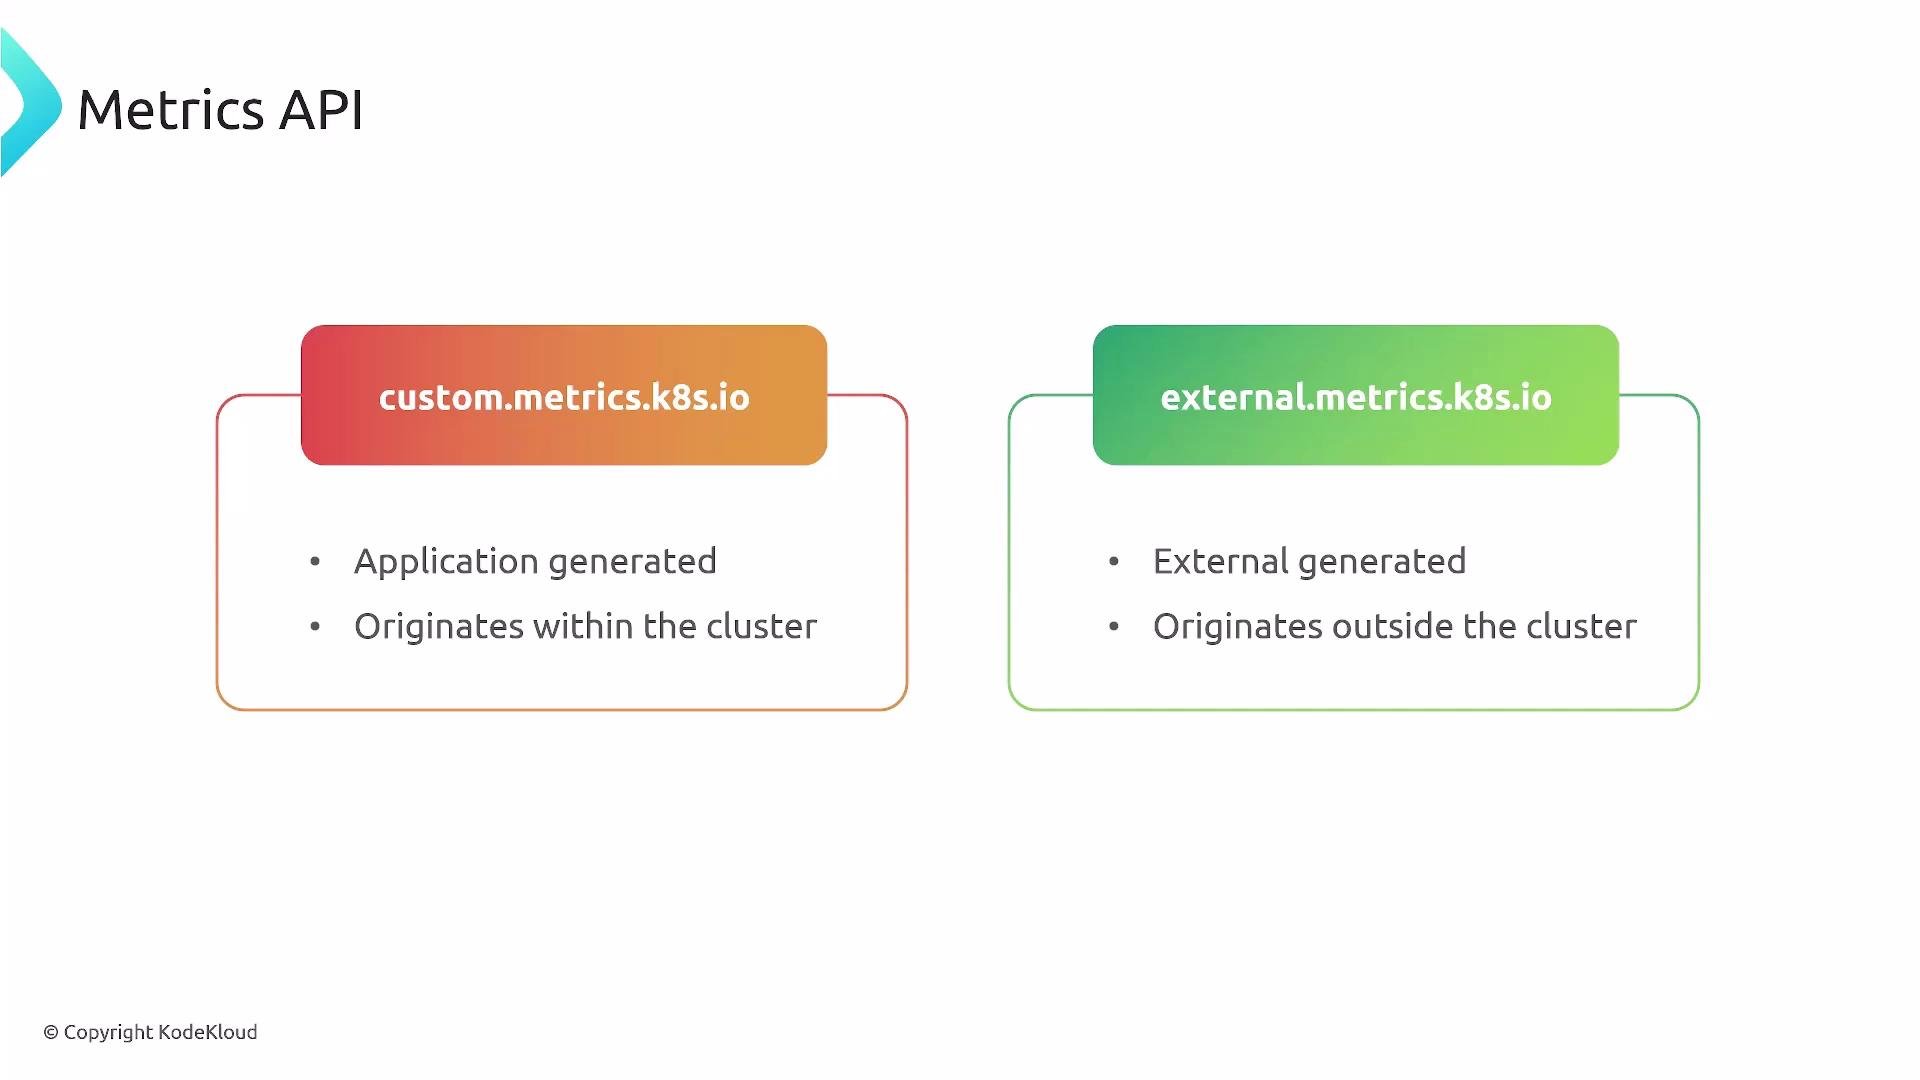
- Custom metrics are application-generated metrics exposed inside the cluster and surfaced to Kubernetes via
custom.metrics.k8s.io. - A custom metrics adapter scrapes or fetches metrics from application endpoints, Prometheus, or other in-cluster sources and exposes them to the custom metrics API.
- HPA can target these metrics to scale based on application-specific indicators such as requests per second, queue length, or active users.
http_requests_per_second:
- This HPA targets an average of
100requests per second across pods.
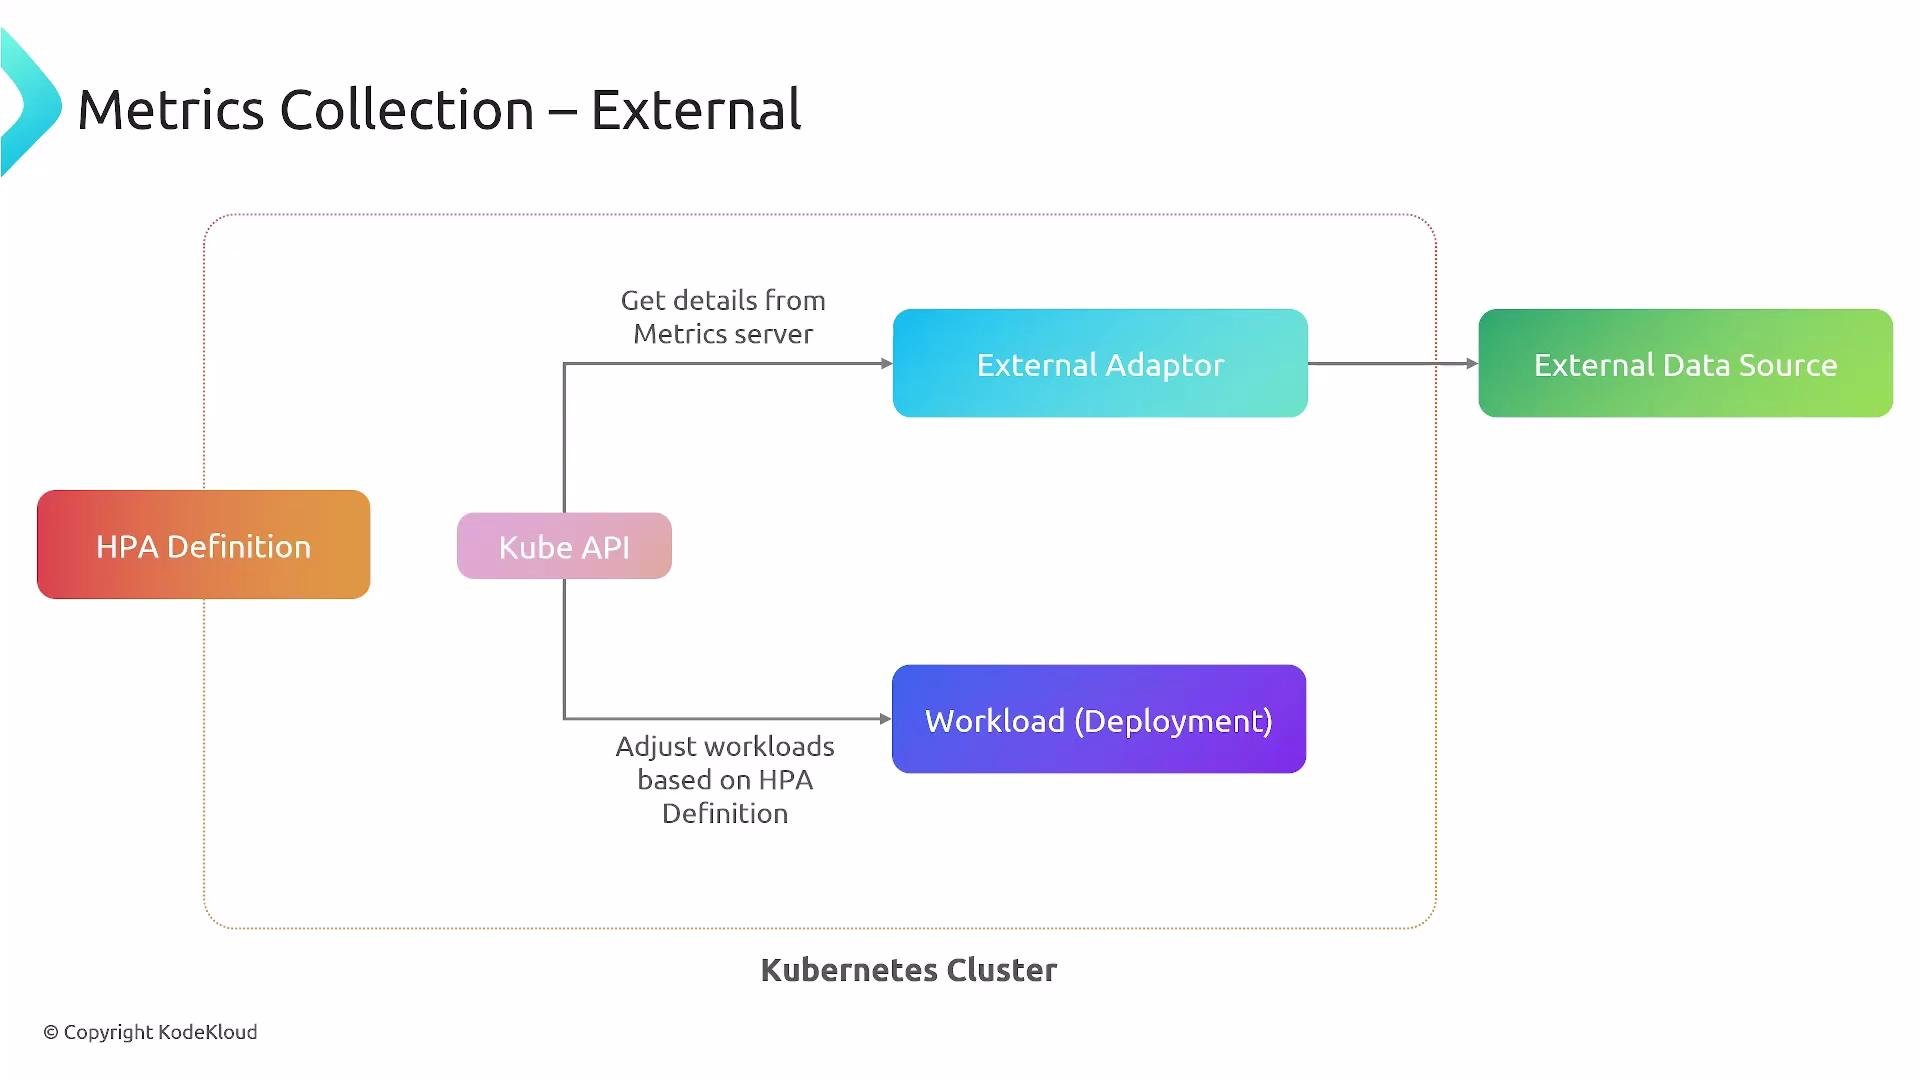
- External metrics originate outside the Kubernetes cluster (cloud provider metrics, external APMs like New Relic, Datadog, Dynatrace).
- An external metrics adapter runs in-cluster and bridges those external sources into
external.metrics.k8s.io. - HPA queries these metrics through the kube-apiserver to make scaling decisions.
newrelic.app.response_time:
- If the external metric value exceeds
500, the HPA will factor that into scaling behavior.
metrics.k8s.io— resource metrics (CPU, memory) from Metrics Server.custom.metrics.k8s.io— application-generated metrics exposed via a custom metrics adapter.external.metrics.k8s.io— externally generated metrics surfaced via an external metrics adapter.
- Prometheus Adapter: exposes Prometheus metrics as
custom.metrics.k8s.io— common for Prometheus-based stacks. - Cloud/Third-party adapters: Datadog, New Relic, and other providers supply external metric adapters to surface APM data into Kubernetes.
Make sure a Metrics Server (or equivalent) and the required metric adapters are installed and functioning. Without them, HPA cannot retrieve the metrics it needs to make scaling decisions.
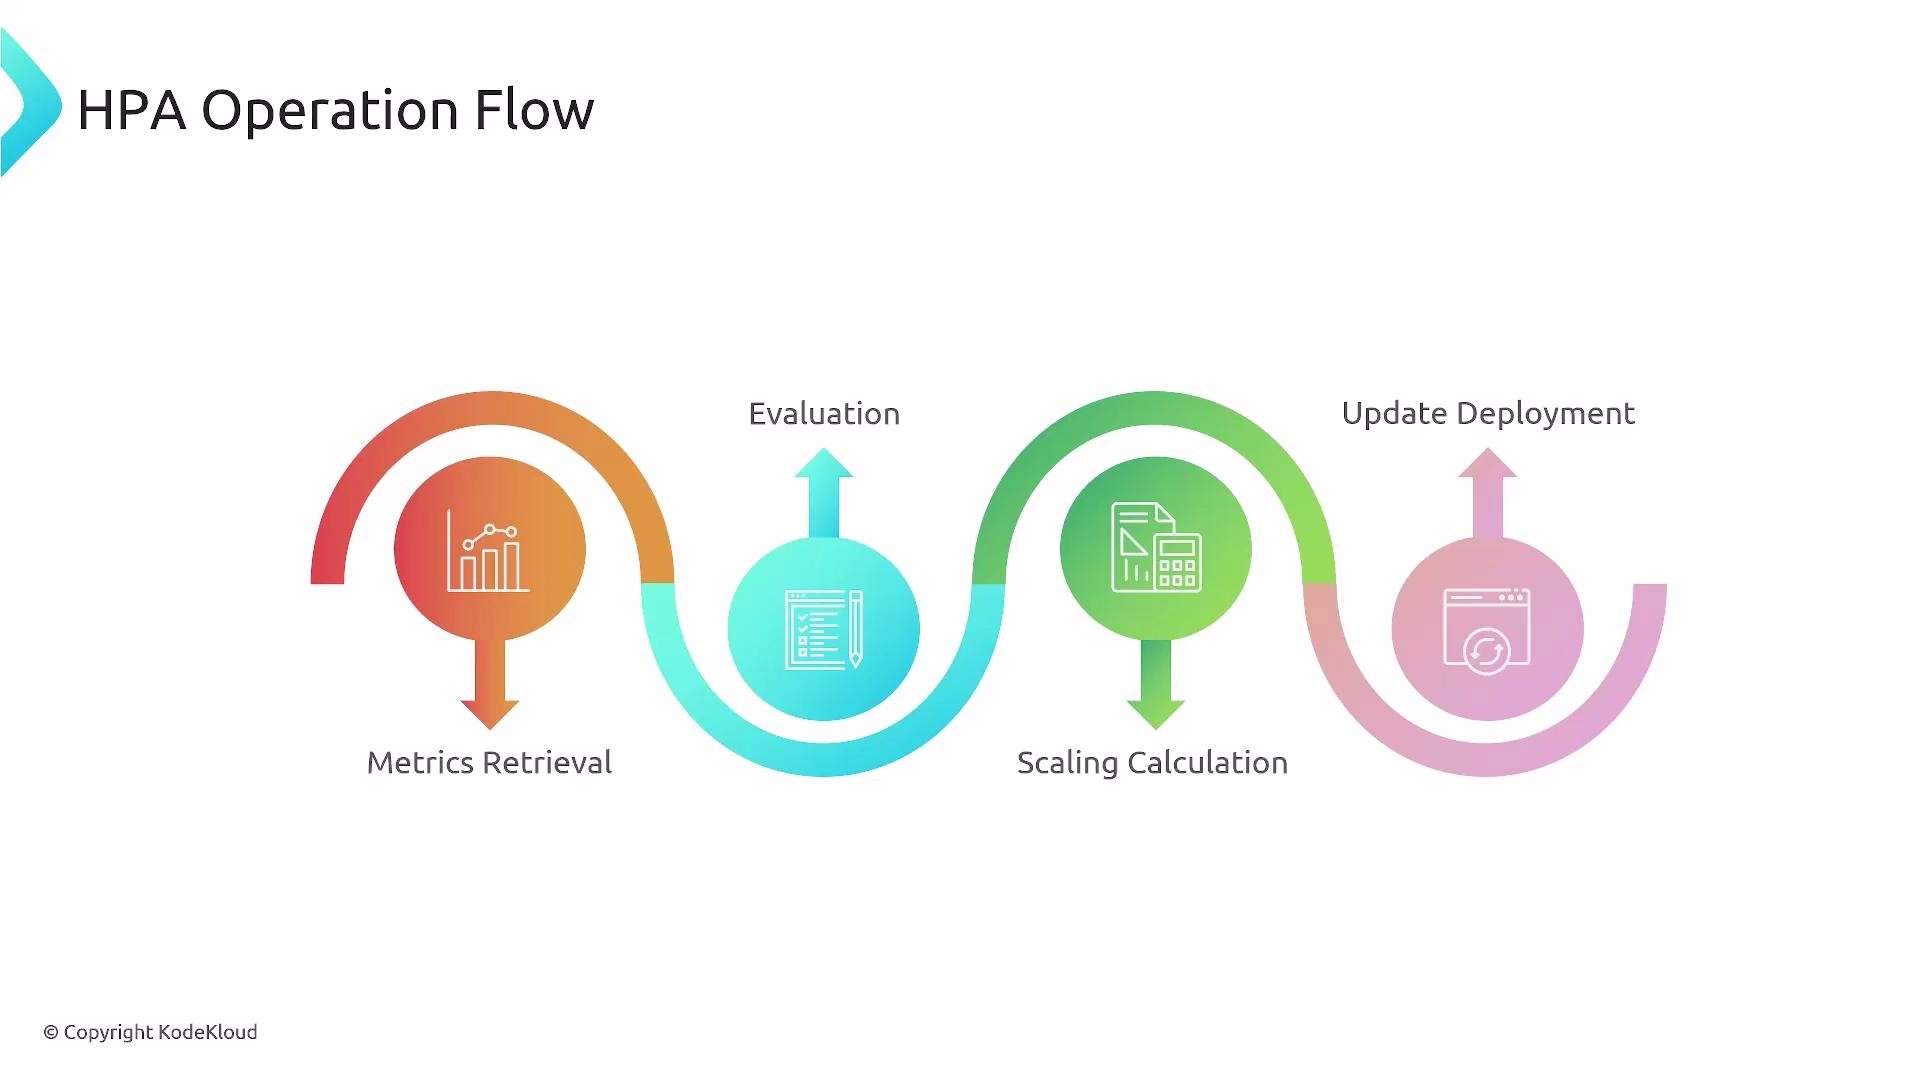
- The HPA controller runs a periodic control loop (sync period configurable via controller manager flags). Each iteration:
- Retrieves metrics from the Metrics APIs.
- Evaluates current values against configured targets.
- Calculates the desired replica count when thresholds are breached.
- Updates the target workload (Deployment/StatefulSet) with the new replica count, subject to scale policies.
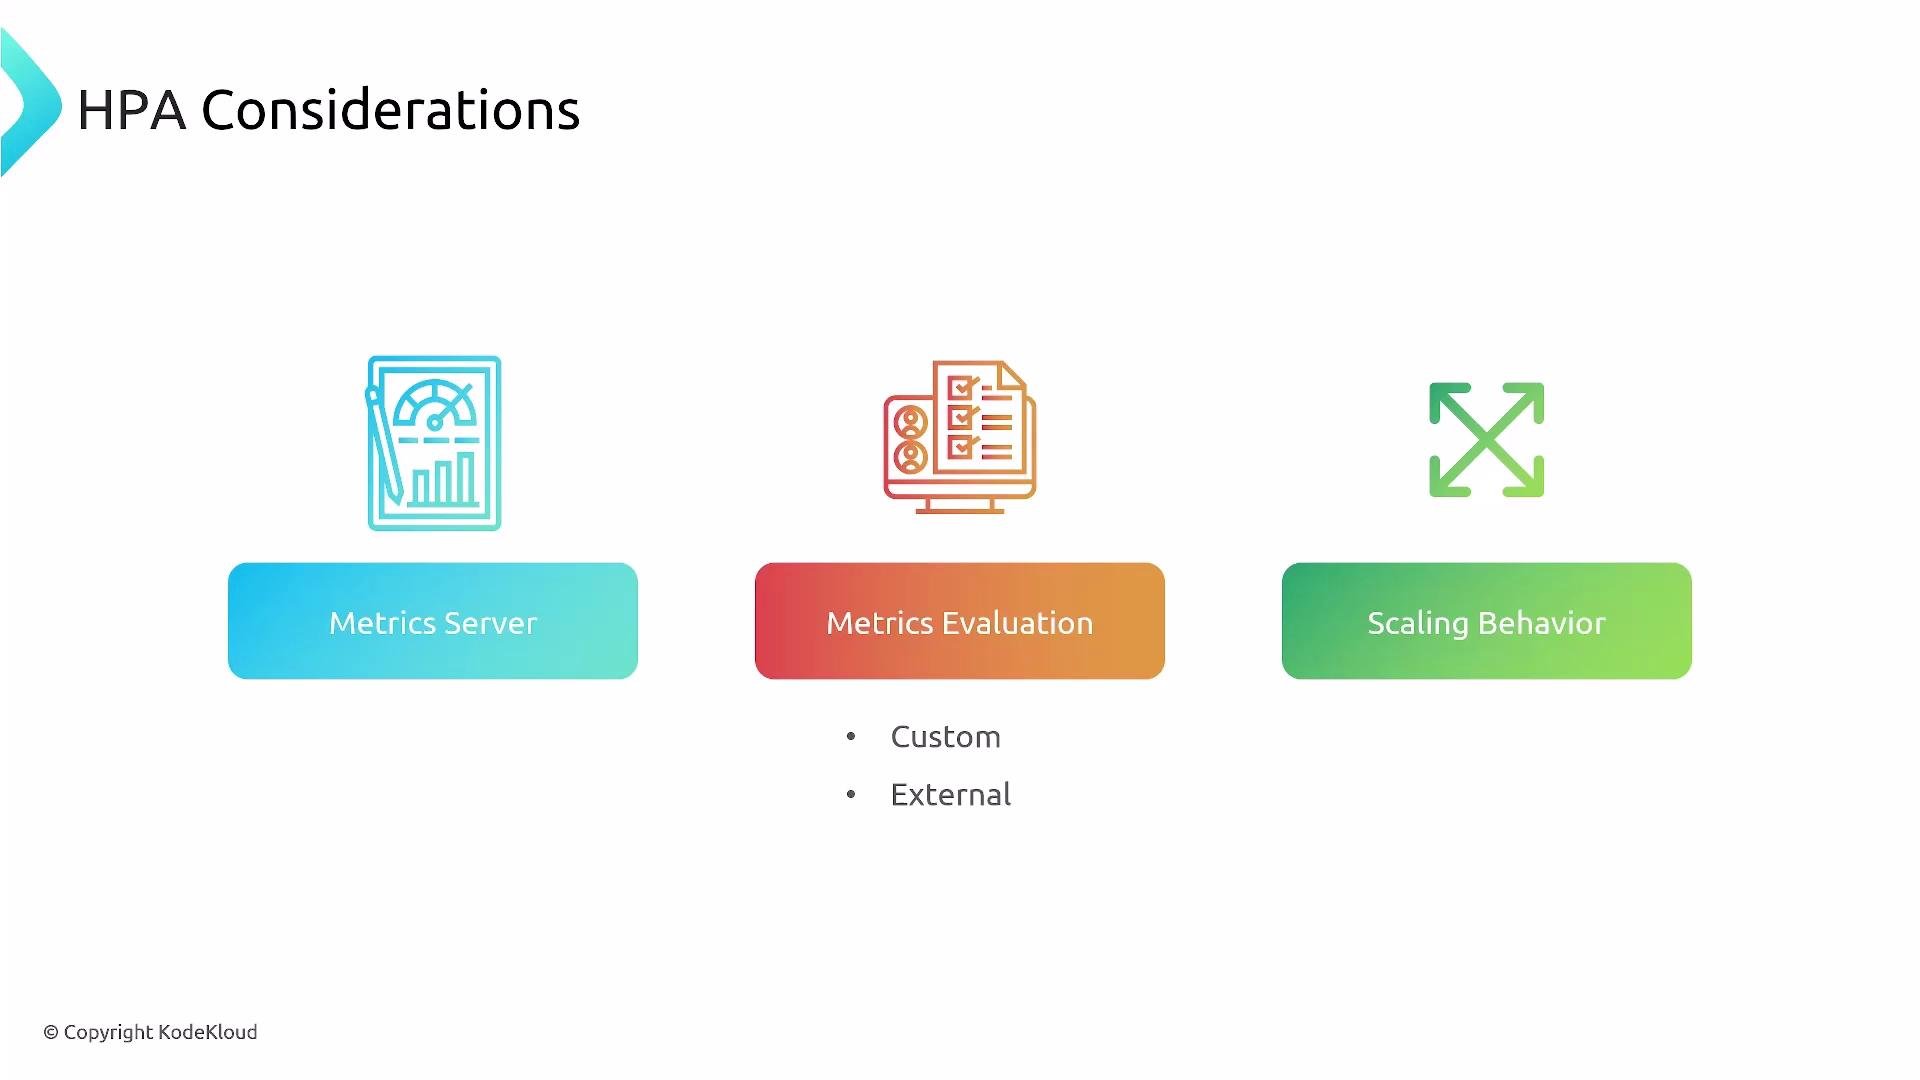
- Deploying Metrics Server: Some distributions omit it by default. Confirm
metrics-serveris running and reachable. - Scaling policy tuning: Use multiple metrics and configure scale-up/scale-down policies and stabilization windows to prevent oscillation.
- Aggressiveness: Determine how aggressive scaling should be based on your cost, latency and SLA requirements.
- Testing and observability: Validate HPA behavior with load tests and monitor HPA events (
kubectl describe hpa <name>) and adapter logs.
- Hands-on: install Metrics Server and a Prometheus Adapter, create sample applications that expose custom metrics, and apply HPAs to observe autoscaling behavior.
- Read more:
- Kubernetes HPA documentation
- Metrics Server
- Prometheus Adapter for Kubernetes Metrics APIs
- Your cloud provider or APM documentation for their external metric adapters (e.g., Datadog, New Relic)