

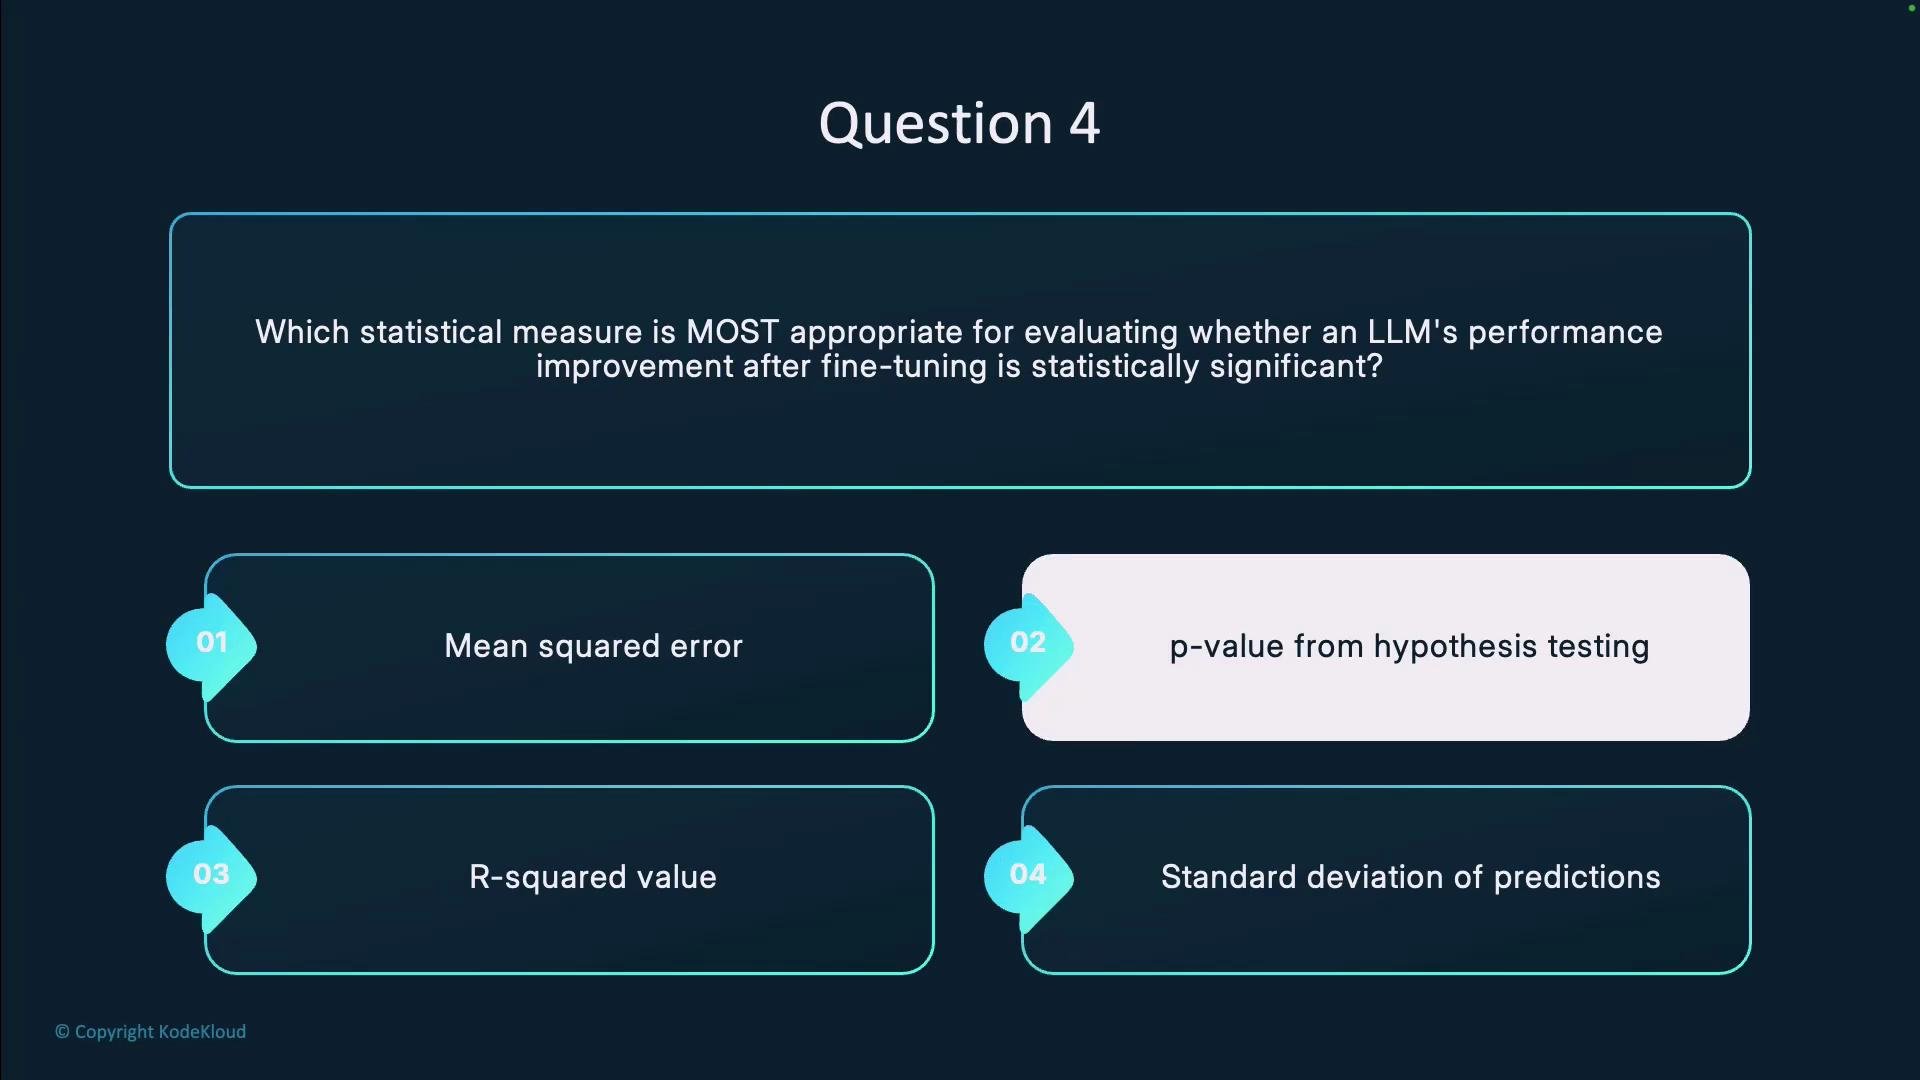
- Mean Squared Error
- P-value from hypothesis testing
- R-squared value
- Standard deviation of predictions
- Select the hypothesis test that matches your evaluation design and data properties:
- Use a paired test (e.g., paired t-test or Wilcoxon signed-rank test) when the same prompts/test set are evaluated by both models.
- Use permutation/randomization tests or bootstrap methods when normality or other parametric assumptions are questionable.
- Always report complementary statistics to give practical context:
- Effect size (e.g., Cohen’s d)
- Confidence intervals for metric differences
- Absolute metric changes (accuracy, F1, MSE, etc.)
- Correct for multiple comparisons when running many tests (multiple metrics, prompts, or model variants) using methods such as the Bonferroni correction or the Benjamini–Hochberg procedure.
Use hypothesis testing to determine whether observed improvements are unlikely under the null hypothesis, but always pair p-values with effect sizes and confidence intervals to communicate practical significance.
A small p-value does not guarantee a meaningful improvement. Large evaluation sets can produce tiny p-values for negligible effect sizes—always inspect absolute metric changes and effect sizes before declaring a meaningful gain.
- Mean Squared Error (MSE): A performance metric that quantifies average squared errors; useful for reporting but not a statistical test of significance by itself.
- R-squared: Indicates proportion of variance explained in regression tasks; it does not test whether differences between model versions are statistically significant.
- Standard deviation of predictions: Measures variability of outputs but does not assess whether differences between model versions are unlikely under the null hypothesis.