

Monitoring and observability are complementary: monitoring detects and alerts on problems; observability lets you investigate and understand root causes using logs, metrics, and traces.
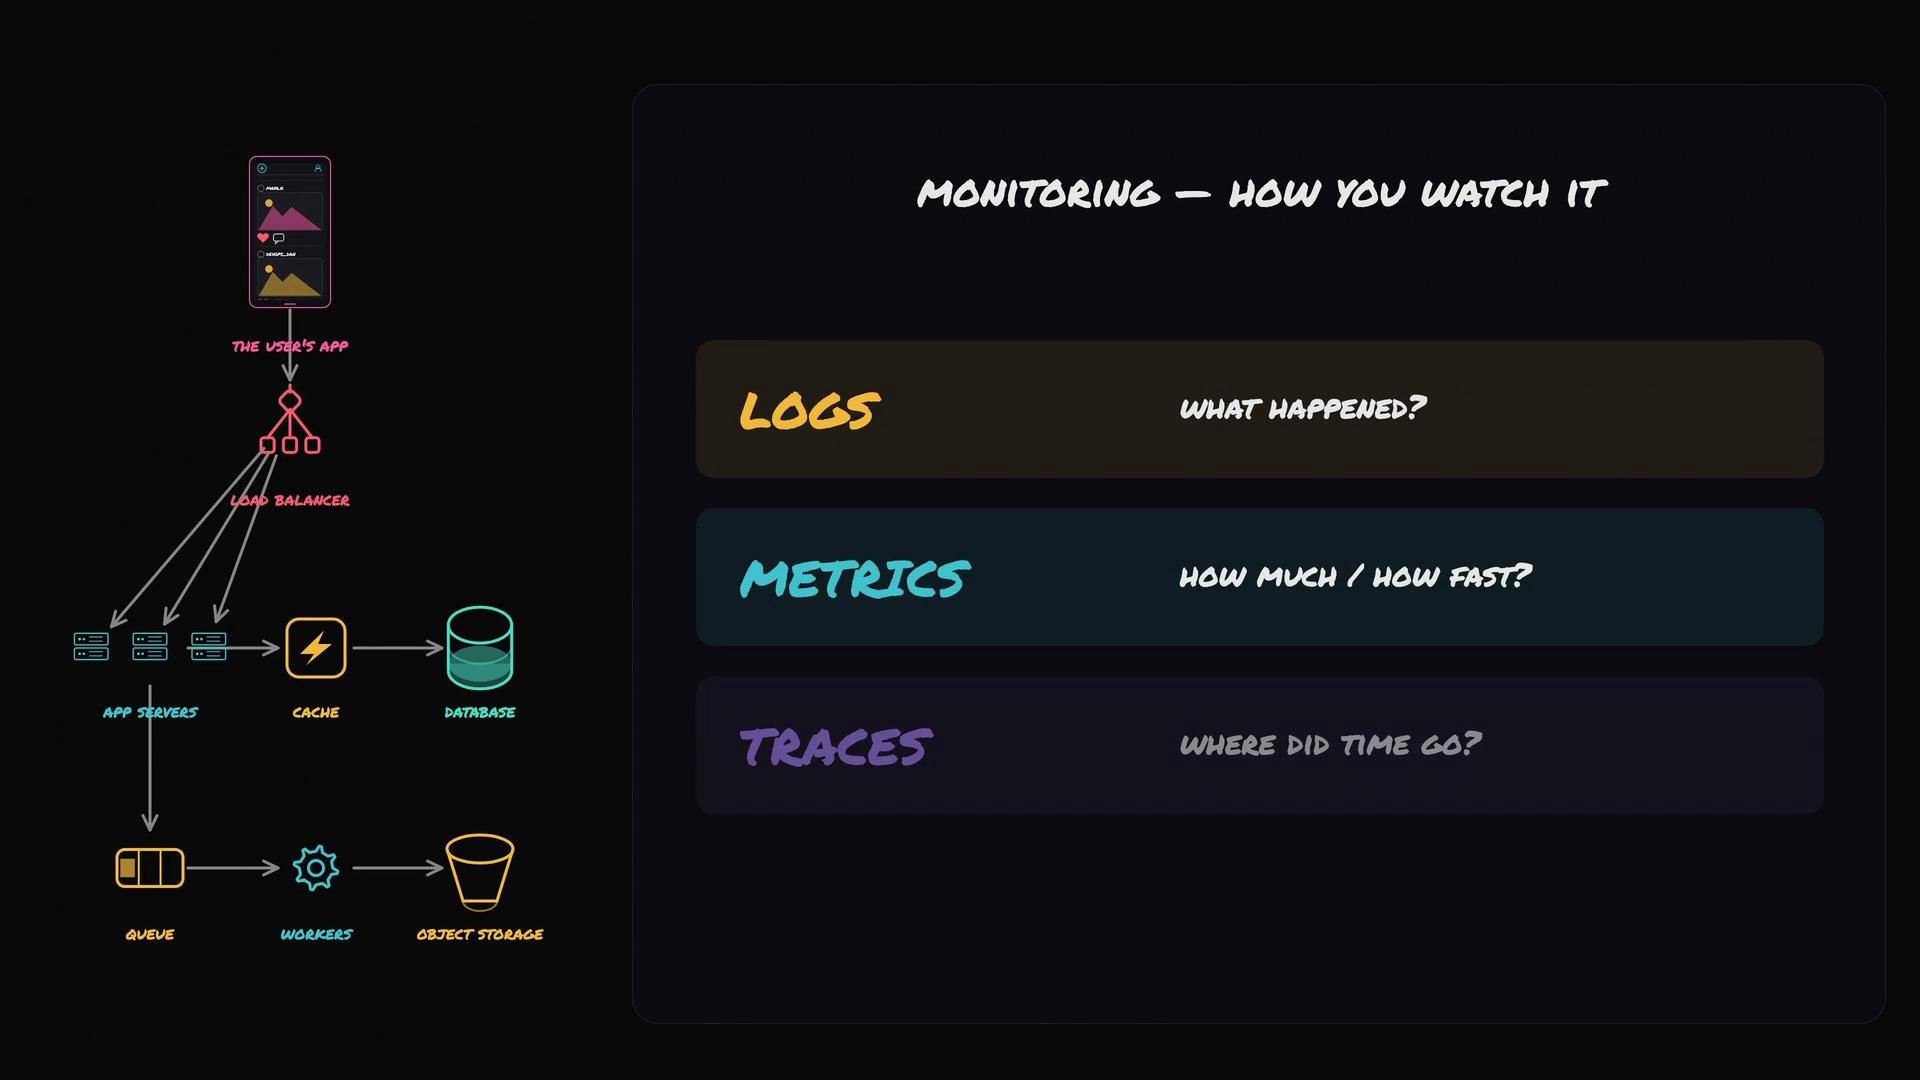
Logs
Logs are timestamped records of discrete events in your application. When something important happens — a user uploads a photo, a cache miss occurs, or a database query fails — your app writes a log line describing the event. Logs answer: what happened, when, and where? Think of logs as receipts for your system: each line proves a specific event occurred at a given time. Because busy systems emit large volumes of logs, you should ship them to a centralized store so you can search, filter, and correlate events across many machines. Example log lines:Metrics
Metrics are numeric values tracked over time: requests per second, feed latency, cache hit rate, queue depth, CPU usage, or the percentage of error responses. While logs represent single events, metrics aggregate behavior and let you answer: how much load is there? how often are requests failing? is latency trending up?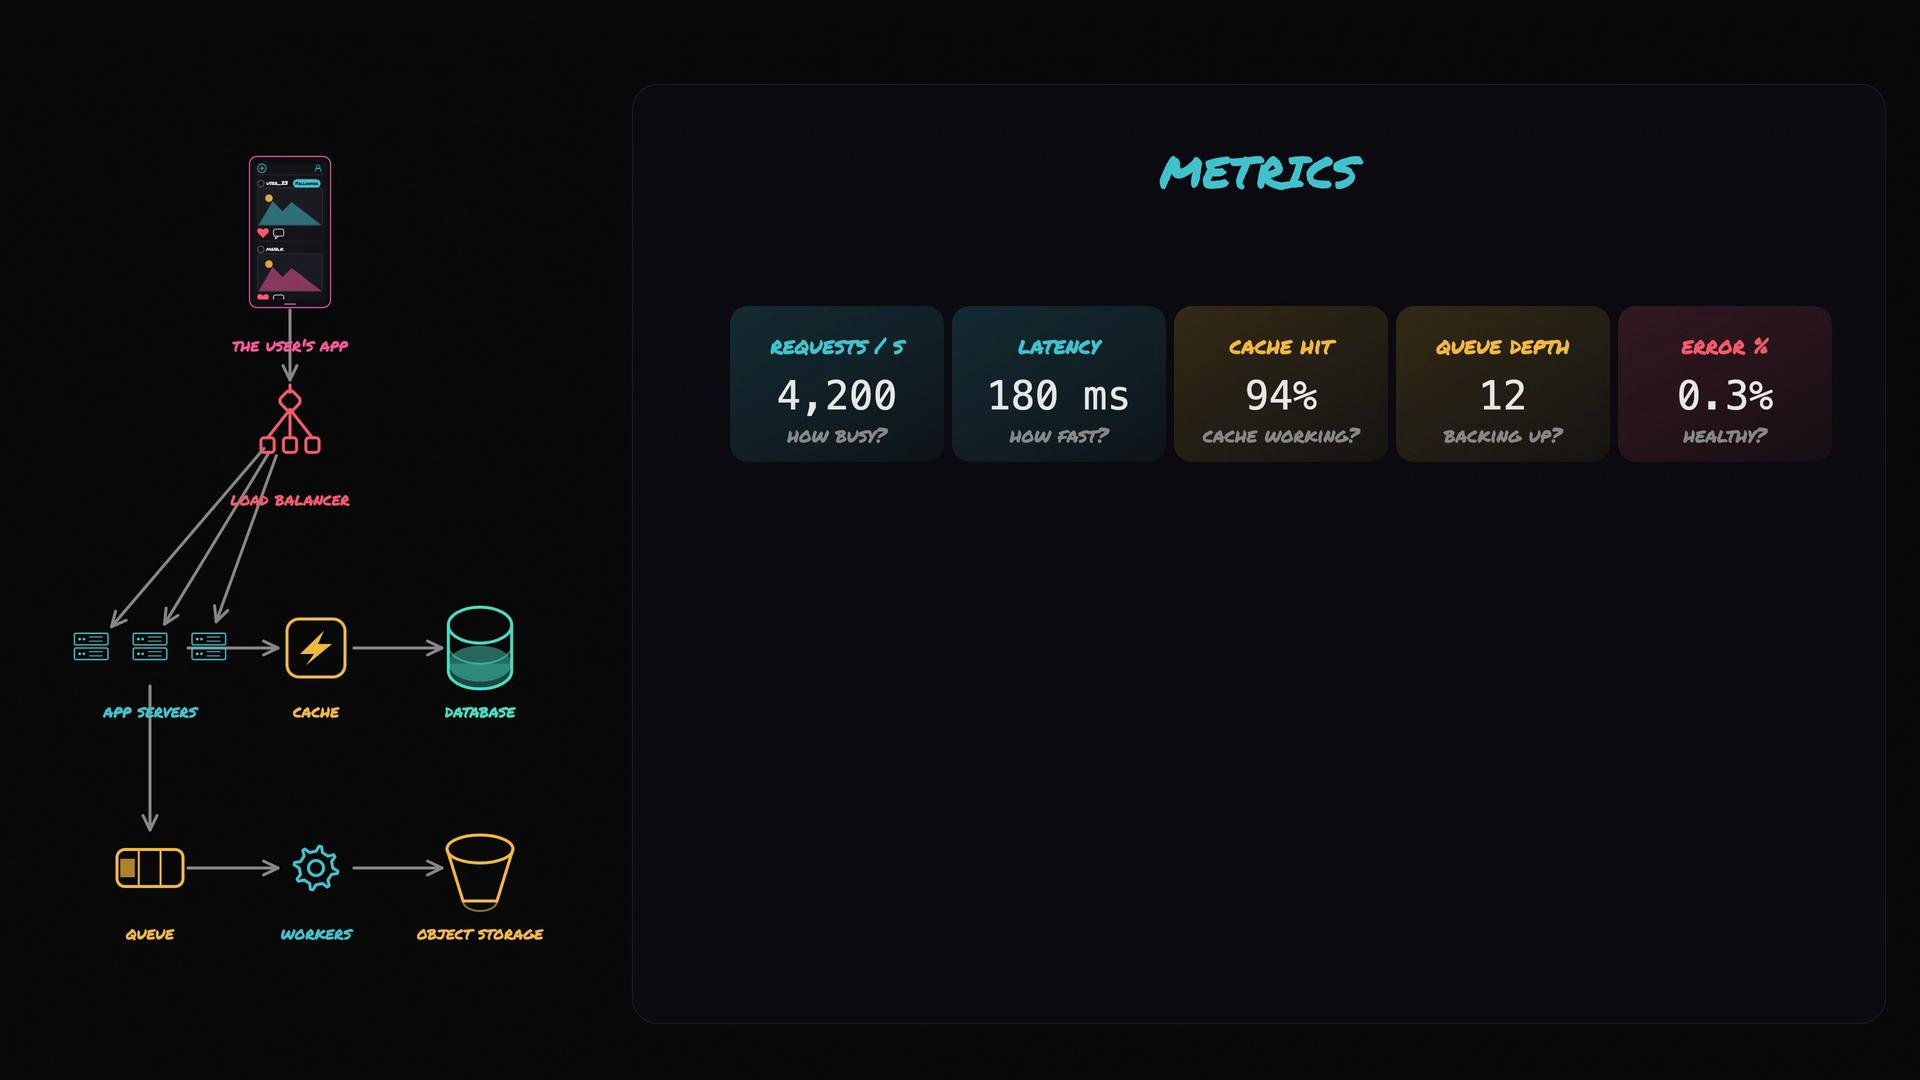
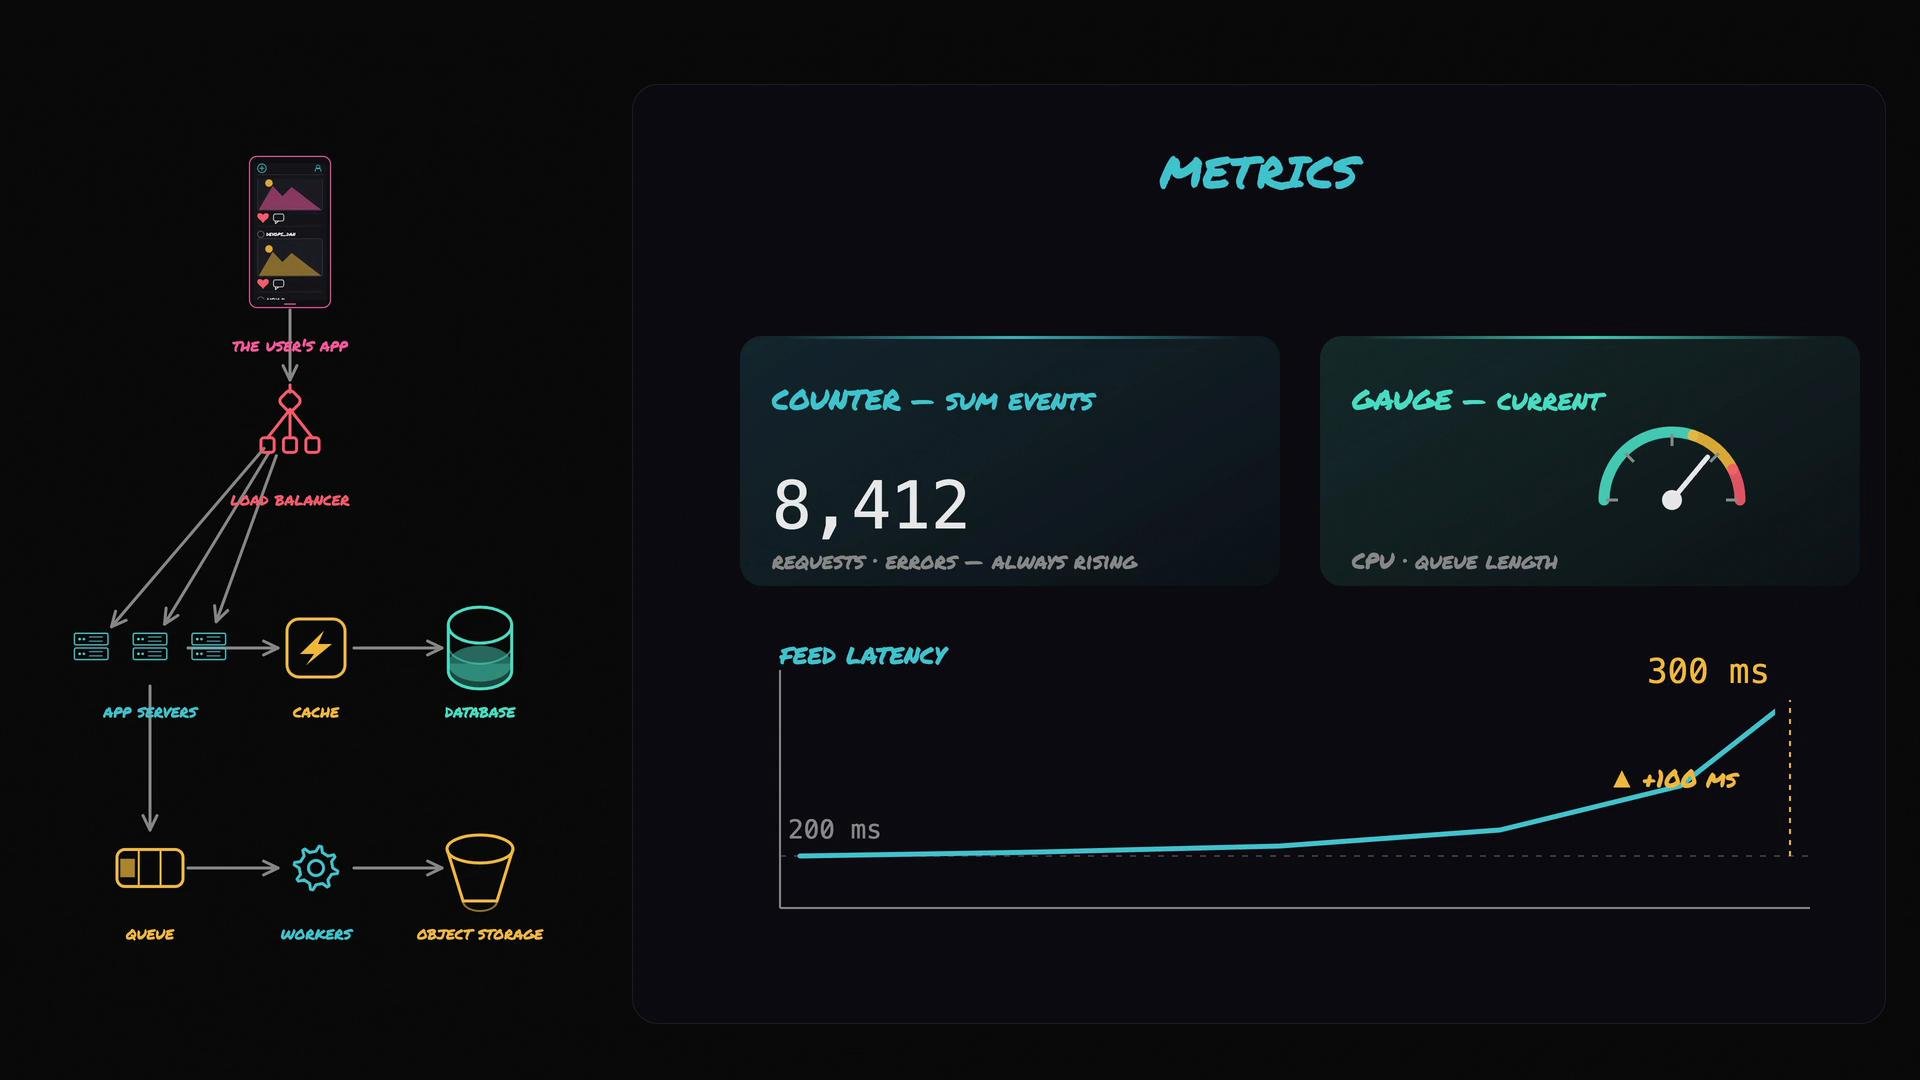
- Requests per second (RPS)
- 95th / 99th percentile latency for the feed API
- Cache hit ratio
- Queue depth (number of messages waiting)
- Error rate (percent of 5xx responses)
Traces
Traces show the end-to-end timing of a single request as it travels through multiple services. When a user upload or feed request slows down, traces let you pinpoint which component added the latency. Traces are composed of spans. Each span records the start and end time for a unit of work (for example, a database query or an external HTTP call). By assembling spans across services, a trace reveals the critical path — the spans that consumed most of the time.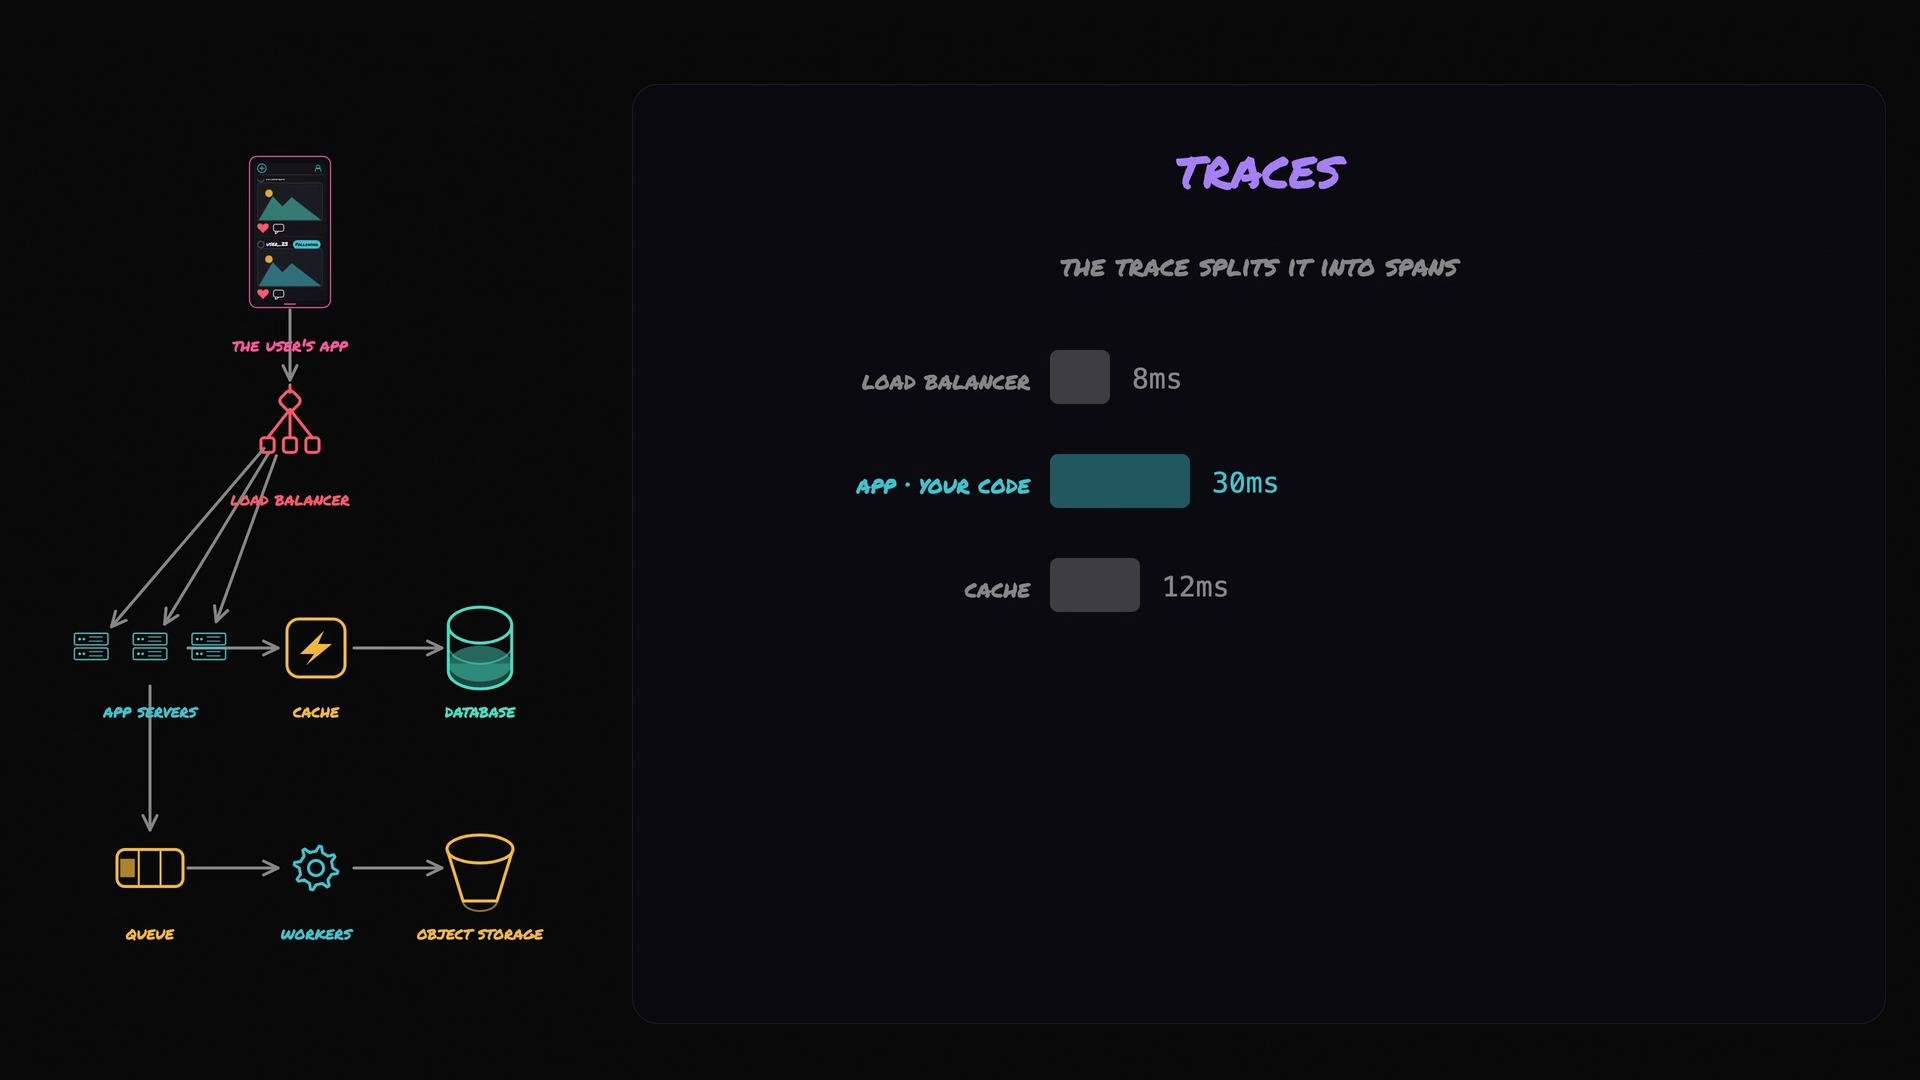
Alerts and automation
You don’t want humans staring at dashboards 24/7, so set alerts on the metrics that matter. Alerts trigger when a metric breaches a threshold for some duration and notify the right responder (email, Slack, pager). Example alert rule:Avoid alert fatigue by choosing thresholds and durations that reduce false positives. If alerts are noisy, responders will start ignoring them and real incidents may be missed.
Common jargon and tools
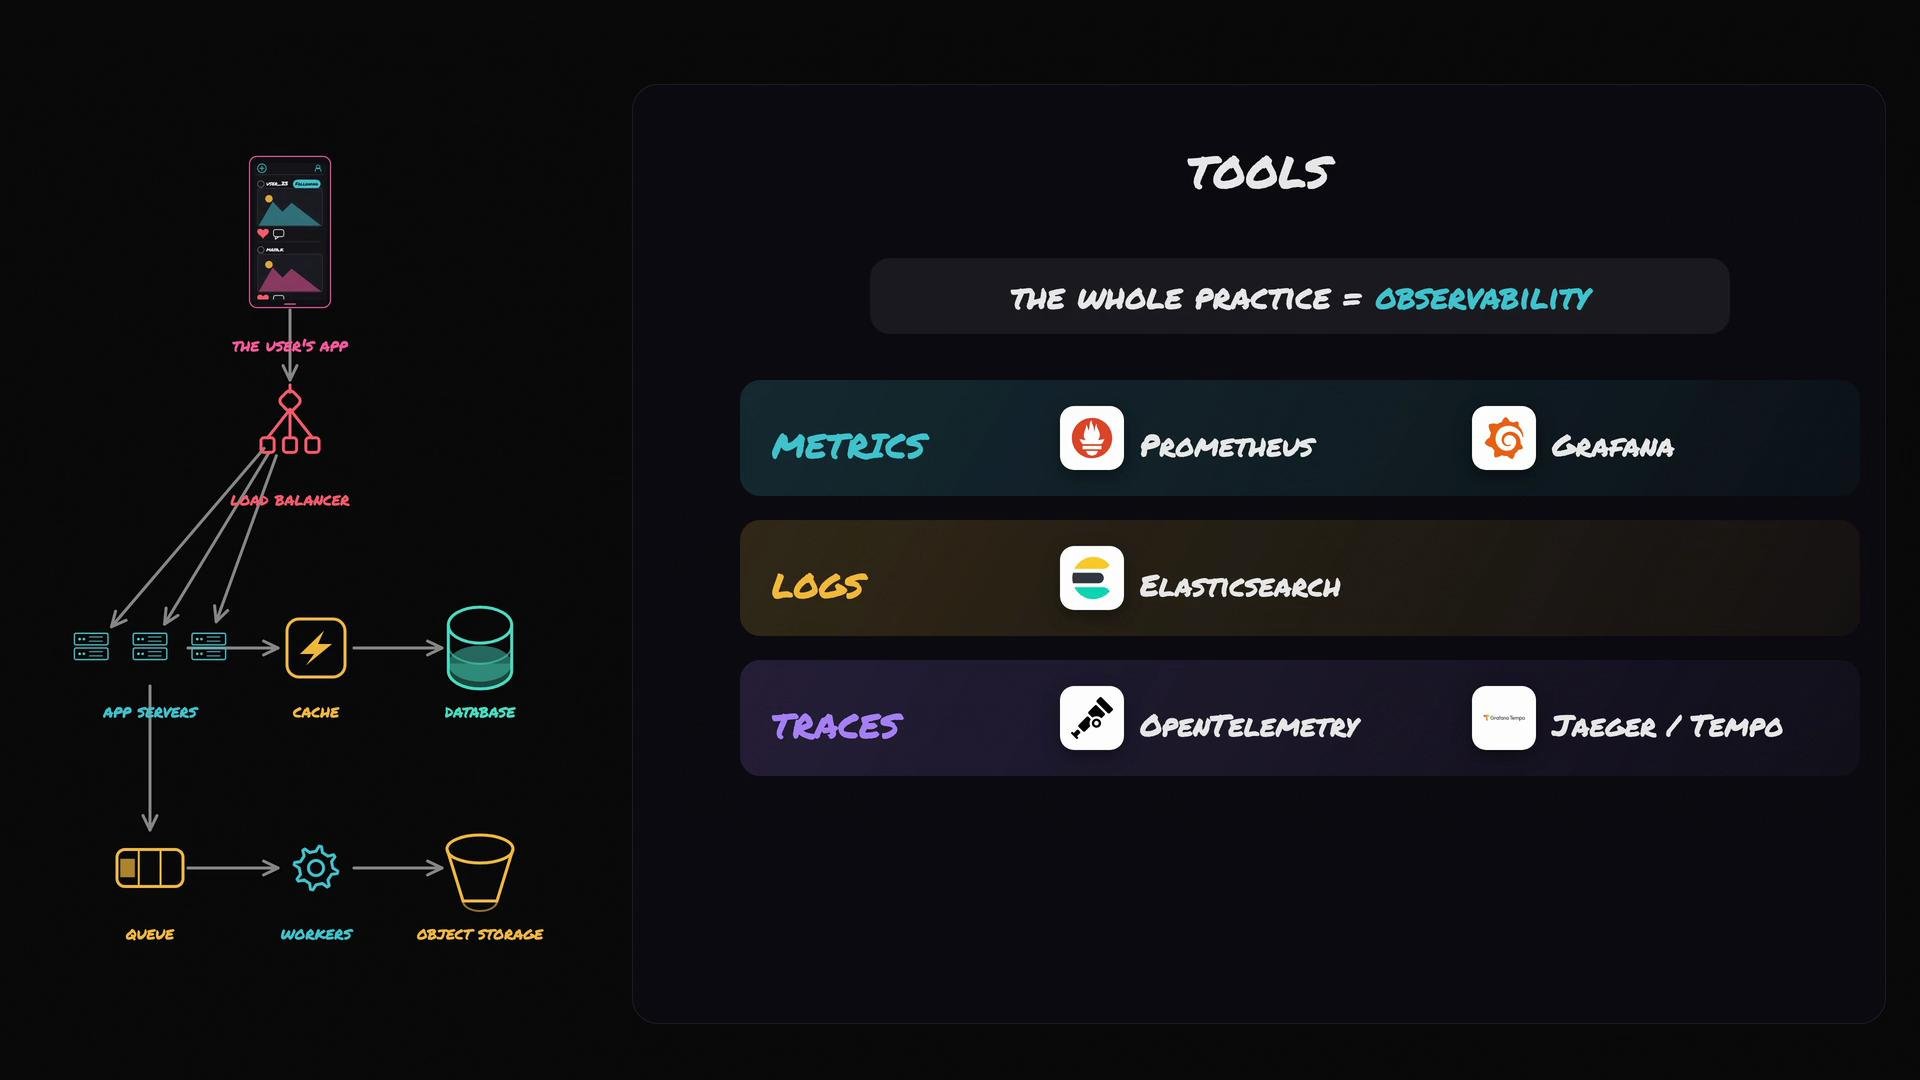
- Observability: the practice of understanding internal system state from external signals.
- Core signals: logs, metrics, traces.
- Dashboard: visual display of important metrics and alerts.
- Alerting: rules that trigger notifications when metrics breach thresholds.
- Metrics: Prometheus (scraping & storage), Grafana (dashboards) — https://prometheus.io, https://grafana.com
- Logs: Elasticsearch (indexing & search), commonly used in ELK/EFK stacks — https://www.elastic.co/elasticsearch
- Tracing: OpenTelemetry instrumentation, with backends such as Jaeger or Grafana Tempo — https://opentelemetry.io, https://www.jaegertracing.io, https://grafana.com/oss/tempo
Summary
Monitoring combines three complementary signals:- Metrics: high-level, aggregated indicators that show something is changing.
- Traces: distributed timing that pinpoints where a request spent time.
- Logs: detailed event-level records that explain what happened.
- Prometheus: https://prometheus.io
- Grafana: https://grafana.com
- Elasticsearch: https://www.elastic.co/elasticsearch
- OpenTelemetry: https://opentelemetry.io
- Jaeger: https://www.jaegertracing.io
- Grafana Tempo: https://grafana.com/oss/tempo