Interviewers often ask a simple but revealing question: How big does this system actually need to be?
  • How many servers?
  • How much storage?
  • What bottlenecks should you plan for?
This is a back-of-envelope estimation — a quick, reasoned approximation that demonstrates your assumptions and how you think about scale. Don’t give a single number without showing the factors that led you to it. Break large numbers into smaller pieces and explain each assumption. Start from users and activity patterns. Example assumptions
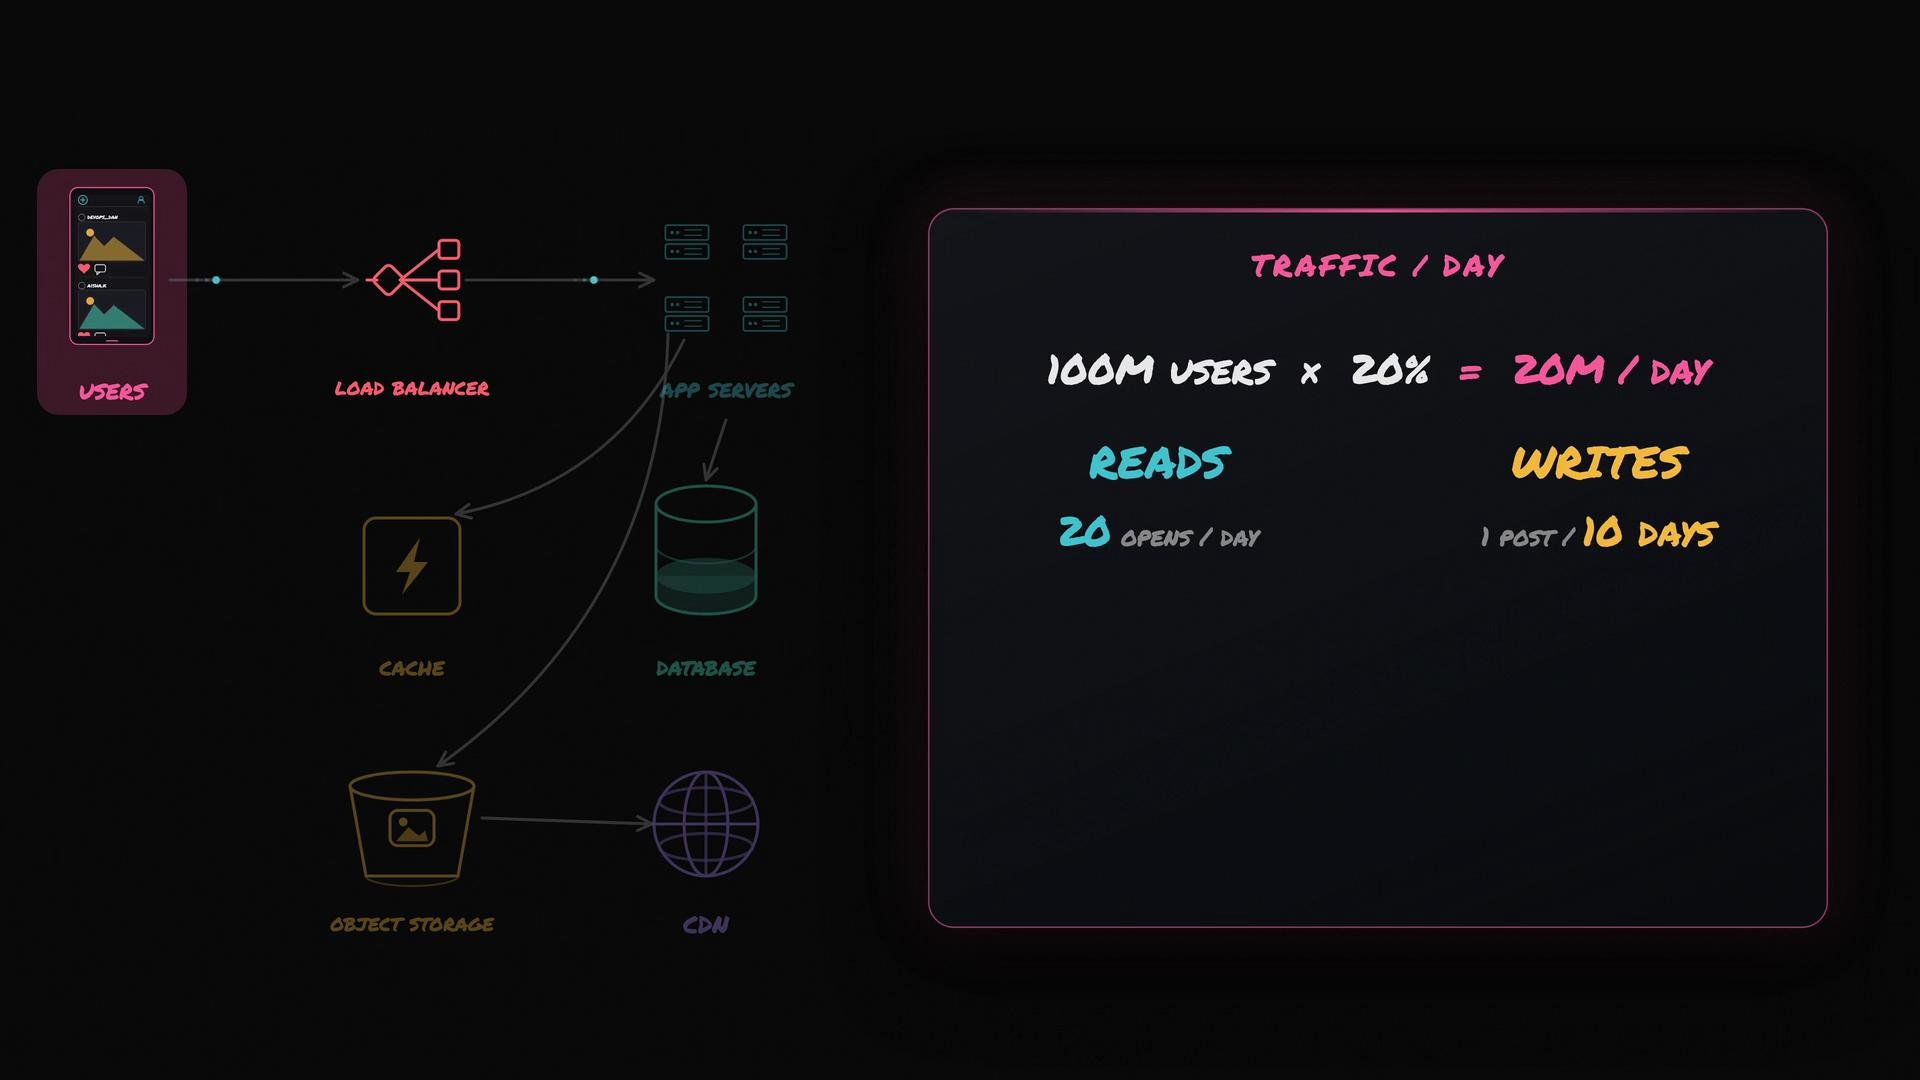
  • Registered users: 100 million
  • Daily active users (DAU): 20% → 20 million DAU
  • App type: photo-sharing (reads dominate)
  • Opens per active user per day: 20
  • Posts per active user per day: 0.1 (one post every 10 days)
From those assumptions we compute daily totals:
  • Feed reads per day = 20,000,000 × 20 = 400,000,000 reads/day
  • Uploads per day = 20,000,000 × 0.1 = 2,000,000 uploads/day
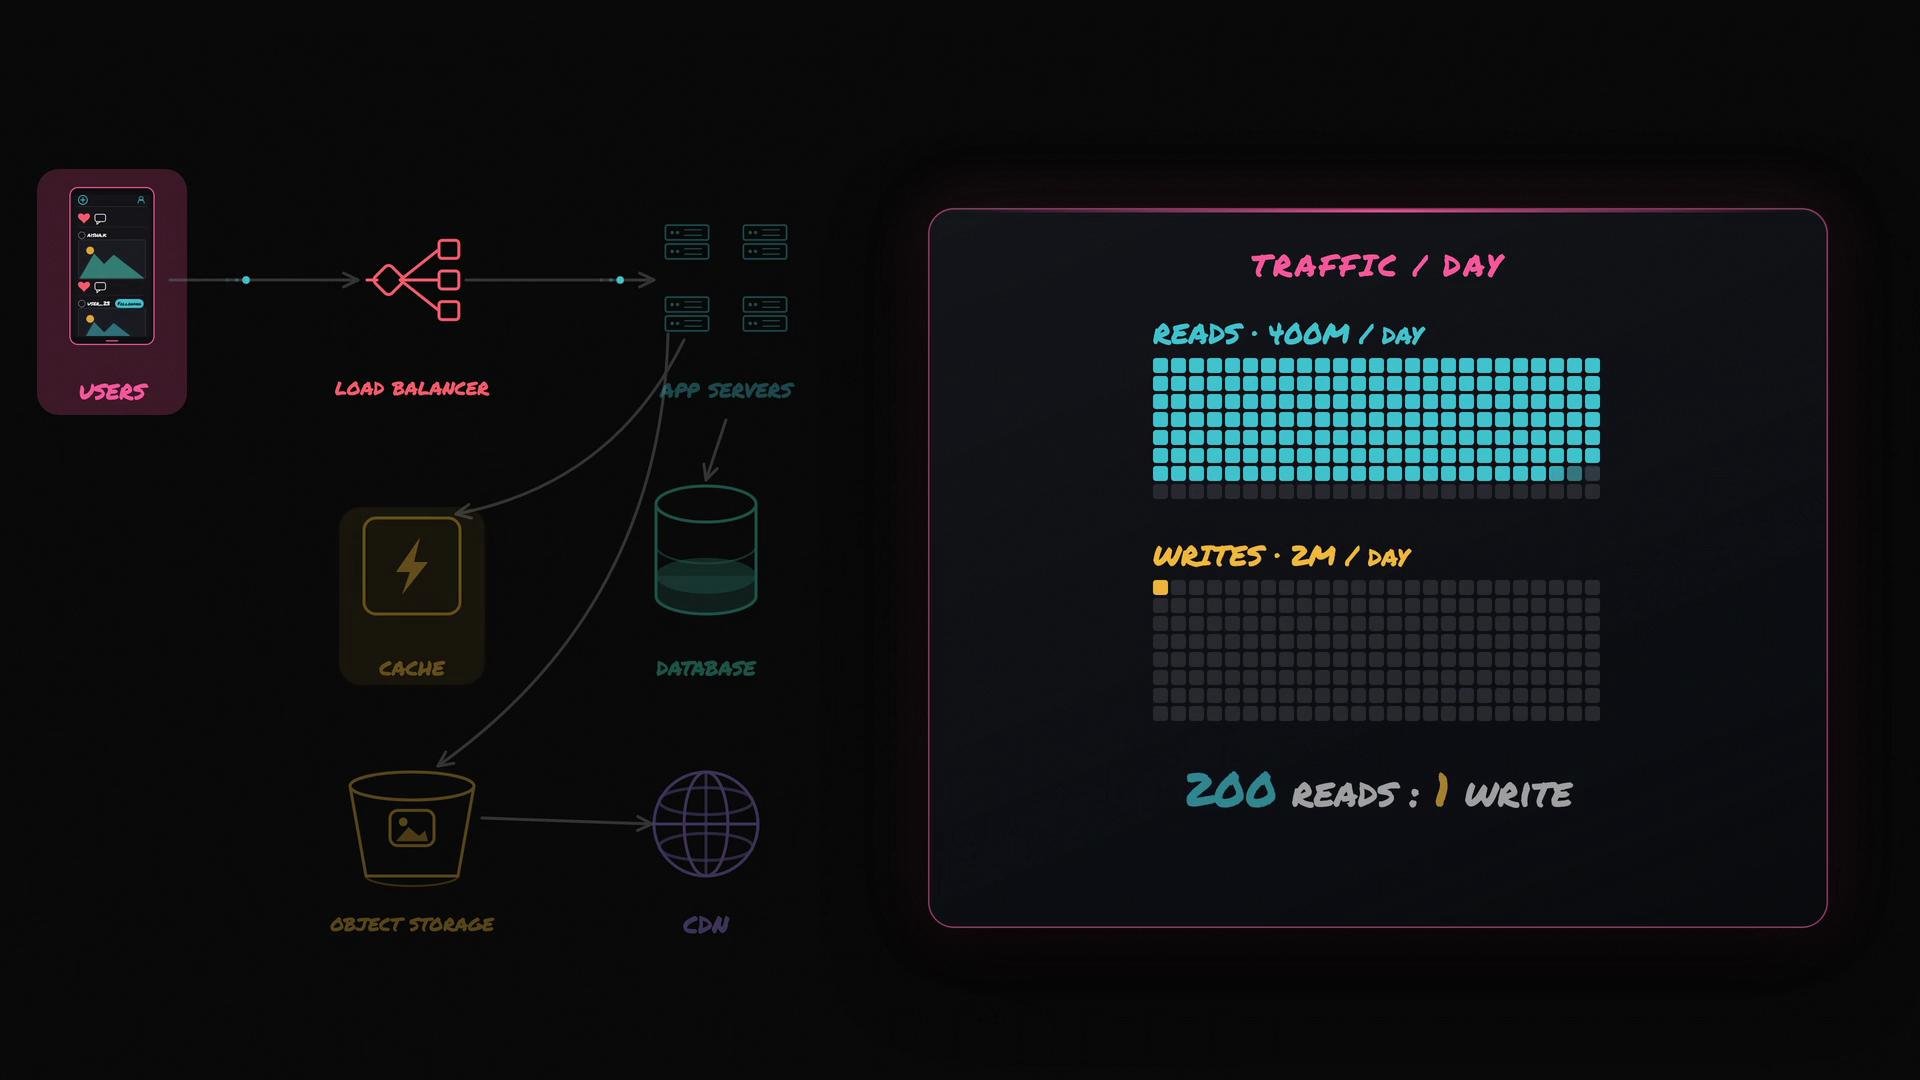
Reads therefore vastly outnumber writes (~200:1), which immediately suggests using caches, read replicas, CDNs, and object storage.
The image illustrates a server architecture diagram showing a flow from users through a load balancer to app servers, cache, database, object storage, and CDN, alongside traffic calculations involving reads and writes per day.
Convert daily numbers into per-second rates — server sizing is usually driven by requests-per-second (RPS). A day has:
Per-second estimates (exact and rounded): Traffic is not uniform. Peak traffic (time-of-day effects, promotions, viral events) is typically 3–5× the daily average. Always design for peak, not average. Using the rounded average of ~4,000 r/s:
  • Peak (3–5×) ≈ 12,000–20,000 r/s
  • For conservatism, use peak ≈ 15,000 r/s
Uploads:
  • Average uploads/sec ≈ 23 u/s
  • Peak uploads/sec (3–5×) ≈ 60–120 u/s
Uploads consume more resources per request: network bandwidth, storage writes, and CPU for image processing (resizing, thumbnails, transcoding).
The image illustrates a network architecture diagram showing user interactions with a system involving a load balancer, app servers, cache, database, object storage, and CDN, alongside a traffic chart displaying 400 million reads and 2 million writes per day.
Estimate storage needs. Assume each uploaded photo averages 5 MB when you count original + compressed + resized versions. Then:
  • Daily object data ingested = 2,000,000 × 5 MB = 10,000,000 MB = 10,000 GB = 10 TB/day
  • Annual growth ≈ 10 TB/day × 365 ≈ 3,650 TB ≈ 3.65 PB/year
This confirms two important design decisions:
  • Store image binaries in a cheap, scalable object store (S3, GCS, Azure Blob), not in the primary relational database.
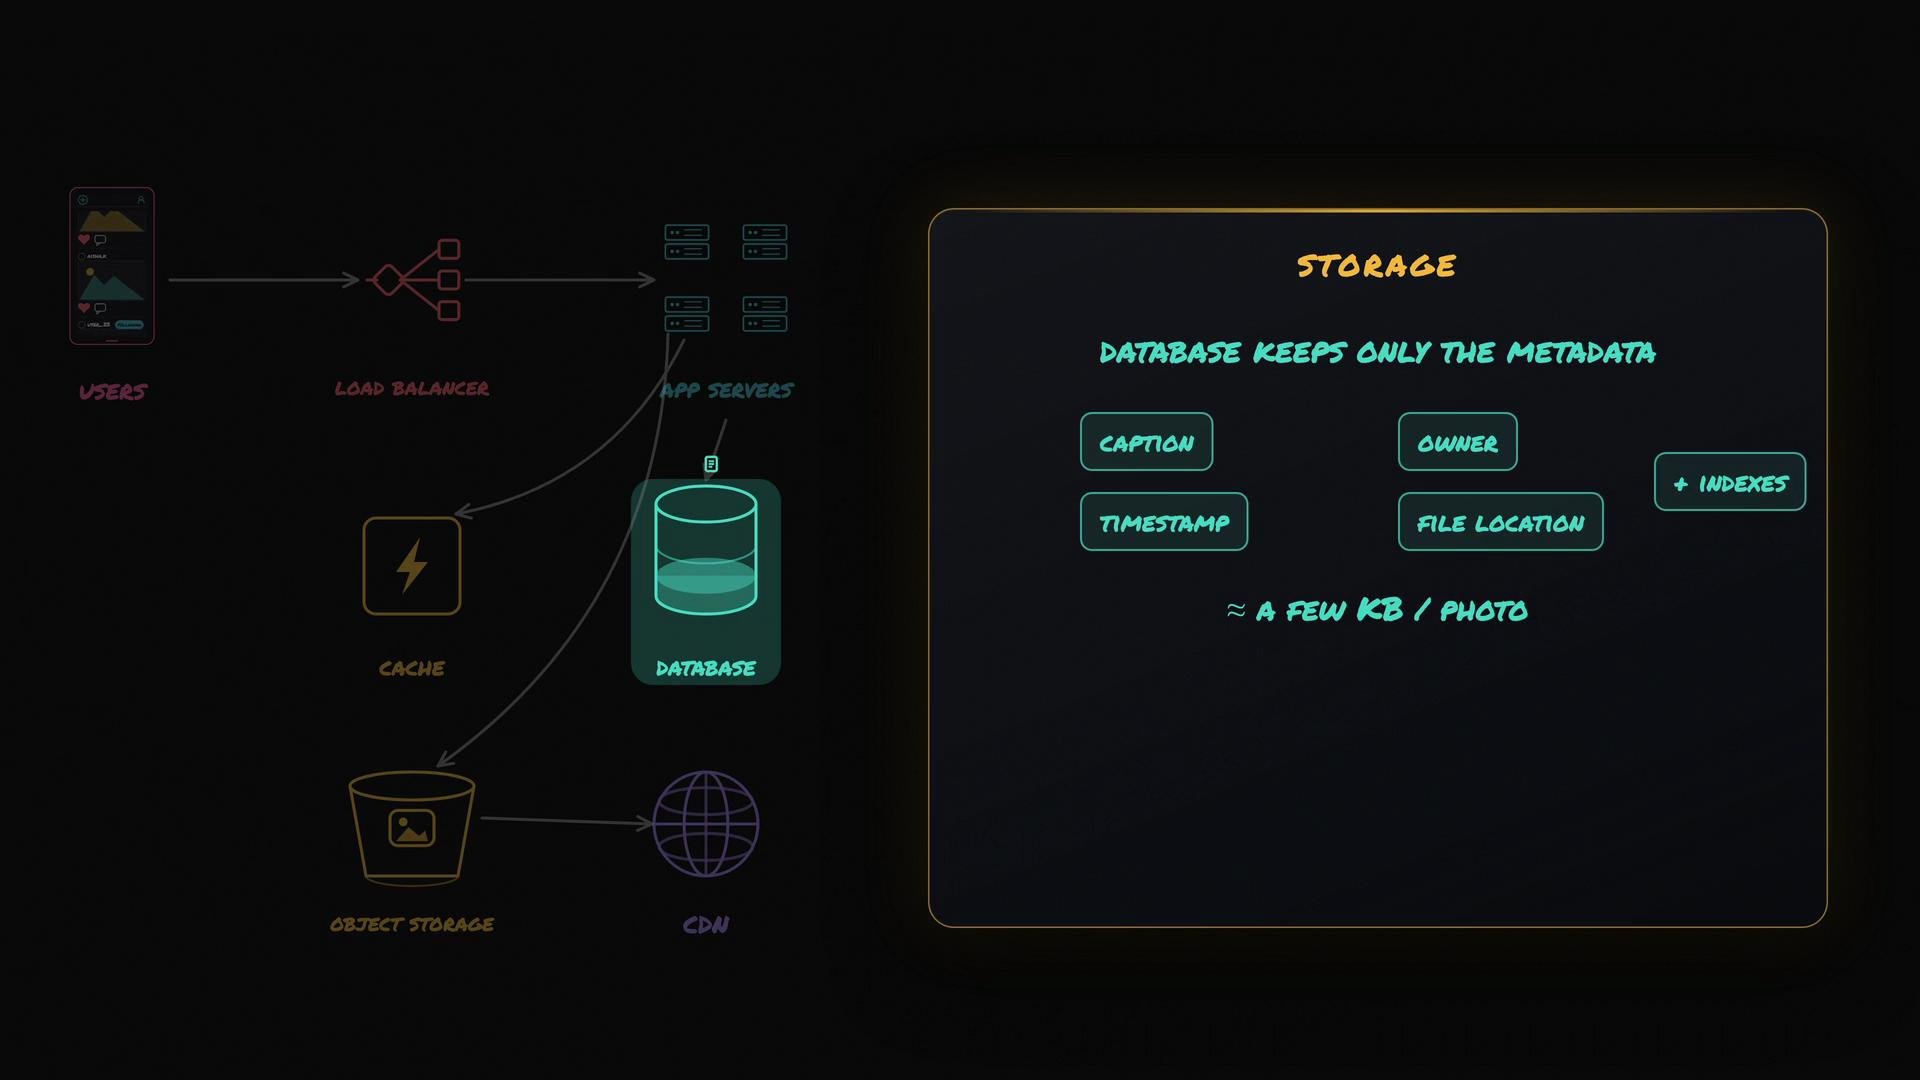
  • Keep only metadata (caption, owner, timestamps, storage location, indexes) in the DB — a few KB per photo.
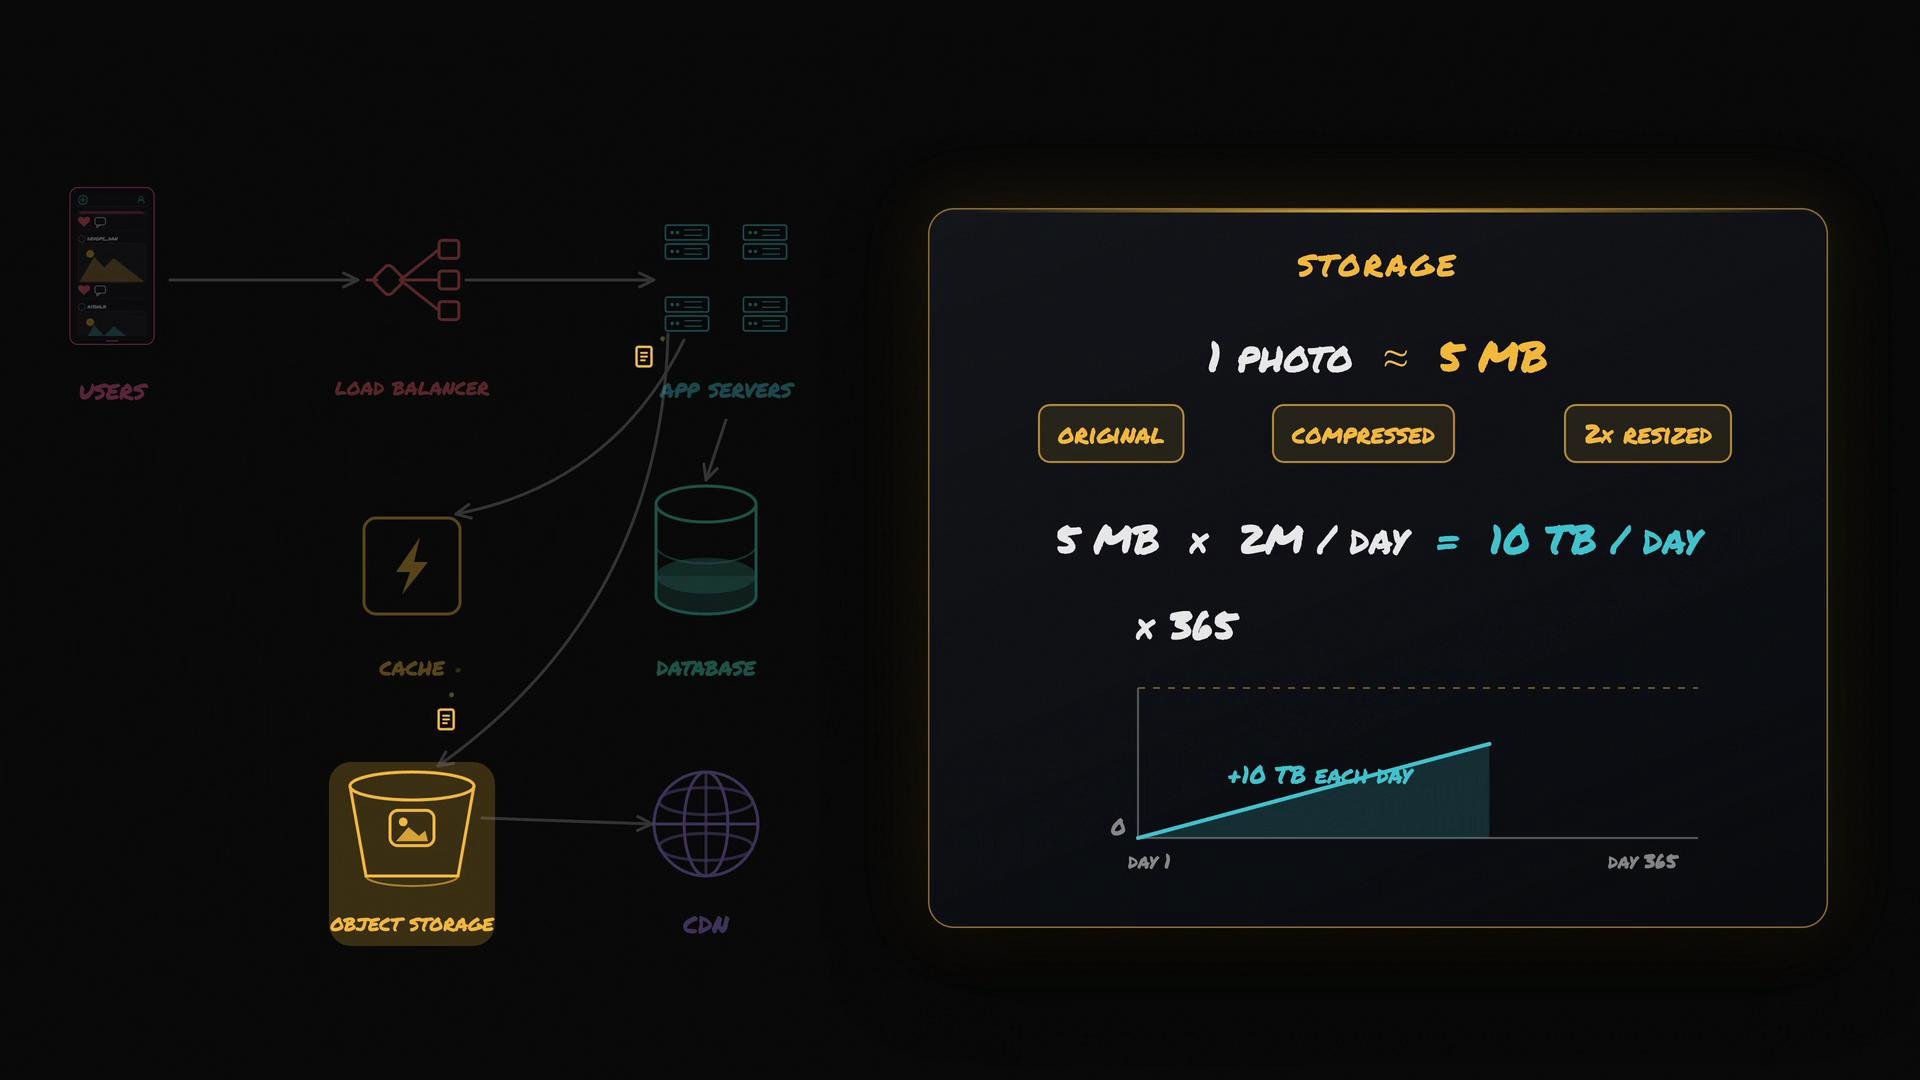
The image shows a diagram of a system architecture involving users, a load balancer, app servers, a cache, a database, object storage, and a CDN. It also includes a calculation of storage requirements, indicating that 2 million photos each of 5 MB size taken daily would result in 10 TB of data per day over a year.
Separate storage of binaries and metadata
The image depicts a system architecture diagram for a photo storage application, showing users, a load balancer, app servers, a cache, a database, object storage, and a CDN. The database only keeps metadata such as caption, timestamp, owner, and file location.
Component sizing — simple assumptions and results Assume:
  • One app server can handle ~500 feed reads/sec (when reads hit cache or are efficiently served).
  • Peak reads to serve = 15,000 r/s
Compute servers required:
  • App servers = 15,000 / 500 = 30
  • Add headroom and redundancy → plan for ≈ 40 app servers
Other sizing and considerations:
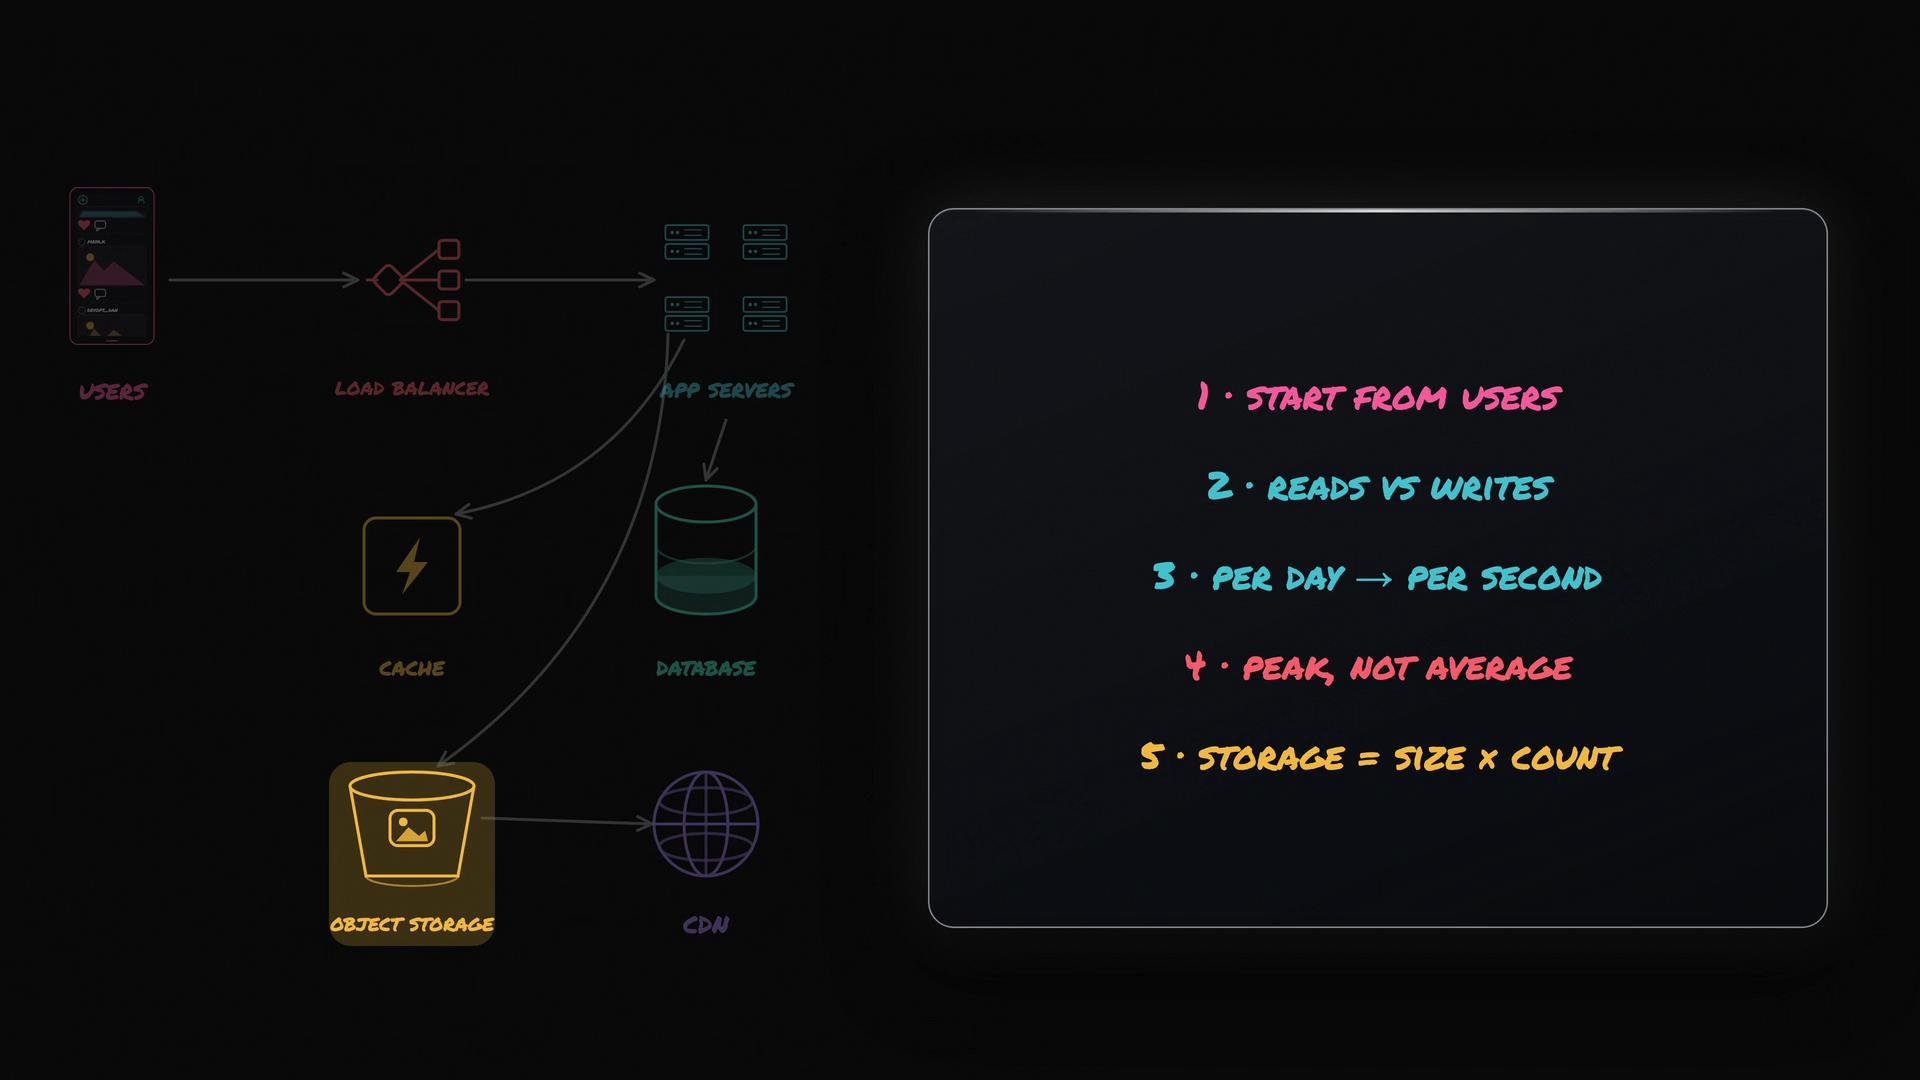
The image shows a system architecture diagram on the left, illustrating the flow from users to various components like load balancer, app servers, database, cache, object storage, and CDN. On the right, there are notes outlining performance considerations, such as starting from users and focusing on peak rather than average metrics.
Checklist: How to approach any back-of-envelope sizing question
  1. Start from user counts and activity assumptions (DAU, opens/day, posts/day).
  2. Separate reads from writes and compute daily totals.
  3. Convert daily totals to per-second averages and then estimate peak (typically 3–5×).
  4. Size compute by dividing peak RPS by throughput per server and add redundancy.
  5. Size storage by item size × items/day × retention window.
  6. Use caches, CDNs, read replicas, and object storage where appropriate — these are often required to meet performance and cost goals.
  7. State assumptions and round aggressively in interview settings. Discuss trade-offs and system bottlenecks.
Useful references
Round numbers and state your assumptions clearly. Interviewers are evaluating your approach and trade-offs more than any single exact number.

Watch Video