Introduction
Kick off an AWS Fault Injection Simulator (FIS) Experiment to validate your system’s resilience under disk saturation conditions. In this demo, we verify application availability and observe key metrics in AWS X-Ray and Amazon EC2.Ensure your IAM role has the necessary FIS permissions and your EC2 instances are tagged for tracing with X-Ray.
1. Verifying Application Availability
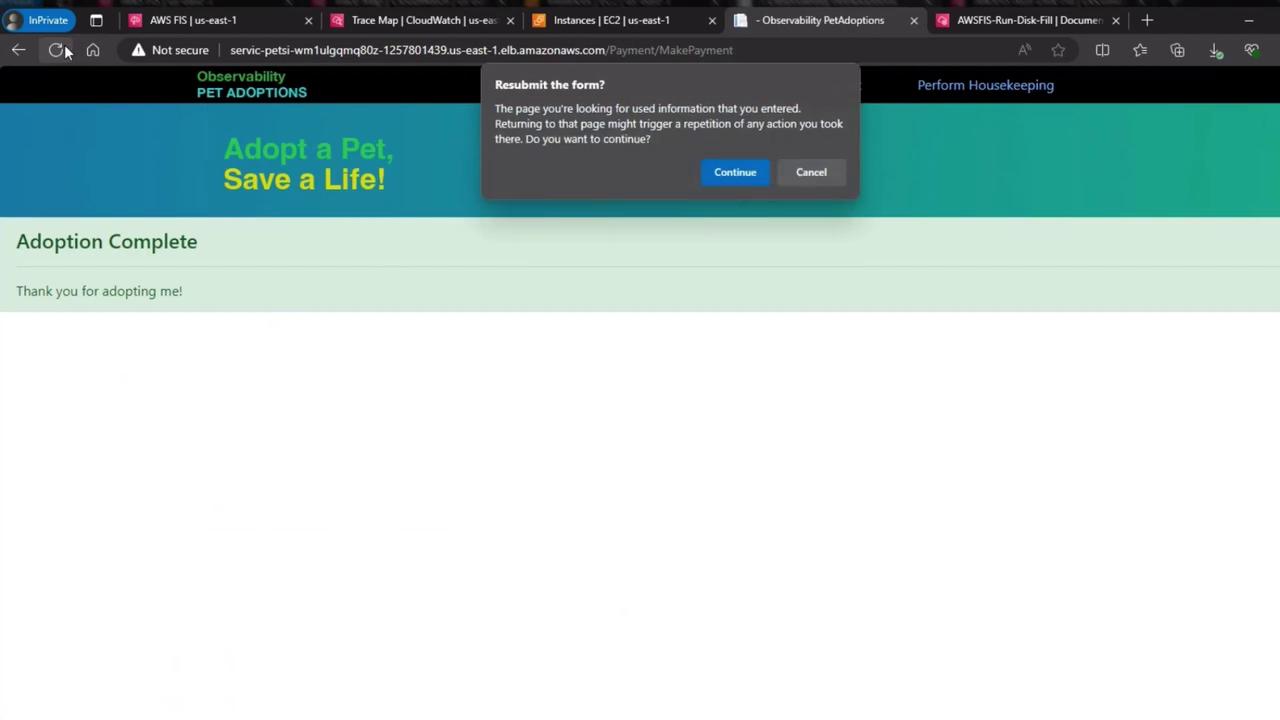
Immediately after triggering the disk fill fault, refresh the web interface to confirm the site remains fully functional:
2. Injecting the Disk Fill Fault
We used the FIS Disk Fill Test to fill up the root volume of instance “fc095”. Our hypothesis: the application remains highly available due to automatic failover.3. Monitoring EC2 Metrics in CloudWatch
Head over to the EC2 dashboard and view the CloudWatch metrics for both instances: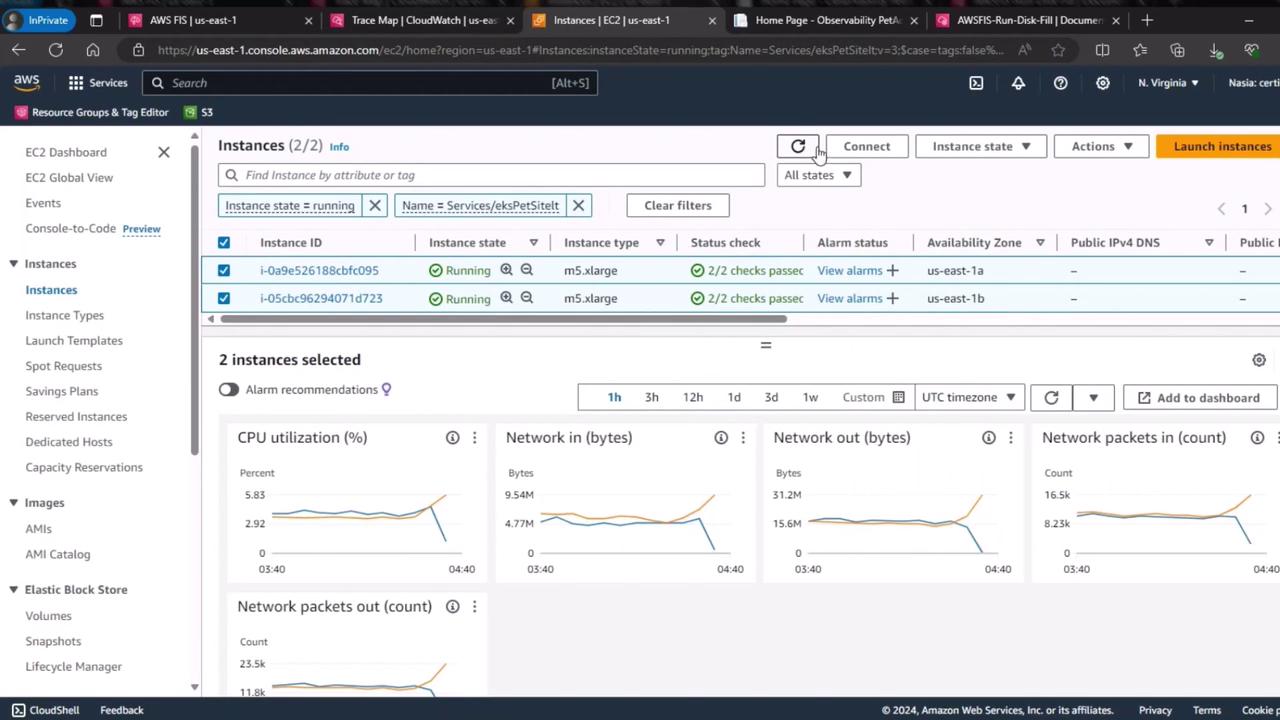
3.1 CPU Utilization
The graph below shows CPU usage over time for both servers. Notice the divergence around 04:30 UTC: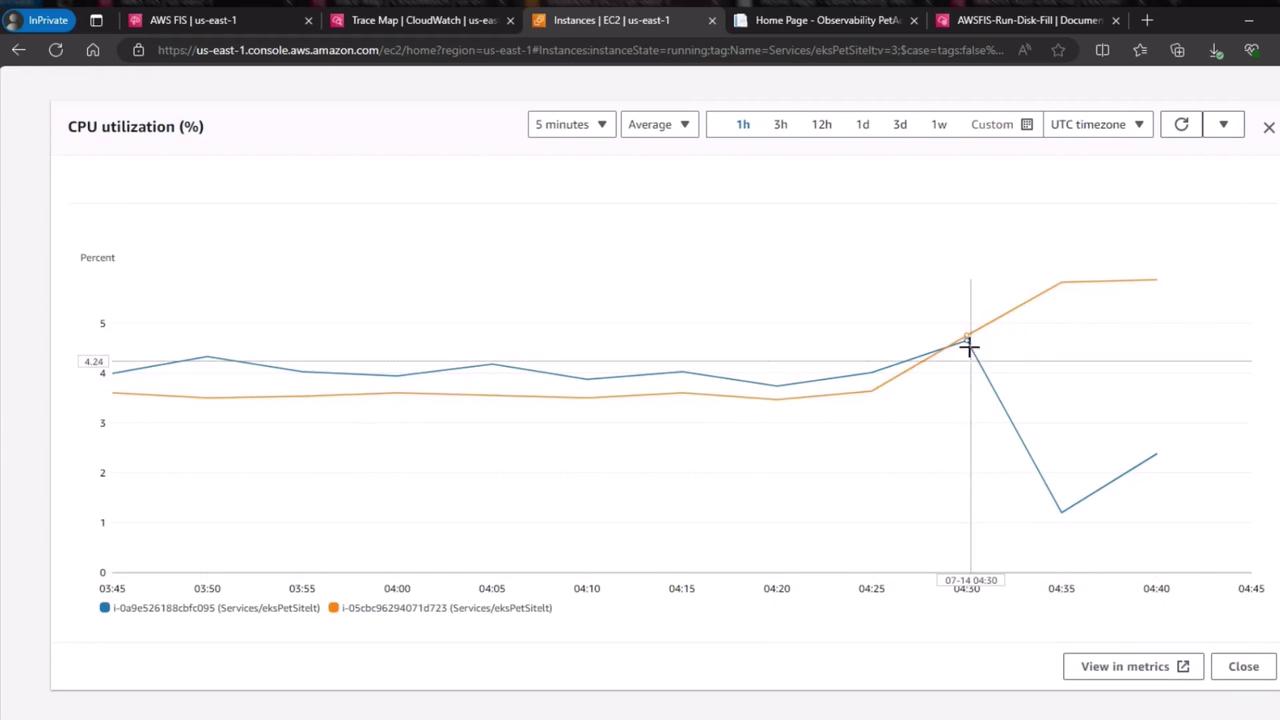
| Instance | Metric Behavior |
|---|---|
| fc095 (disk full) | CPU drops to near zero (idle state) |
| failover node | CPU increases (handling redirected load) |
3.2 Network Out
A similar trend appears in network throughput. The saturated disk instance goes idle, while the standby instance picks up traffic: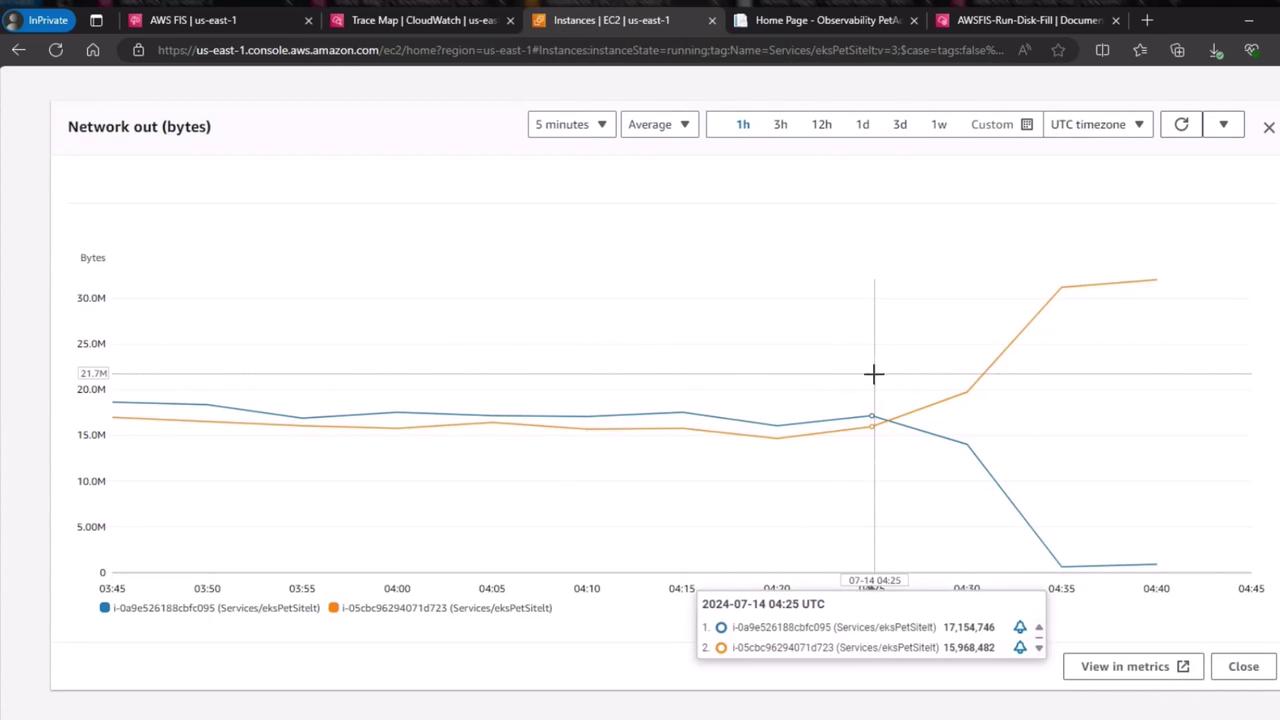
| Instance | Network Out Trend |
|---|---|
| fc095 (disk full) | Drops to ~0 bytes/sec |
| failover node | Spikes as requests are rerouted |
Always test fault injection in a staging environment before applying to production. Disk saturation can lead to data loss if not handled properly.