Before running any FIS experiment, ensure your IAM role has the necessary permissions for AWS FIS, CloudWatch, and X-Ray. Review the AWS FIS documentation for setup details.
1. PetSite Trace Map
We start by examining the X-Ray service map for our PetSite EC2 instance. The average latency rose from roughly 90 ms to 120 ms, and the overall request count declined slightly—evidence that the memory fault impacted service responsiveness.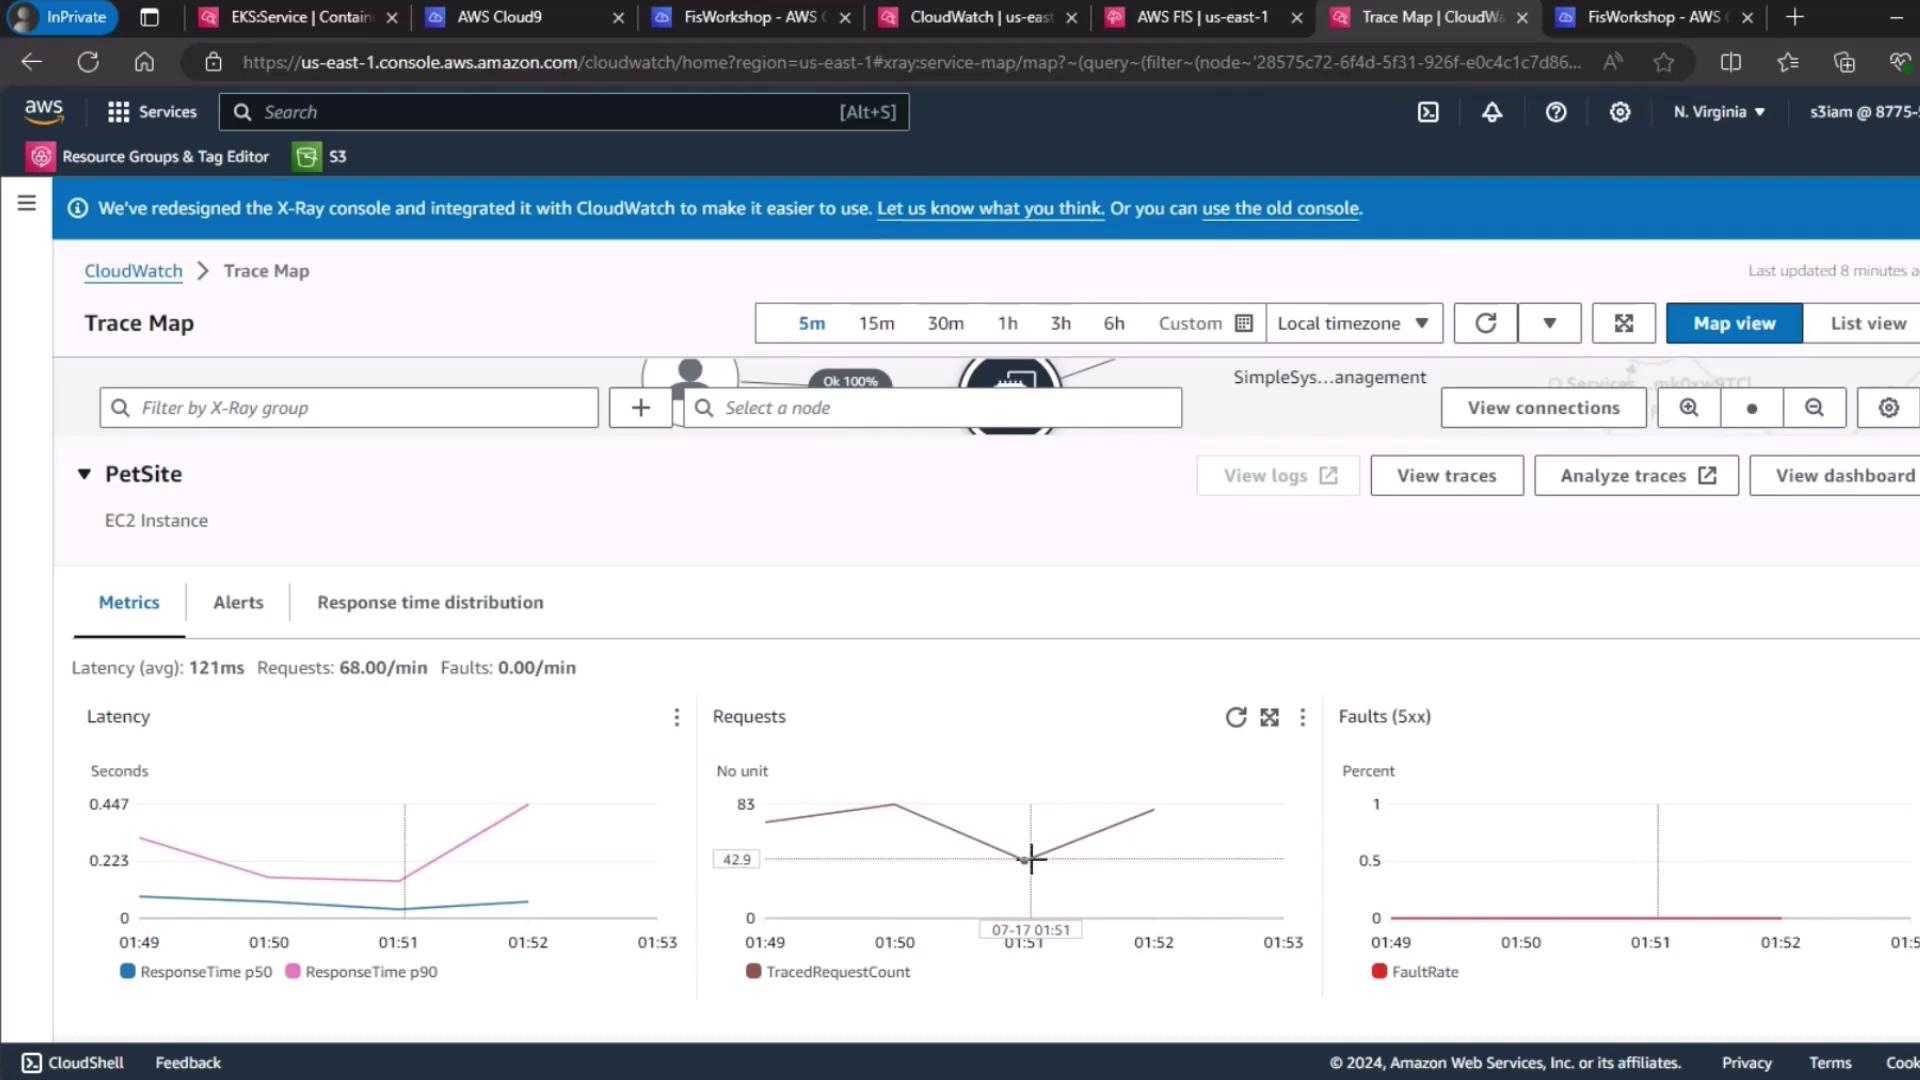
| Metric | Baseline | Under Memory Stress |
|---|---|---|
| Average Latency | ~90 ms | ~120 ms |
| Request Count | Normal | Decreased |
2. Container Insights
Next, we review pod-level resource metrics in CloudWatch Container Insights. The table below summarizes CPU and memory utilization before and during the experiment.| Resource | Baseline Utilization | Under Memory Stress |
|---|---|---|
| CPU Utilization | 0.29 cores | 1.57 cores |
| Memory Usage | Normal | Noticeable increase |
3. Real User Monitoring (RUM)
To assess real-world impact, we analyzed CloudWatch RUM web vitals. The proportion of “frustrating” user experiences inched up from 1.3 % to 1.4 %, still within our acceptable threshold.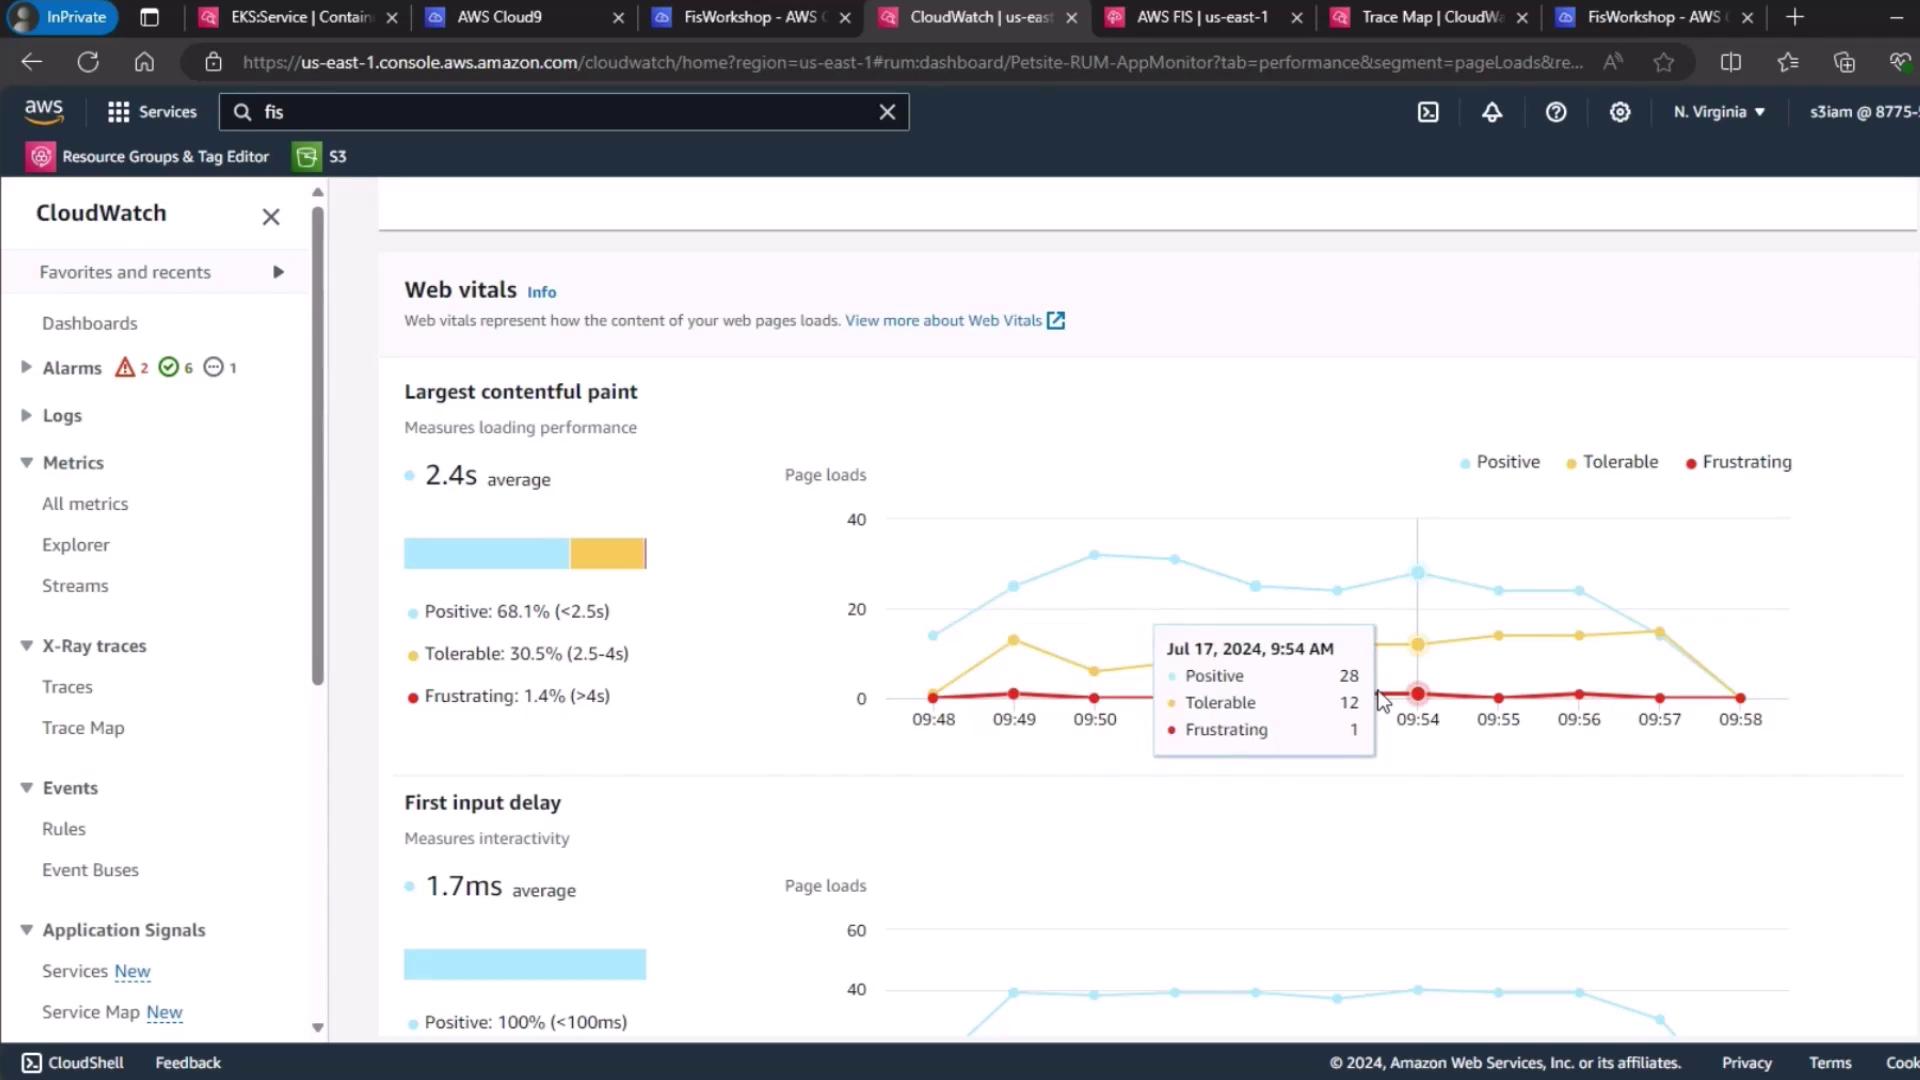
Set your own RUM thresholds based on application SLAs. A small increase in “frustrating” sessions may be acceptable if overall availability remains high.
Conclusion
Despite a clear uptick in latency and resource utilization during the AWS FIS memory stress test, end-user impact remained minimal. This demonstrates the robustness of a well-architected, distributed Kubernetes cluster on Amazon EKS.Links and References
- AWS Fault Injection Simulator (FIS) Documentation
- Amazon EKS Overview
- CloudWatch Container Insights
- AWS X-Ray Developer Guide
- CloudWatch Real User Monitoring (RUM)