

1. Verify Pod Auto-Replacement
After deleting a Pod, Kubernetes should automatically spin up a new one. Run:Kubernetes replaces the deleted
petsite-deployment Pod within seconds, demonstrating built-in self-healing.2. Validate Application Availability & RUM Metrics
Next, confirm the application UI loads without errors and that RUM data in CloudWatch shows no spike in errors or user frustration signals.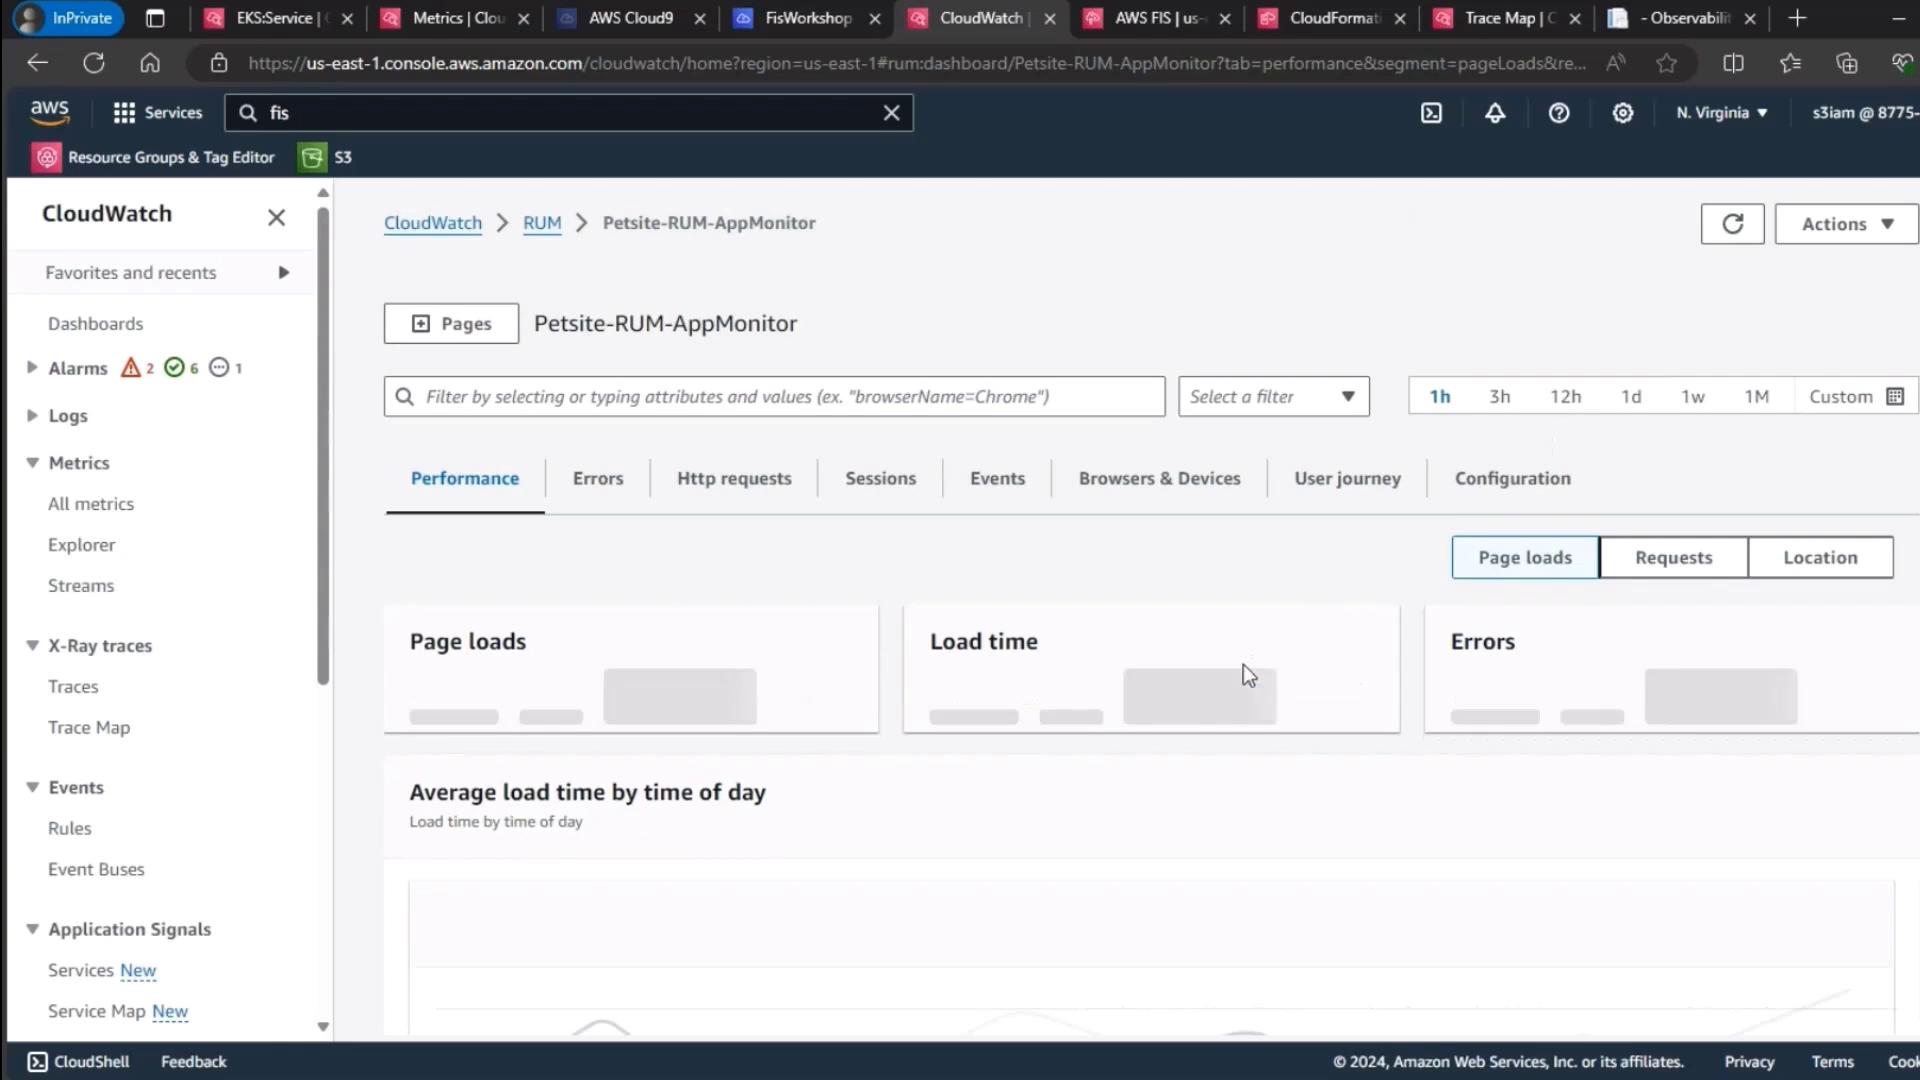
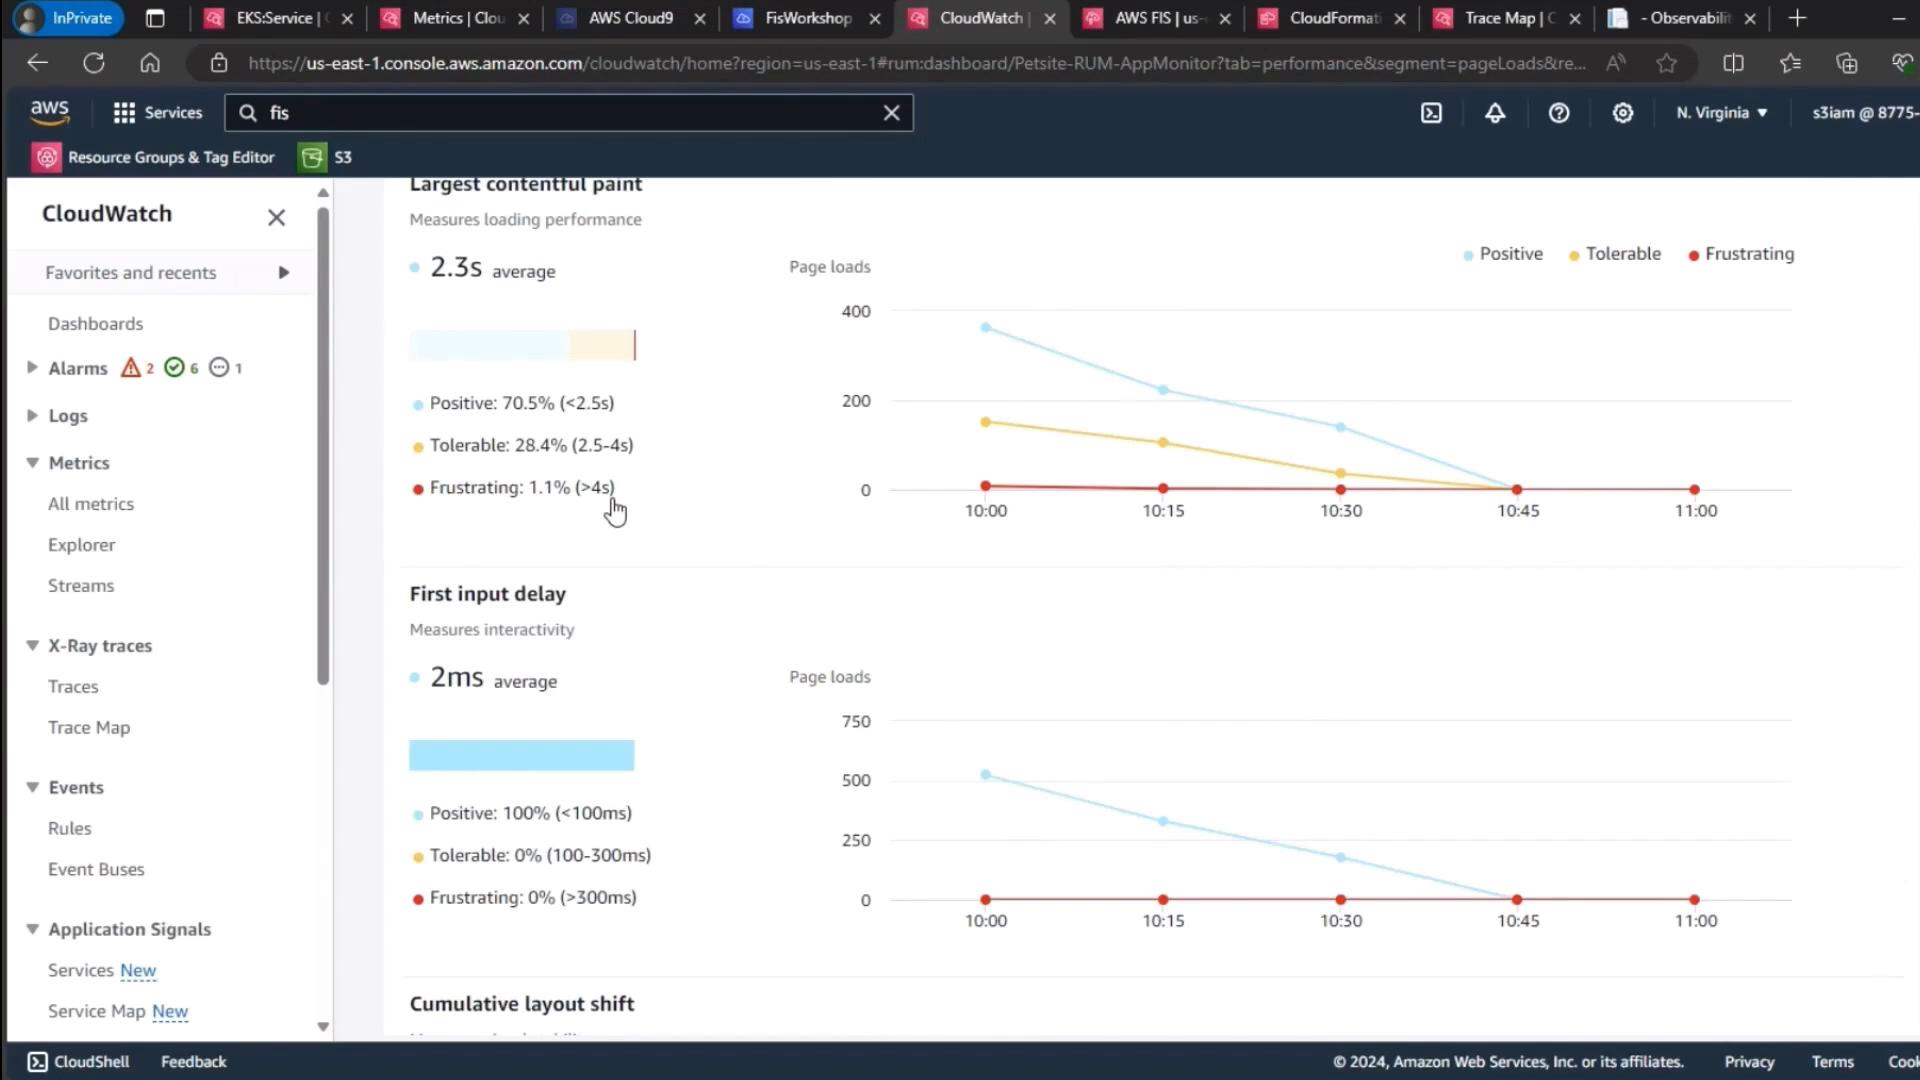
A manual refresh confirms that user frustration signals remain at baseline:
3. Monitor EKS Control Plane Metrics
Finally, review your EKS cluster’s control plane metrics to ensure resource utilization stayed consistent throughout the experiment.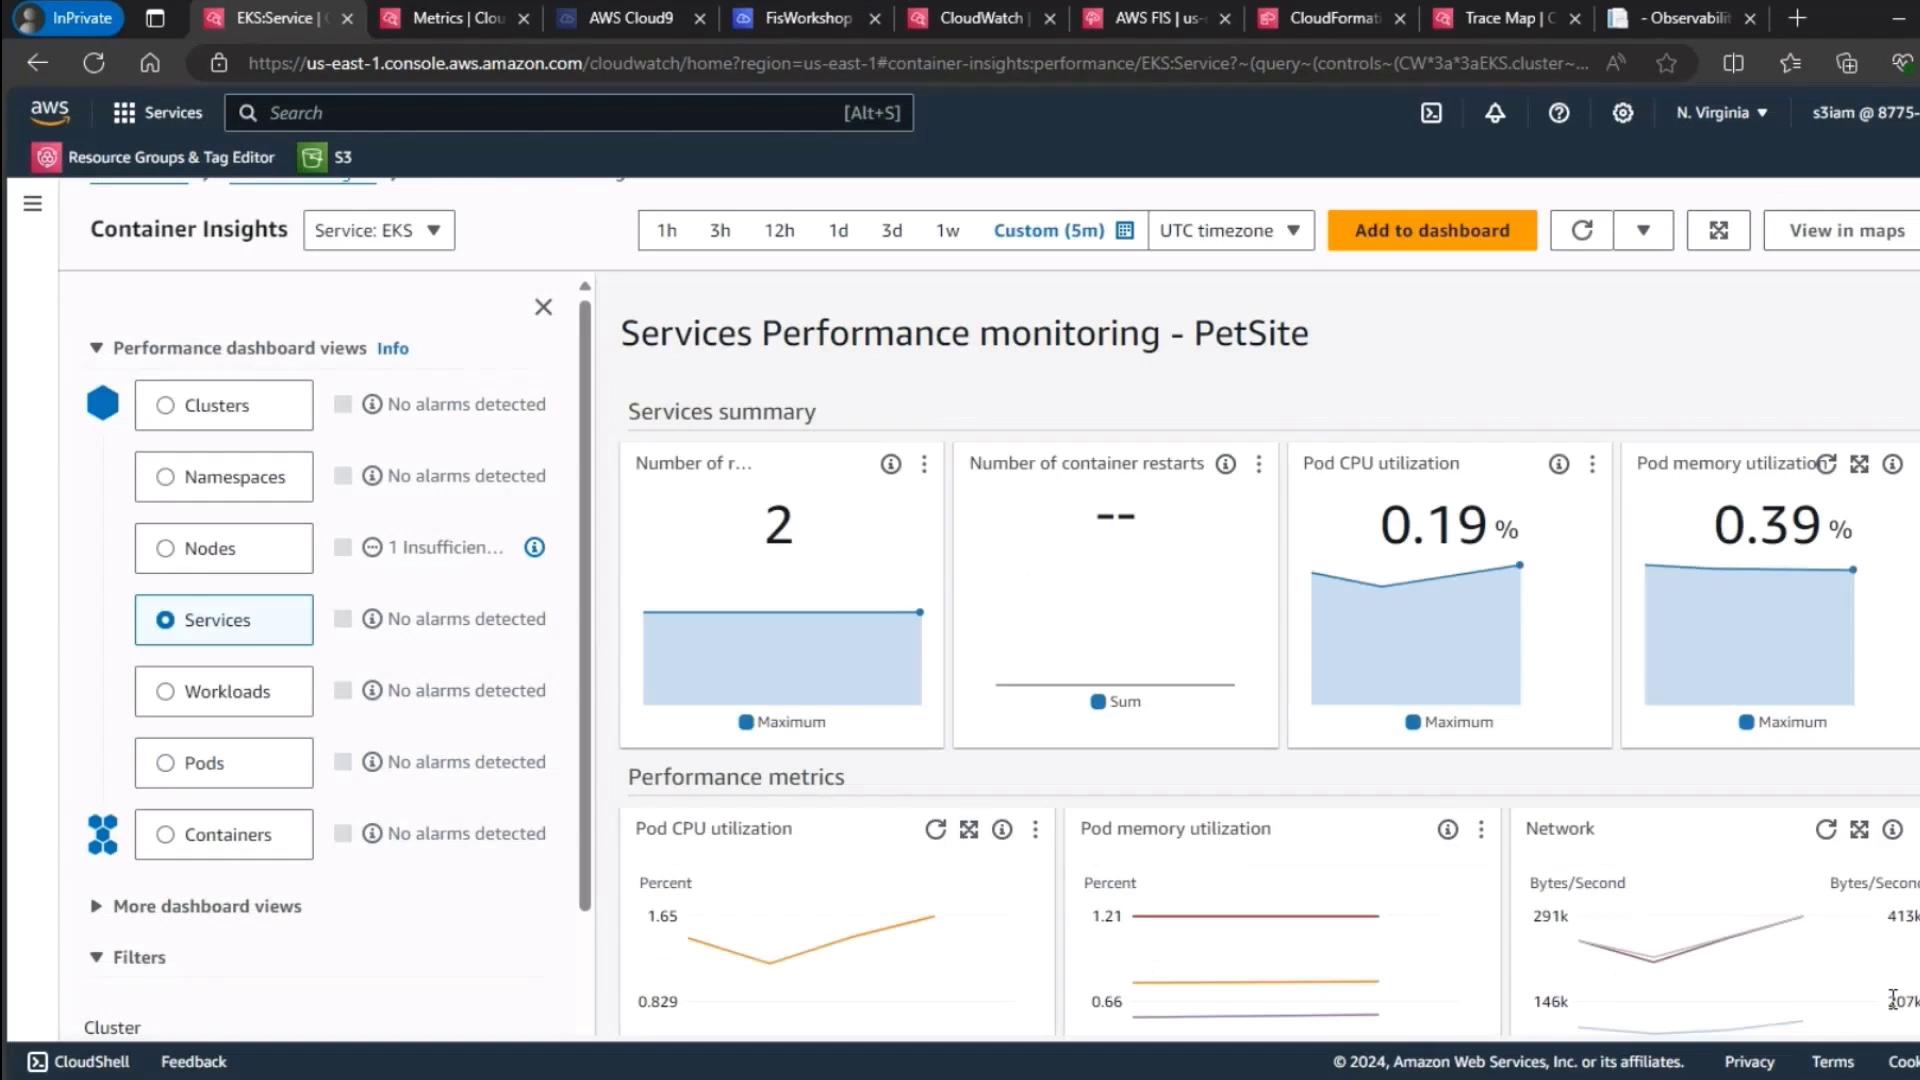
Stable control plane metrics confirm that pod deletion did not adversely affect cluster health.
Conclusion
This demo highlights Kubernetes’ resilience on Amazon EKS:- Self-healing: Deleted Pods are recreated almost instantly.
- Zero user impact: No UI errors or RUM spikes.
- Stable cluster health: Control plane metrics remain steady.