

1. Real User Monitoring (RUM)
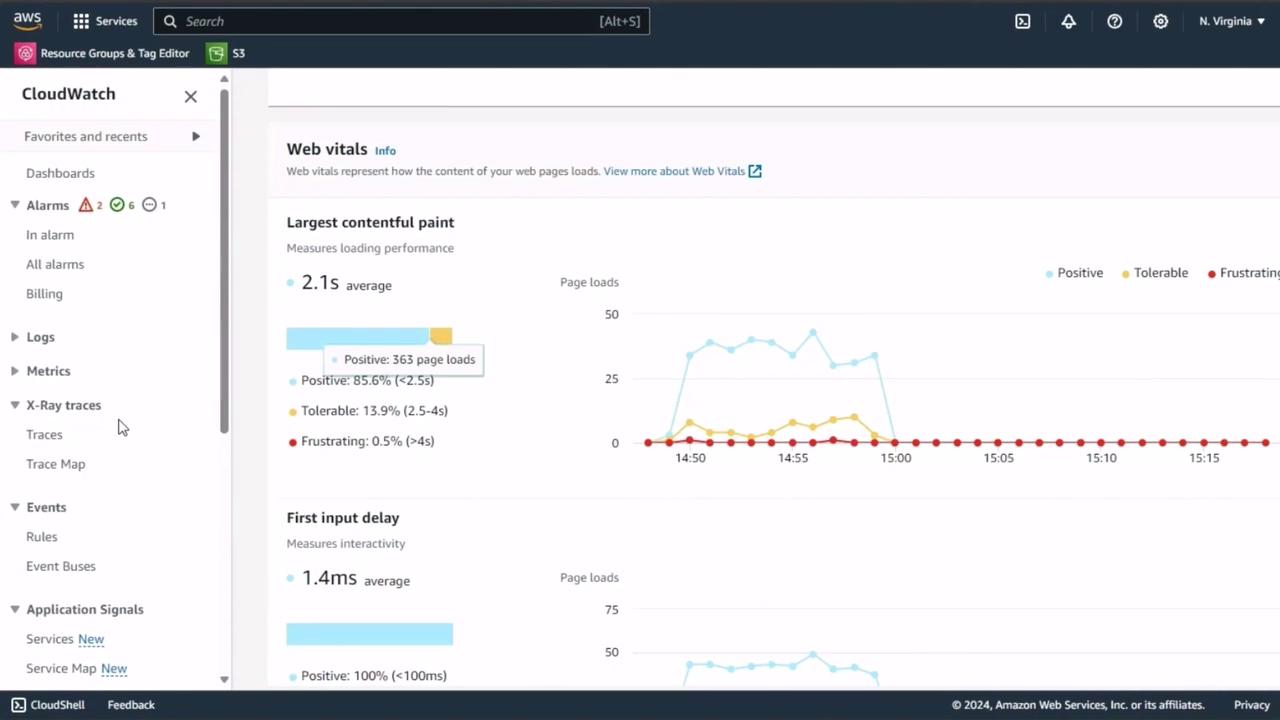
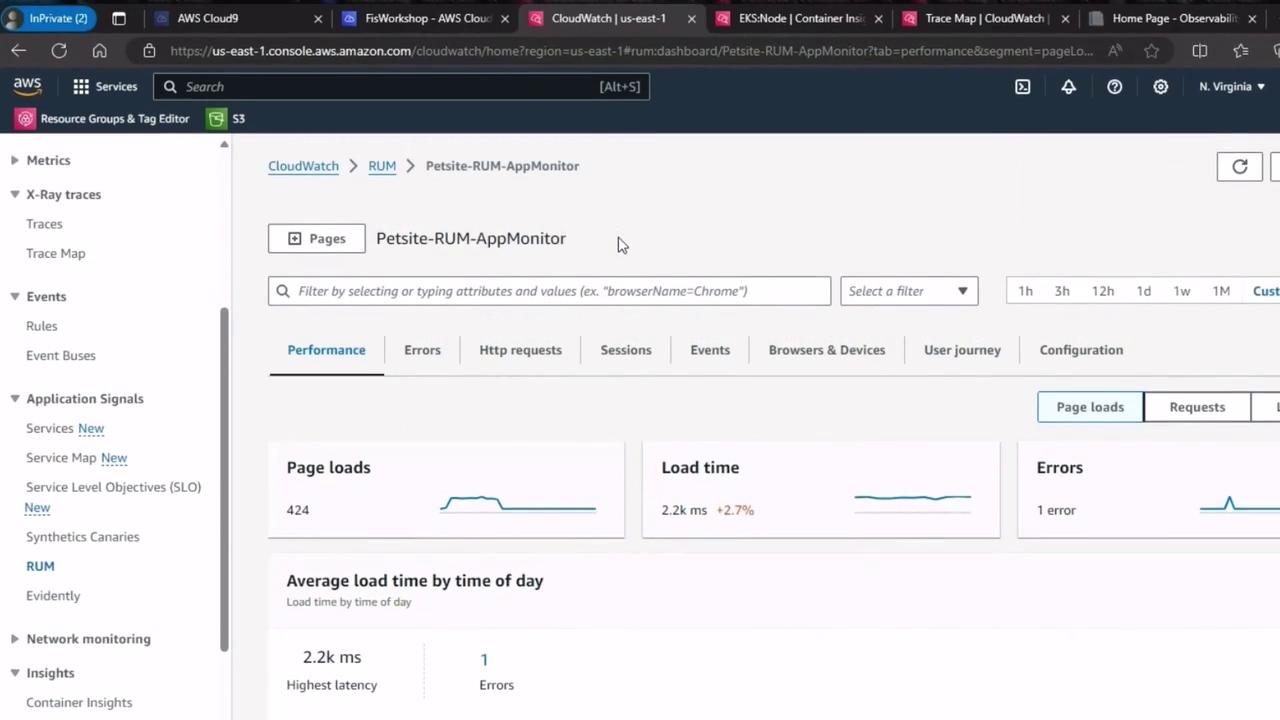
CloudWatch RUM collects key browser metrics from actual users, helping you understand page-load performance and interactivity. We’ve enabled RUM on our homepage; let’s examine the dashboards.Ensure RUM is configured on all critical user flows to gather representative web vitals.
2. CloudWatch Container Insights for Amazon EKS
Switch to Container Insights in the CloudWatch console and select EKS Performance Monitoring. You can filter metrics by nodes, namespaces, pods, or containers.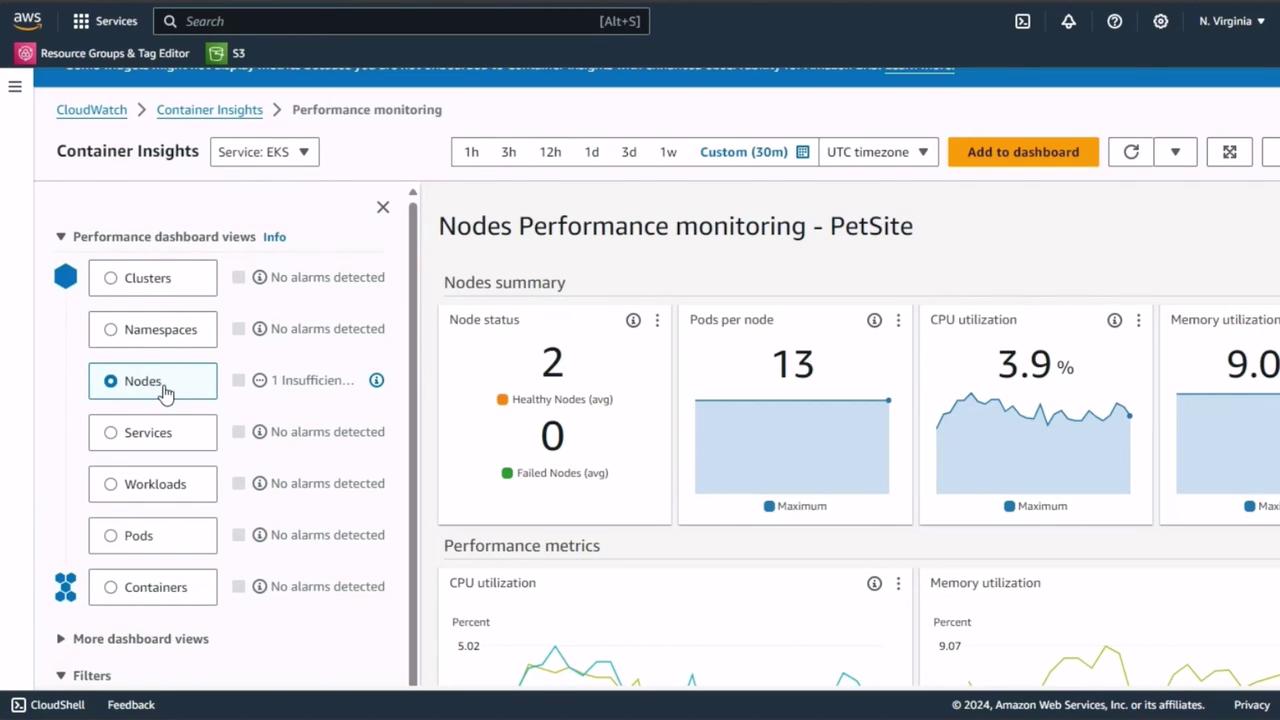
3. AWS X-Ray Trace Map
AWS X-Ray offers end-to-end request tracing across services such as EC2, Lambda, and API Gateway. Use the trace map to pinpoint latency hotspots and error sources.Trace sampling needs to be set appropriately. Over-sampling can increase costs, while under-sampling may hide critical issues.
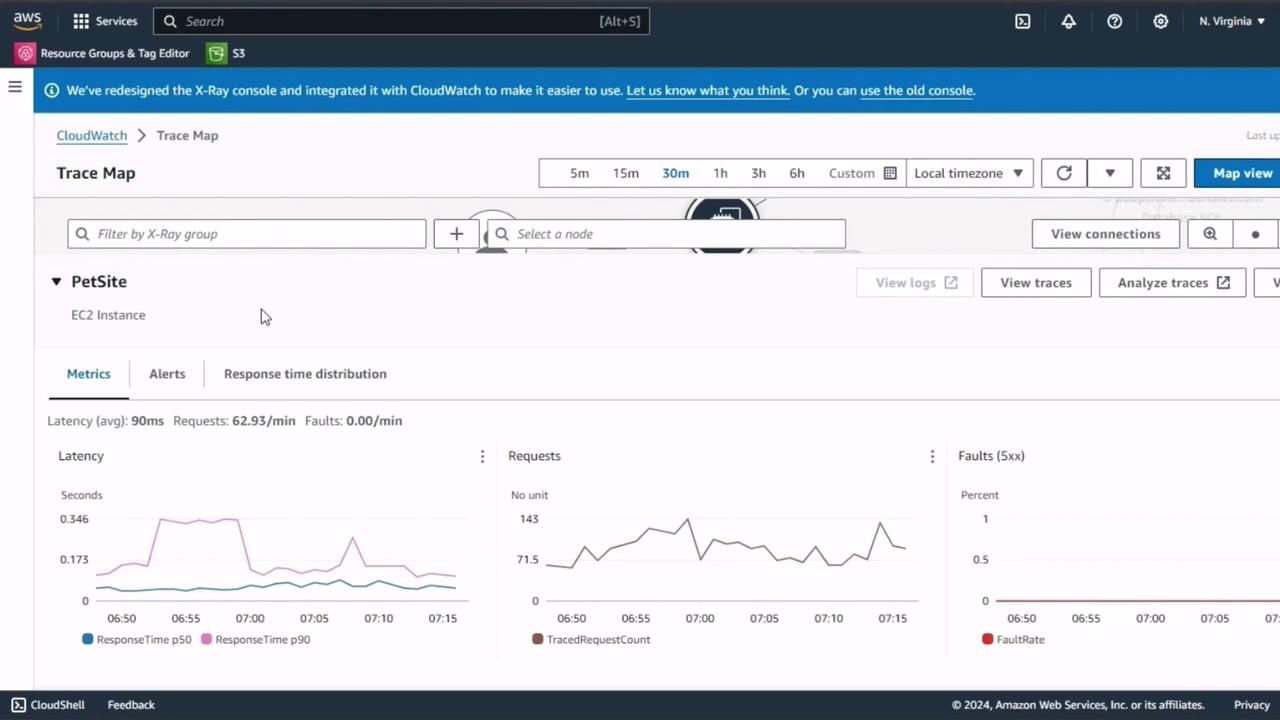
By capturing steady-state metrics from CloudWatch RUM, Container Insights, and X-Ray, you’ll have a robust performance baseline. Use these figures to compare against results after injecting faults, ensuring you can accurately gauge the resilience and reliability of your application.
Links and References
- AWS CloudWatch RUM
- Container Insights in CloudWatch
- AWS X-Ray Developer Guide
- Chaos Engineering on AWS