

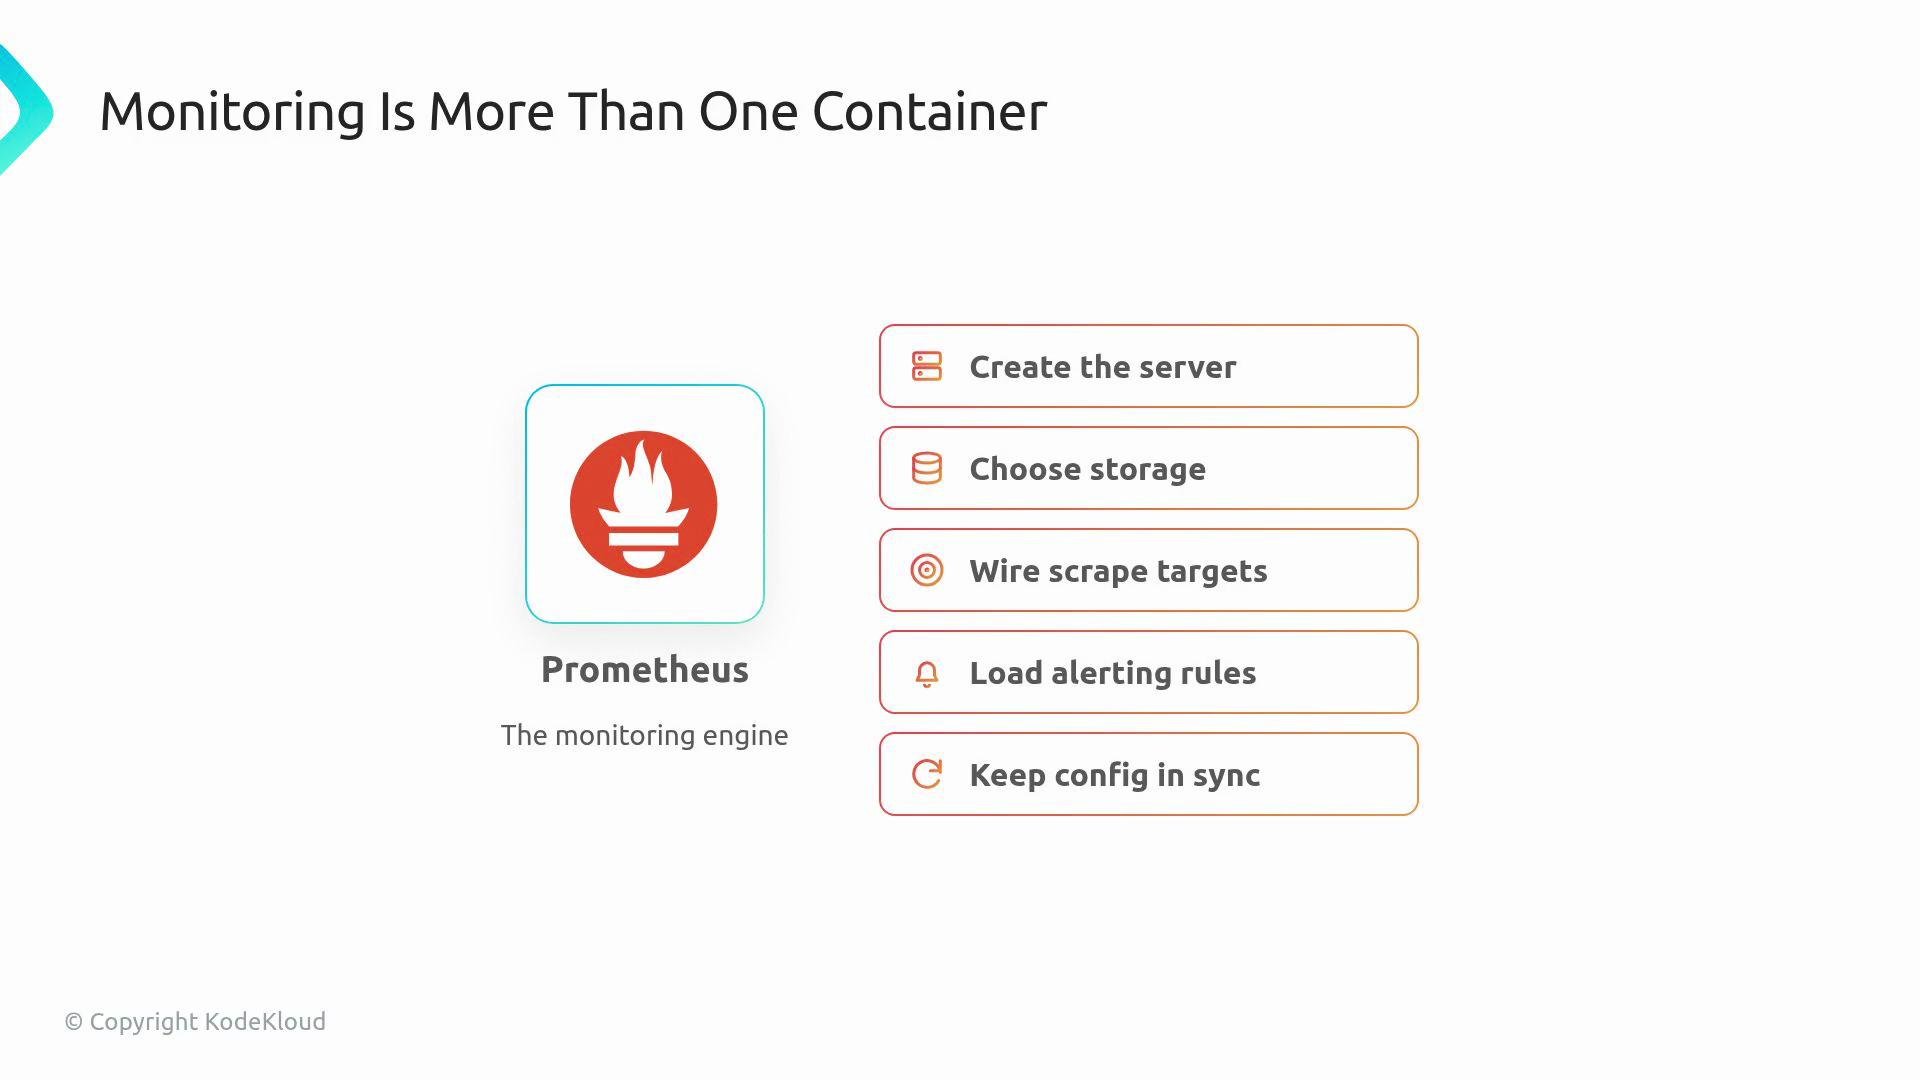
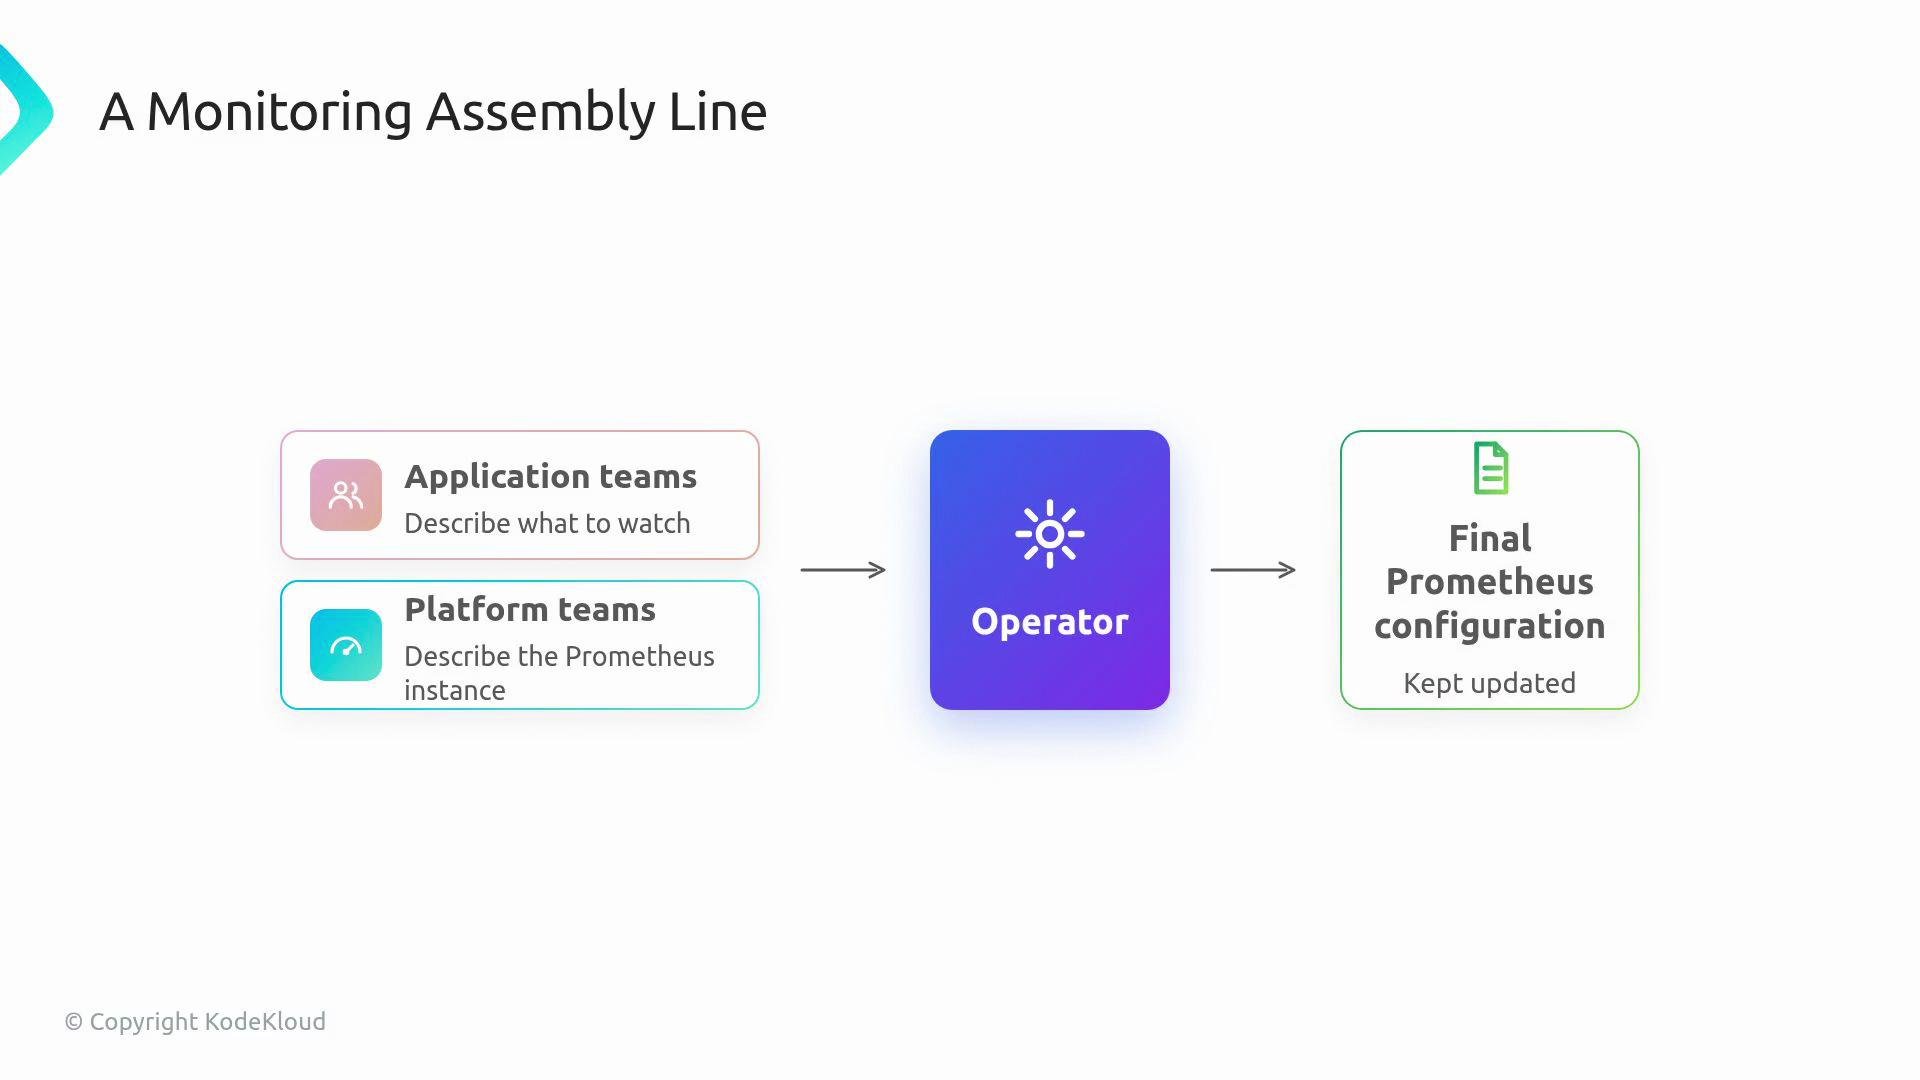
- Application teams express what should be monitored (monitoring intent).
- Platform teams define Prometheus instances that will do the scraping and alerting.
- The operator composes those inputs into a final Prometheus runtime configuration (prometheus.yml, StatefulSets, Services, ConfigMaps, Secrets) and keeps them in sync.
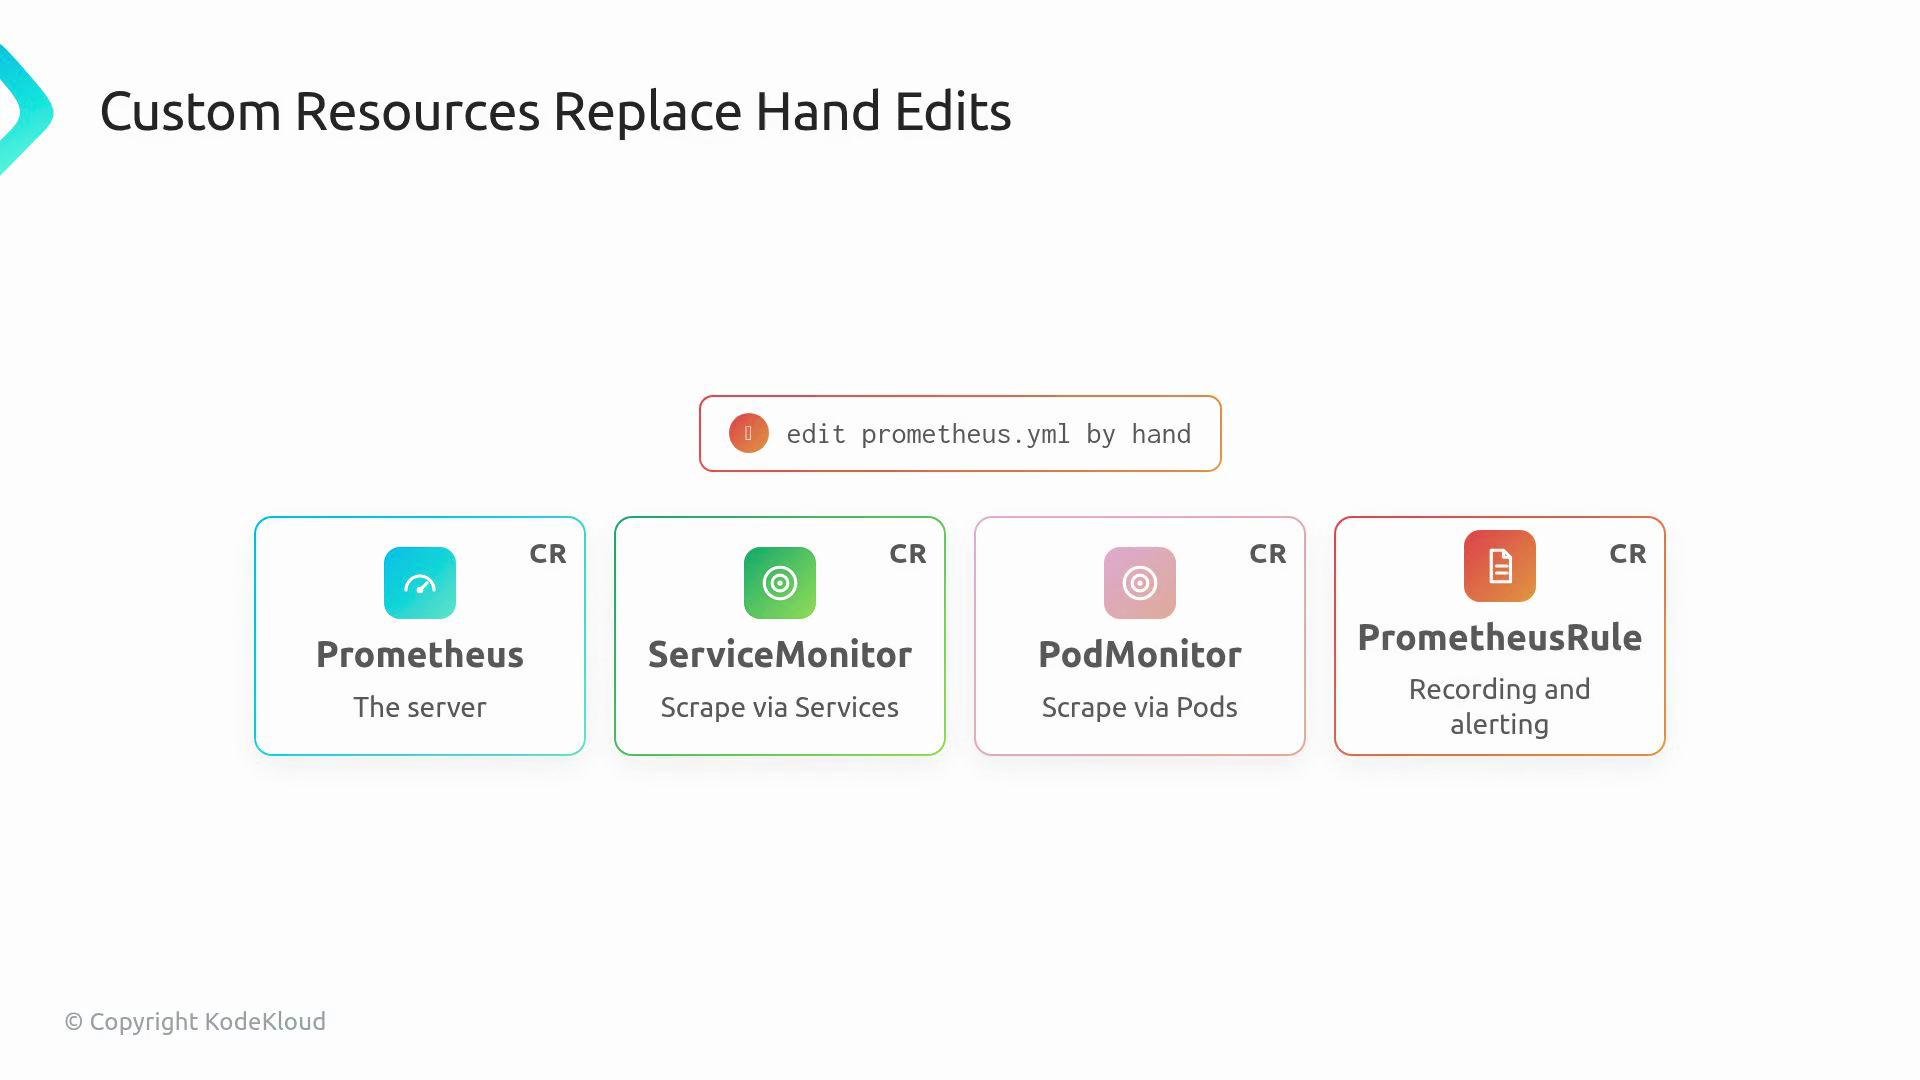
Key custom resources (CRDs)
Example: ServiceMonitor
A ServiceMonitor lets application teams publish monitoring intent as Kubernetes objects. The operator discovers matching ServiceMonitors and includes them in the generated Prometheus configuration.Example: Prometheus resource with selectors
Platform teams use the Prometheus CR to define a Prometheus instance and scope which monitoring objects it ingests. Use label selectors to enforce clear ownership boundaries across teams.How selectors and ownership work
A Prometheus resource uses selectors to determine which ServiceMonitors, PodMonitors, and PrometheusRules belong to it. This model supports multi-tenant or shared clusters by scoping ingestion to labeled resources:- Platform teams create one or more Prometheus instances and configure selectors.
- Application teams label their ServiceMonitors/PodMonitors/PrometheusRules to indicate ownership.
- The operator discovers matching objects and includes them in the generated Prometheus configuration.
team: payments) to make ownership and intent explicit across your organization.
Operator responsibilities and reconciliation
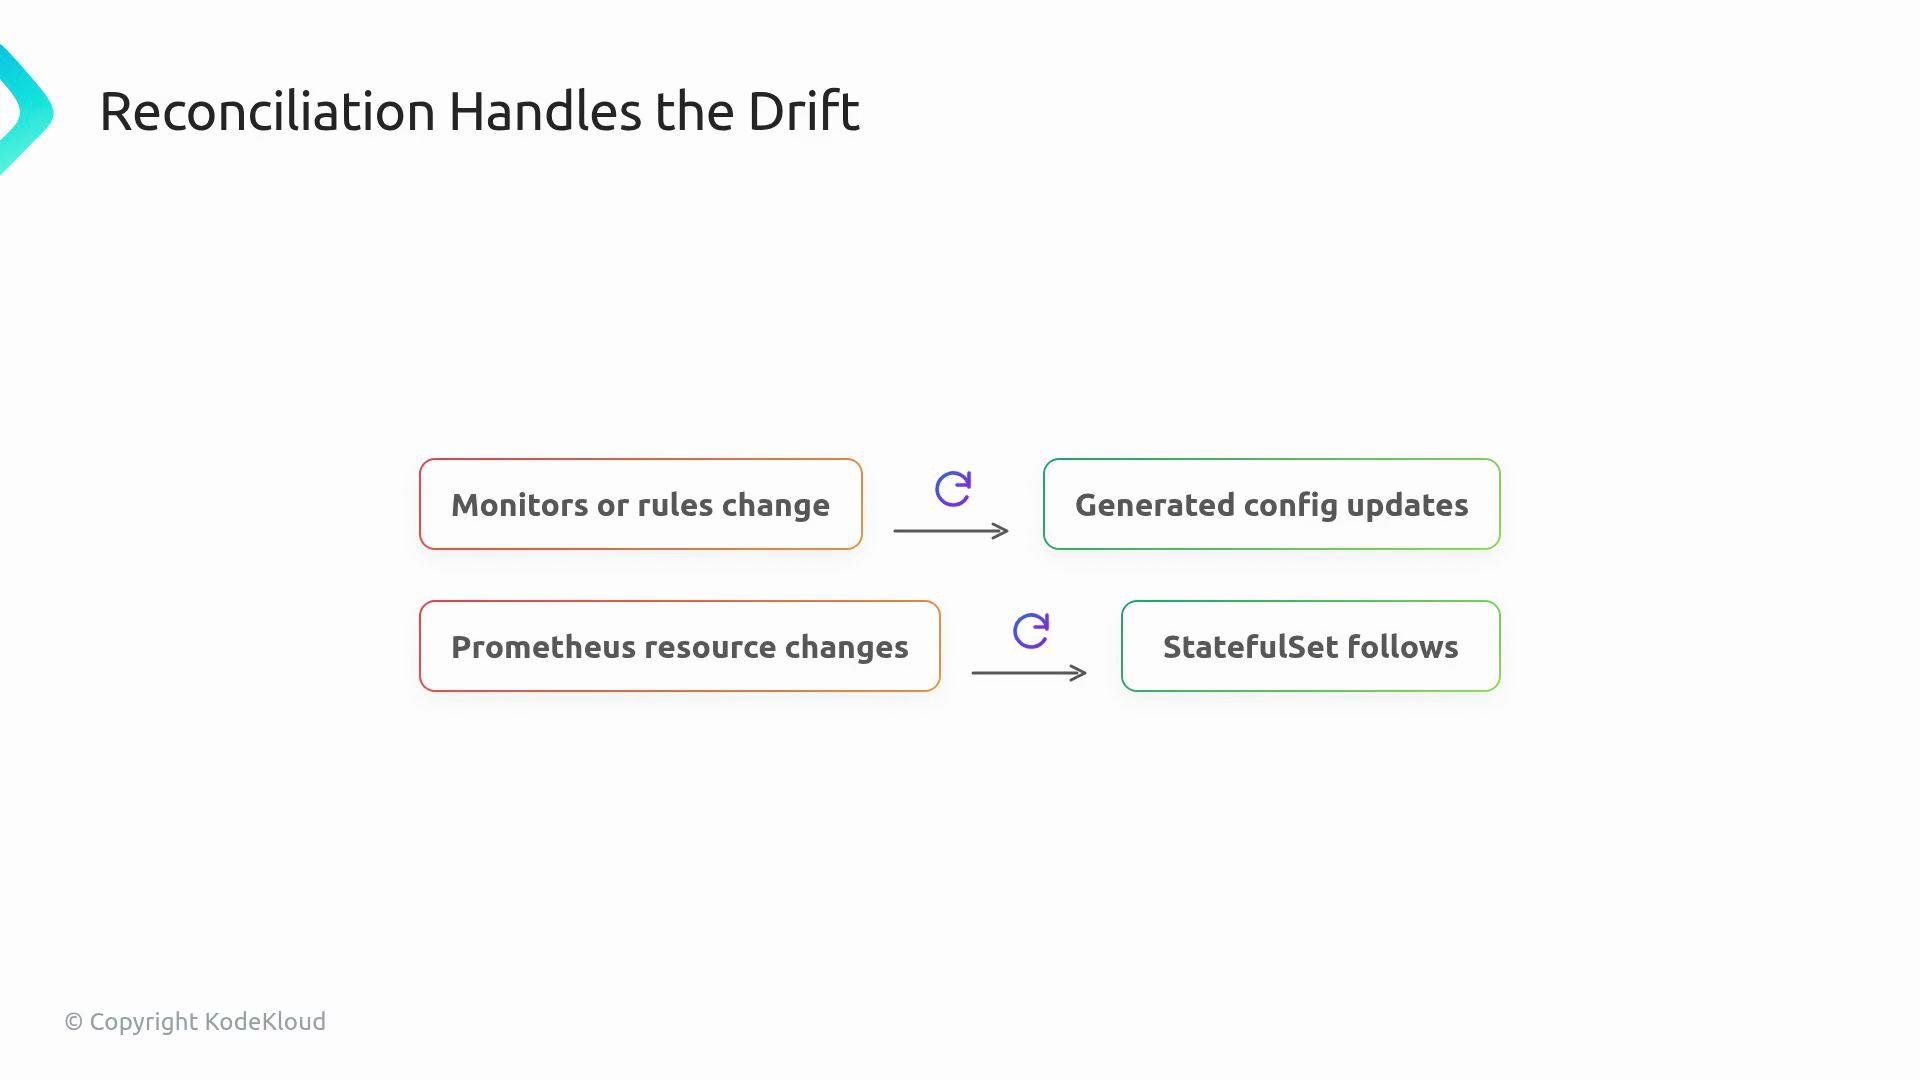
The Prometheus Operator handles lifecycle details that are error-prone when done manually:- When selected ServiceMonitors or PrometheusRules change, the operator regenerates the Prometheus configuration and triggers a reload.
- When the Prometheus custom resource changes, the operator updates the managed StatefulSet and related resources so the running server matches the desired state.
- The controller continuously reconciles discrepancies (drift) instead of relying on manual reloads or human memory.
Deployment patterns and ecosystem
In production clusters, the Prometheus Operator is frequently installed as part of a broader monitoring stack (for example, using Helm charts) that includes:- Prometheus servers
- Alertmanager
- Grafana
- Prometheus exporters
- Dashboards and default alerting rules
Selectors in the Prometheus resource control which monitoring objects a Prometheus instance will ingest. Use labels and selectors to enforce clear ownership boundaries in shared clusters.
Links and references
- Prometheus Operator (GitHub): https://github.com/prometheus-operator/prometheus-operator
- Prometheus documentation: https://prometheus.io/docs/introduction/overview/
- Alertmanager: https://prometheus.io/docs/alerting/latest/alertmanager/
- Helm charts and packaging: https://helm.sh/
- Kubernetes concepts (labels & selectors): https://kubernetes.io/docs/concepts/overview/working-with-objects/labels/