

Common root causes
Most slow queries fall into a few predictable categories:- Missing or wrong indexes
- Application-layer N+1 query patterns
- Inefficient joins and
SELECT *usage - Outdated statistics, bad planner estimates, or inappropriate join orders
Missing indexes
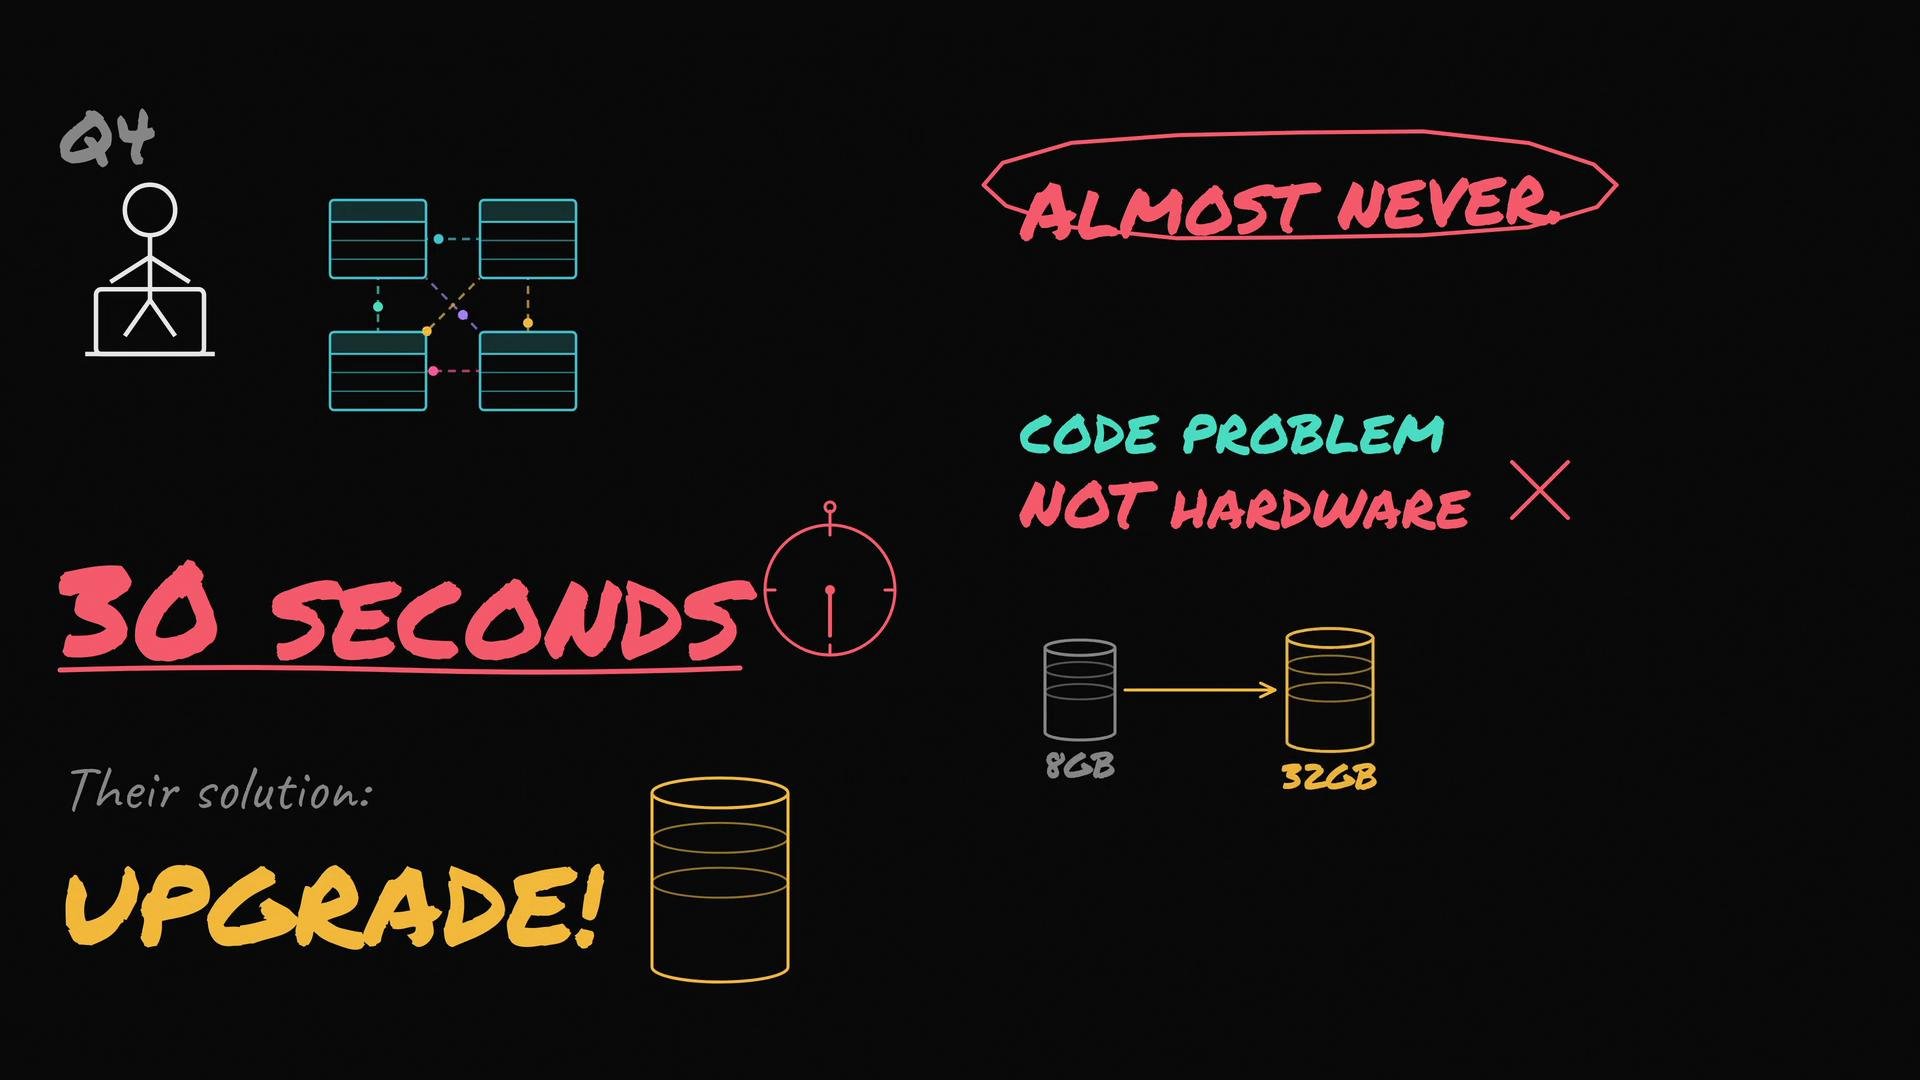
This is the number-one culprit. Without an index, a database may scan millions of rows instead of reading a handful — like flipping through every page of a phone book instead of using the alphabetical tabs. A single well-placed index can turn 30 seconds into tens of milliseconds.
The N+1 problem
This is an application-layer issue. Example pattern:- Your code fetches 100 users.
- Then it runs a separate query for each user’s orders.
- Result: 101 round trips (1 + 100) when a single join or a batched query could return everything in one round trip.
Bad joins and SELECT *
A multi-table join isn’t inherently slow. The problem arises when:- You join on non-indexed columns, causing full scans.
- You fetch every column with
SELECT *when you only need a few fields (wasted I/O and CPU). - The planner chooses an expensive join order or hash join because statistics are stale.
What to do (practical checklist)
Always run the query planner/executor to see what the database is actually doing before making changes.
Step 1 — Run EXPLAIN / EXPLAIN ANALYZE
This is non-negotiable. Use the RDBMS’s explain facility to see the chosen plan and actual runtime stats.- PostgreSQL:
EXPLAIN ANALYZE <query>;(addBUFFERSfor I/O stats) - MySQL:
EXPLAIN FORMAT=JSON <query>;and considerANALYZE TABLEto refresh stats - SQL Server: Use the Actual Execution Plan
Step 2 — Add the right indexes
- Index columns used in
WHERE,JOIN,GROUP BY, andORDER BY. - Use composite indexes for multi-column filters. Create them in the column order the query uses (leading-column matters).
- Avoid indexing every column — unnecessary indexes increase write cost and storage.
- Consider covering indexes if the index can satisfy the entire query without touching the table.
Step 3 — Fix the application layer
- Replace lazy-loaded per-row queries with eager loading or explicit joins.
- Batch requests (e.g.,
WHERE id IN (...)) instead of issuing one query per item. - Implement pagination or streaming for large result sets rather than reading everything into memory.
When to consider additional hardware
Only after you’ve exhausted query, schema, and configuration fixes should you consider scaling or specialized systems.- Use read replicas to offload reporting/read-heavy workloads — they protect the primary but don’t fix a bad query.
- For heavy analytics over very large datasets, consider OLAP systems (e.g., Redshift, BigQuery, ClickHouse).
- Tune database configuration (work_mem, shared_buffers, effective_cache_size, etc.) and ensure statistics are current (
ANALYZE/ autovacuum working).
Do not use larger instances to hide slow queries. Upgrading hardware without addressing the root cause is expensive and temporary.