

Common issue categories
Group the problem into one of three common categories — this speeds diagnosis and points you toward the right tools.
Understanding the category helps you apply the right diagnostic steps.
1) Connection problems
Connection problems often stem from firewall rules, corporate proxies, VPNs, or restrictive network policies that prevent the extension from reaching GitHub’s backend.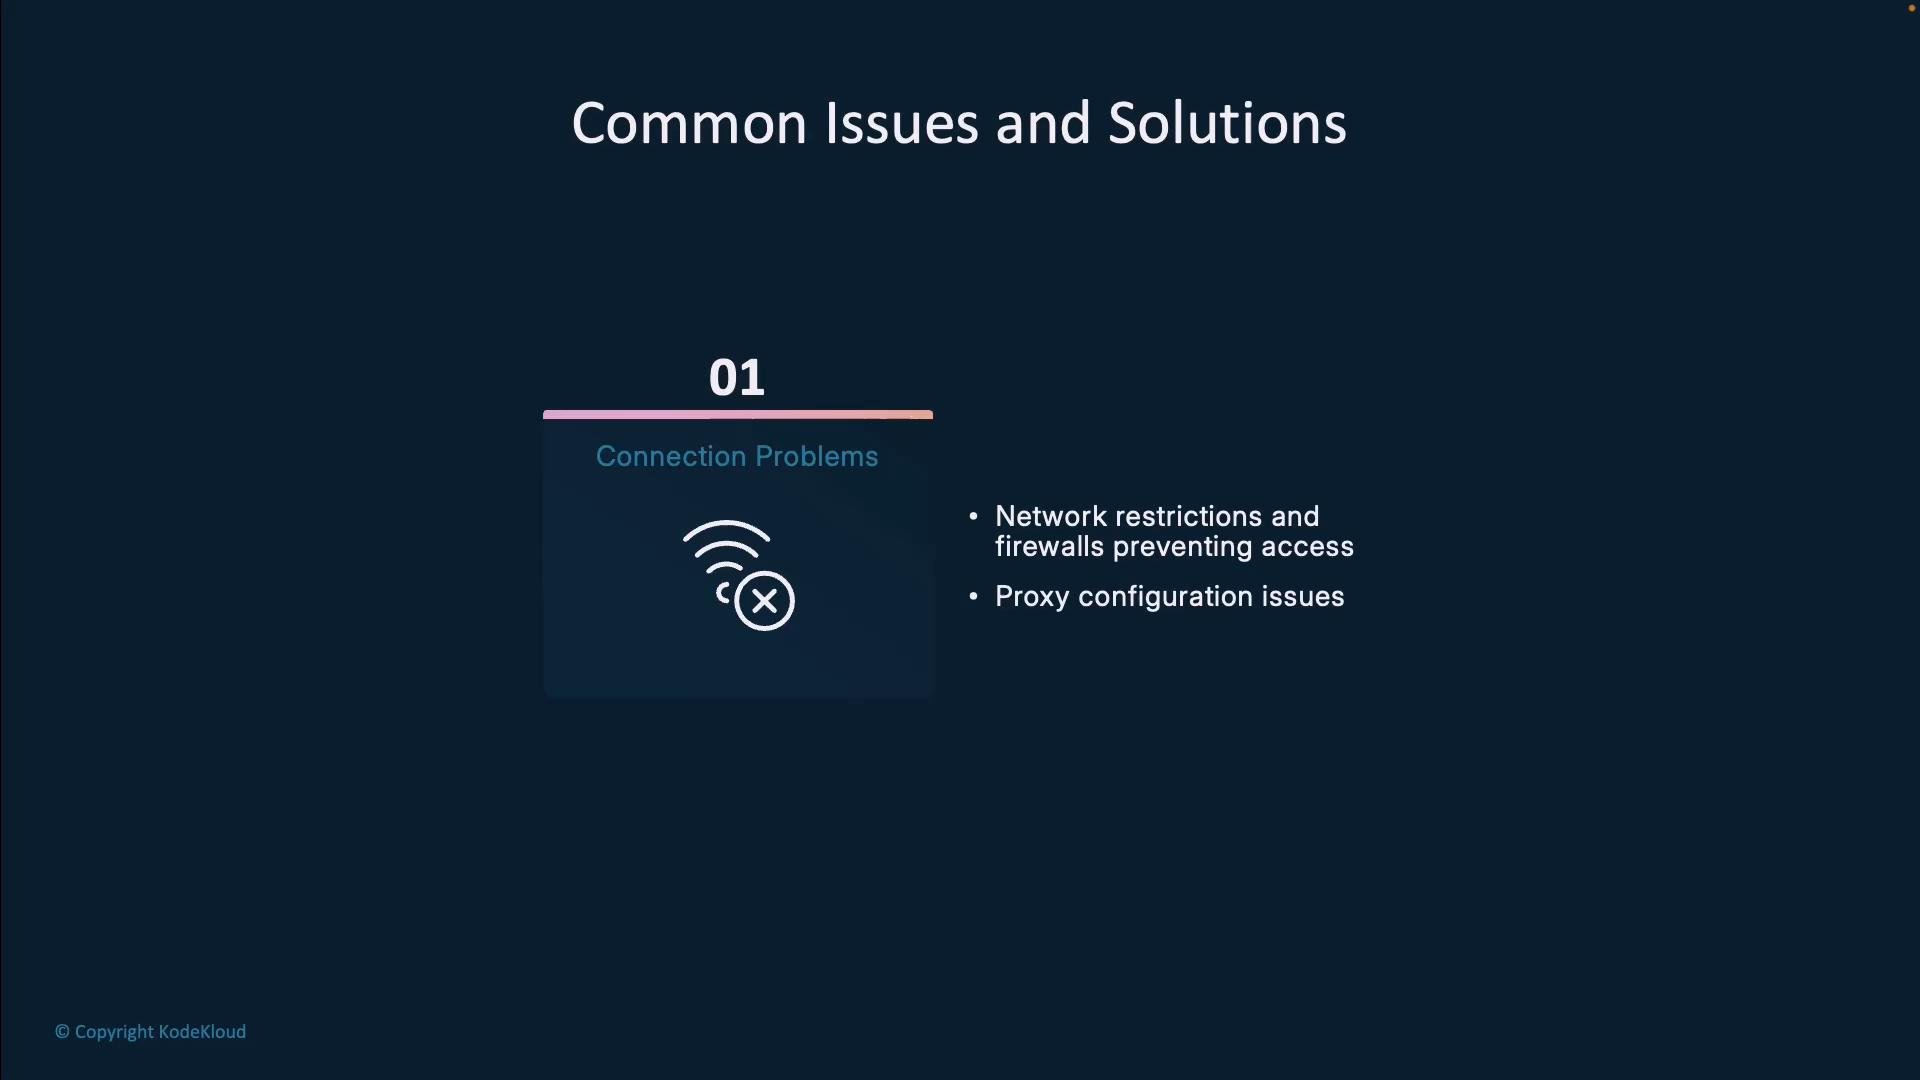
- Verify basic network connectivity (web browsing, DNS resolution).
- Confirm proxy settings in the IDE and OS are correct.
- Check corporate firewall or security appliances for blocked domains/IPs.
- Attempt to access the service endpoints from the machine (curl or browser) if allowed by policy.
- Temporarily disable VPNs or corporate proxies (if permitted) to isolate the cause.
2) Extension functionality issues
If Copilot seems installed but is not suggesting code or behaves inconsistently, the issue is often local to the editor or the extension.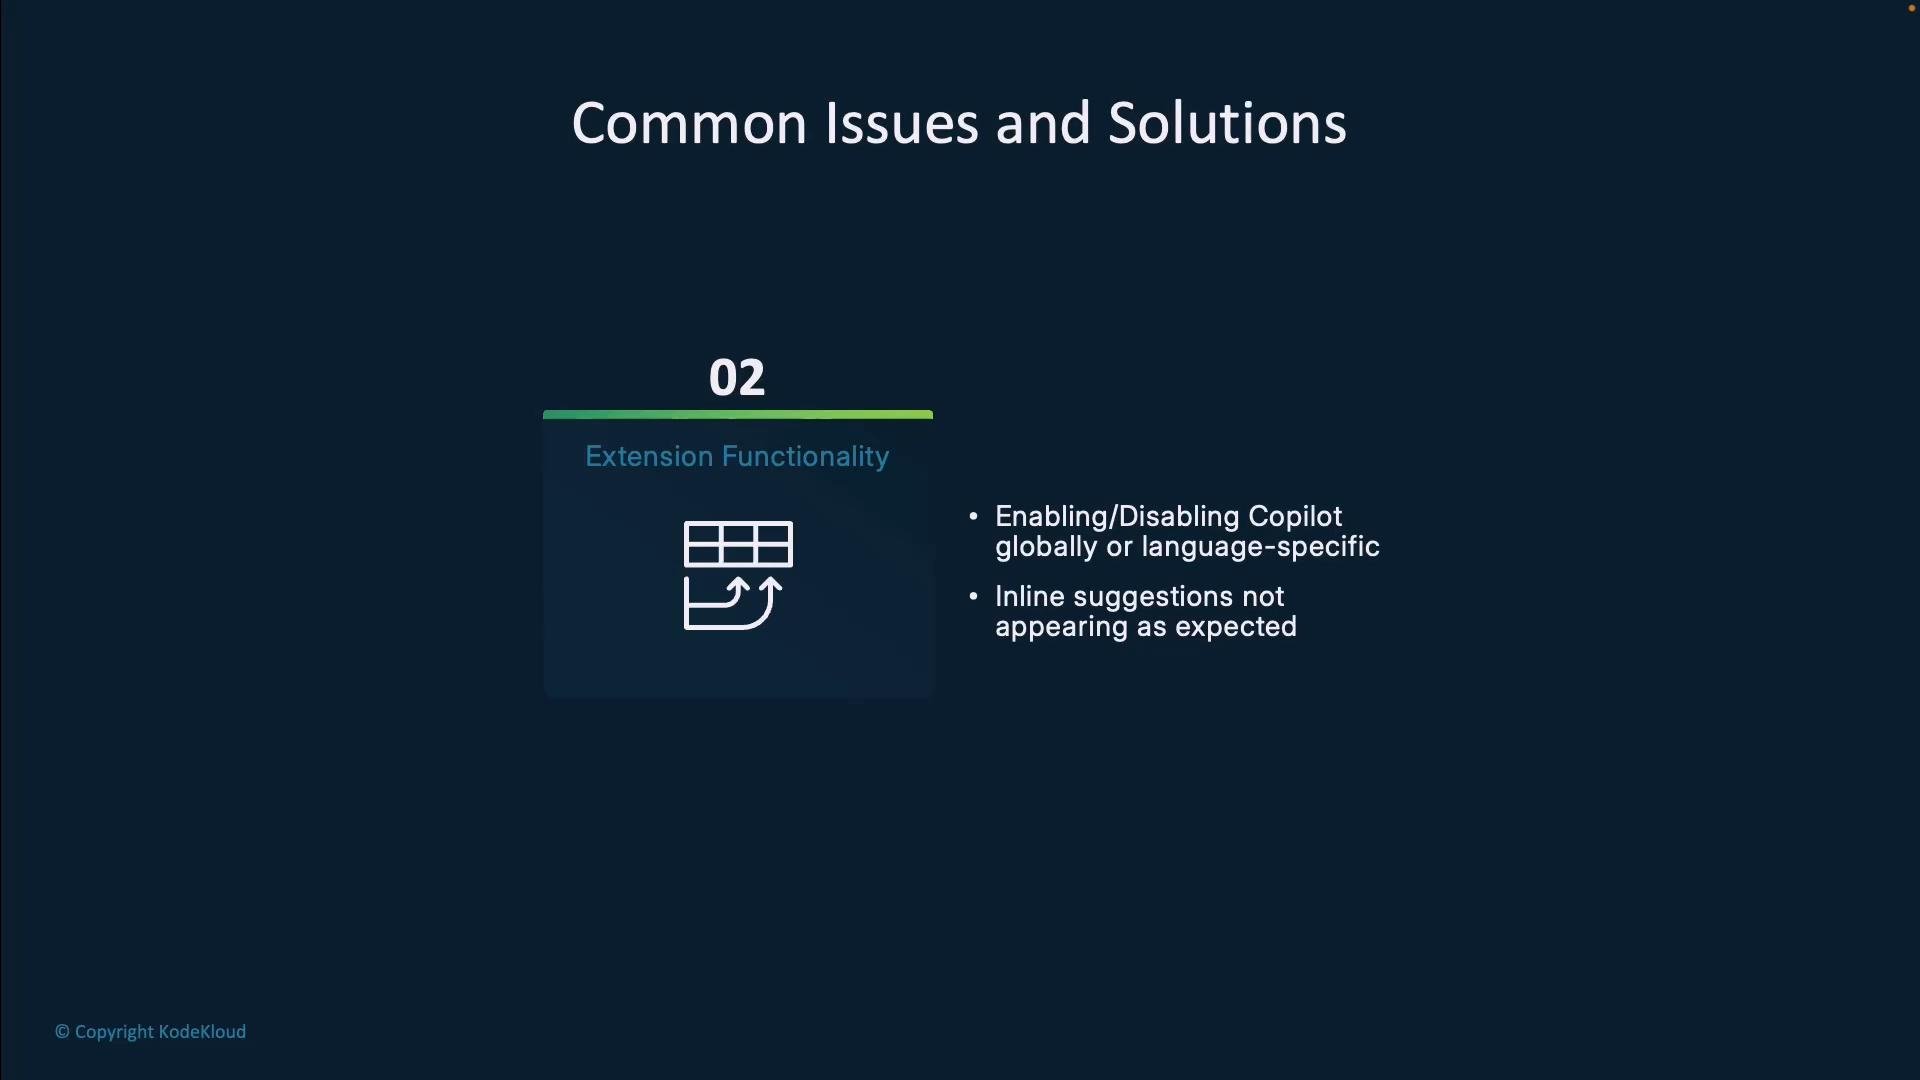
- Confirm the Copilot extension is installed and enabled (check both global and workspace scopes).
- Verify inline suggestions/completions are turned on in your editor settings.
- Look for conflicting extensions that may block or override suggestions (disabling them temporarily can help isolate).
- Restart the editor after toggling settings or reinstalling the extension.
- For language-specific issues, ensure language support (extensions/parsers) is active for that file type.
3) Authentication challenges
Authentication or subscription verification problems occur when the IDE cannot authorize the user or determine subscription status.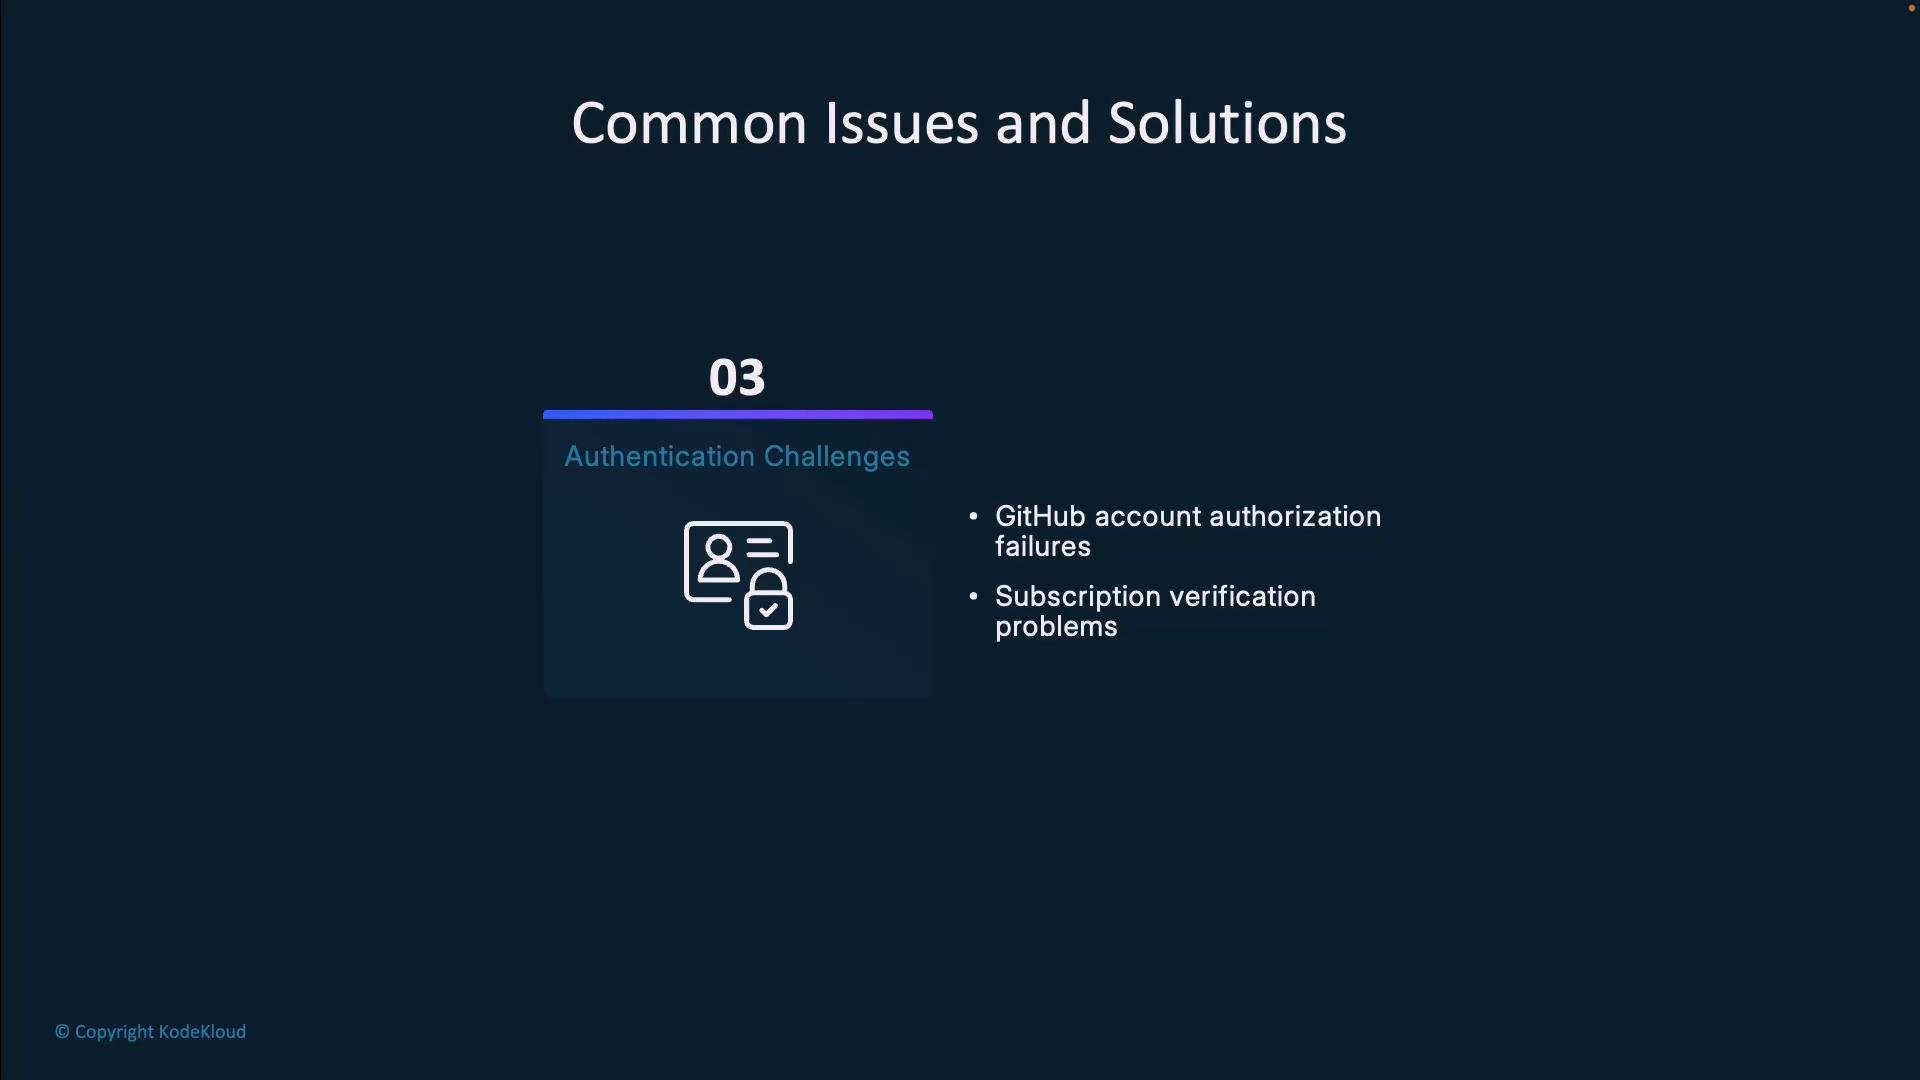
- Confirm you are signed into the IDE with the GitHub account that holds the Copilot subscription.
- Visit your Copilot settings on GitHub to verify subscription status: https://github.com/settings/copilot
- Sign out and sign back in from the IDE to refresh tokens and authorization.
- Ensure organization-managed accounts have been granted Copilot access per org policy.
Accessing diagnostic tools and logs
Collecting logs and diagnostics is essential when local troubleshooting fails or when escalating to support. VS Code quick commands:- Open the Command Palette and run:
Developer: Open Log File— view the extension log.Developer: Open Extensions Logs Folder— see logs for all extensions.GitHub Copilot: Collect Diagnostics— generates a diagnostics package to share with support.
- For low-level details: Help > Toggle Developer Tools (to view the Electron console logs).
Collect diagnostics before contacting support — include the generated diagnostics package and a concise reproduction of the steps and the exact timestamps. This speeds root-cause analysis.
Do not include personal secrets, API keys, or tokens when sharing diagnostics. Redact or remove any sensitive data before sending logs to support.
Environment-specific notes
Copilot runs in multiple IDEs and each environment has its own settings and log locations. Use the table below as a quick reference.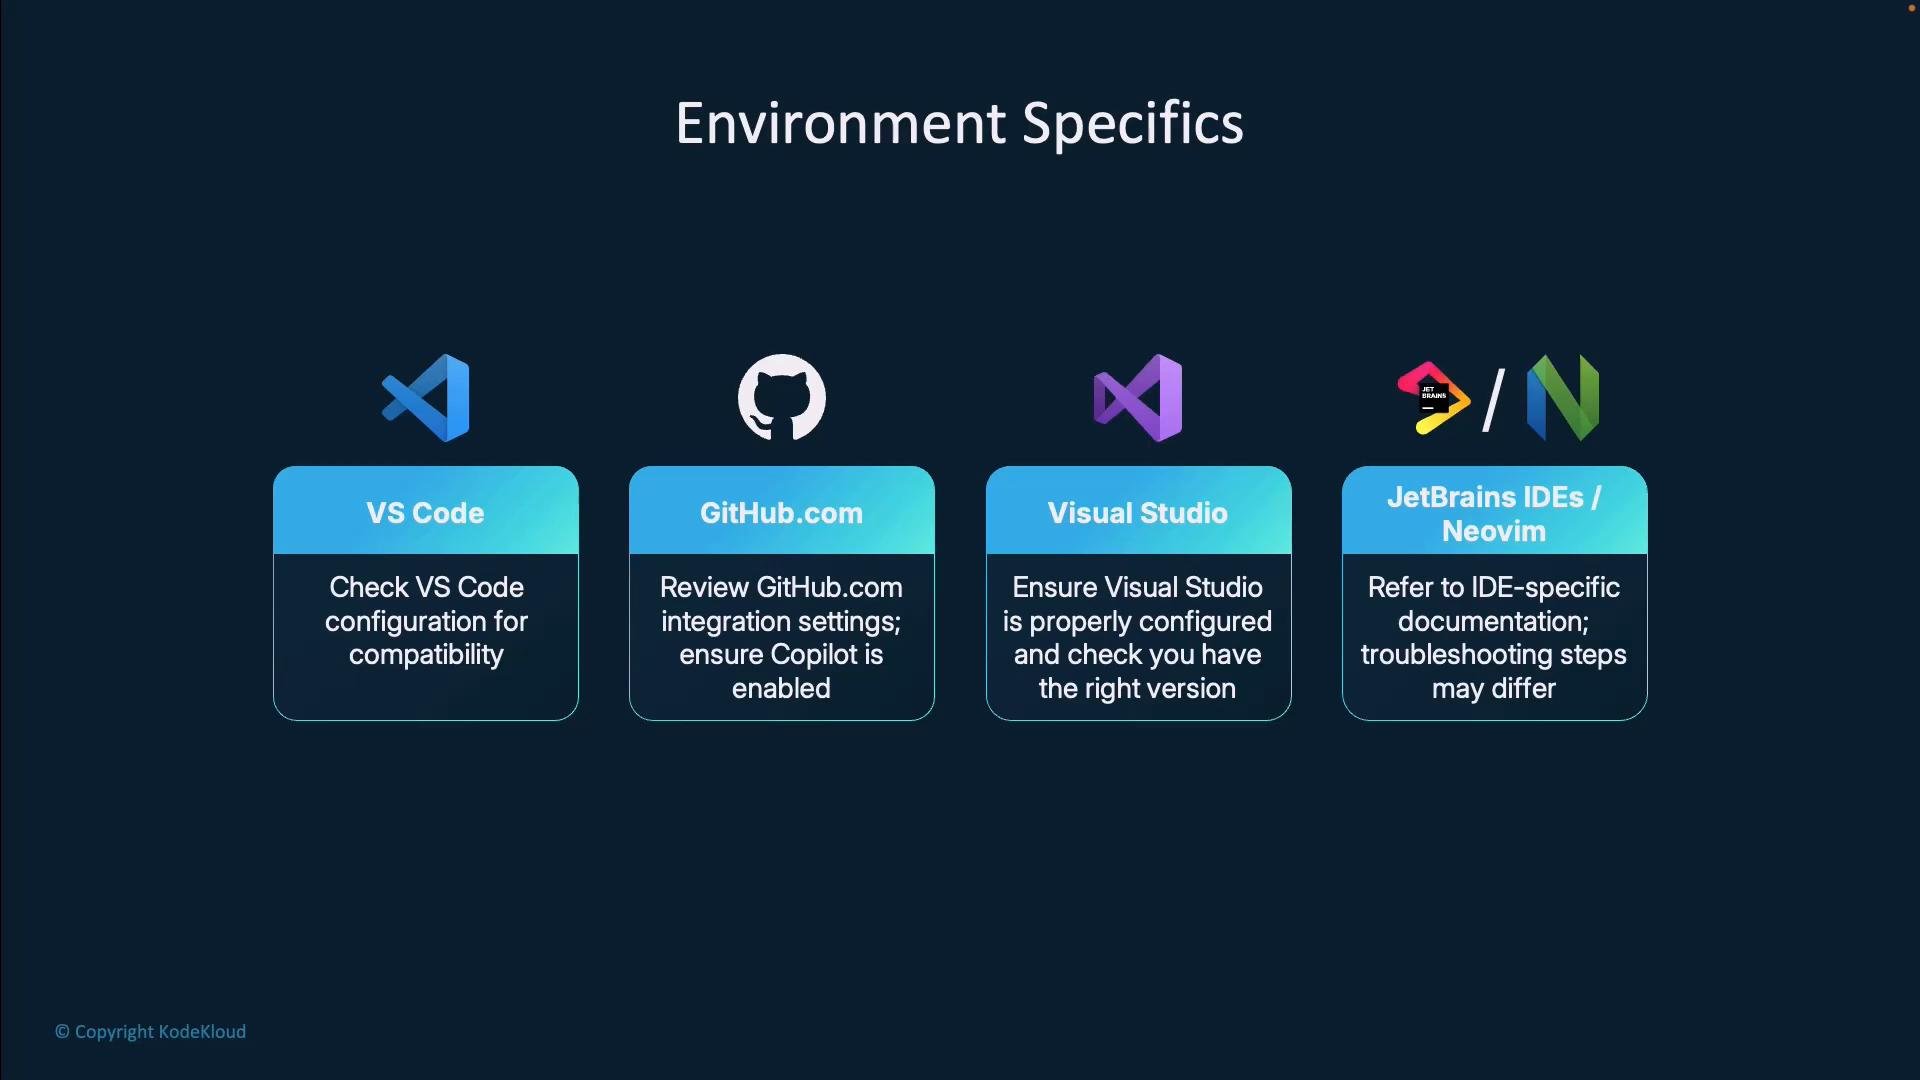
Practical troubleshooting checklist (summary)
- Reproduce the issue and capture exact steps, error messages, and timestamps.
- Check network connectivity, proxy, and firewall rules.
- Confirm account sign-in and Copilot subscription.
- Inspect extension status and settings (global vs workspace vs language).
- Collect diagnostics and relevant logs.
- If needed, escalate to support with the diagnostics bundle and a concise reproduction guide.
Preparing for the GitHub Copilot Certification
Focus your preparation on three core areas to perform well in the certification and in real-world troubleshooting:- Troubleshooting concepts — learn how to categorize issues and which diagnostic tools to use.
- Resourcefulness — know where to find official docs and how to read logs.
- Problem-solving — practice a systematic approach from symptoms to root cause.
Links and references
- GitHub Copilot settings: https://github.com/settings/copilot
- VS Code documentation: https://code.visualstudio.com/docs
- GitHub Docs: https://docs.github.com/