

Primary EBS metrics (quick summary)
Important metric details
-
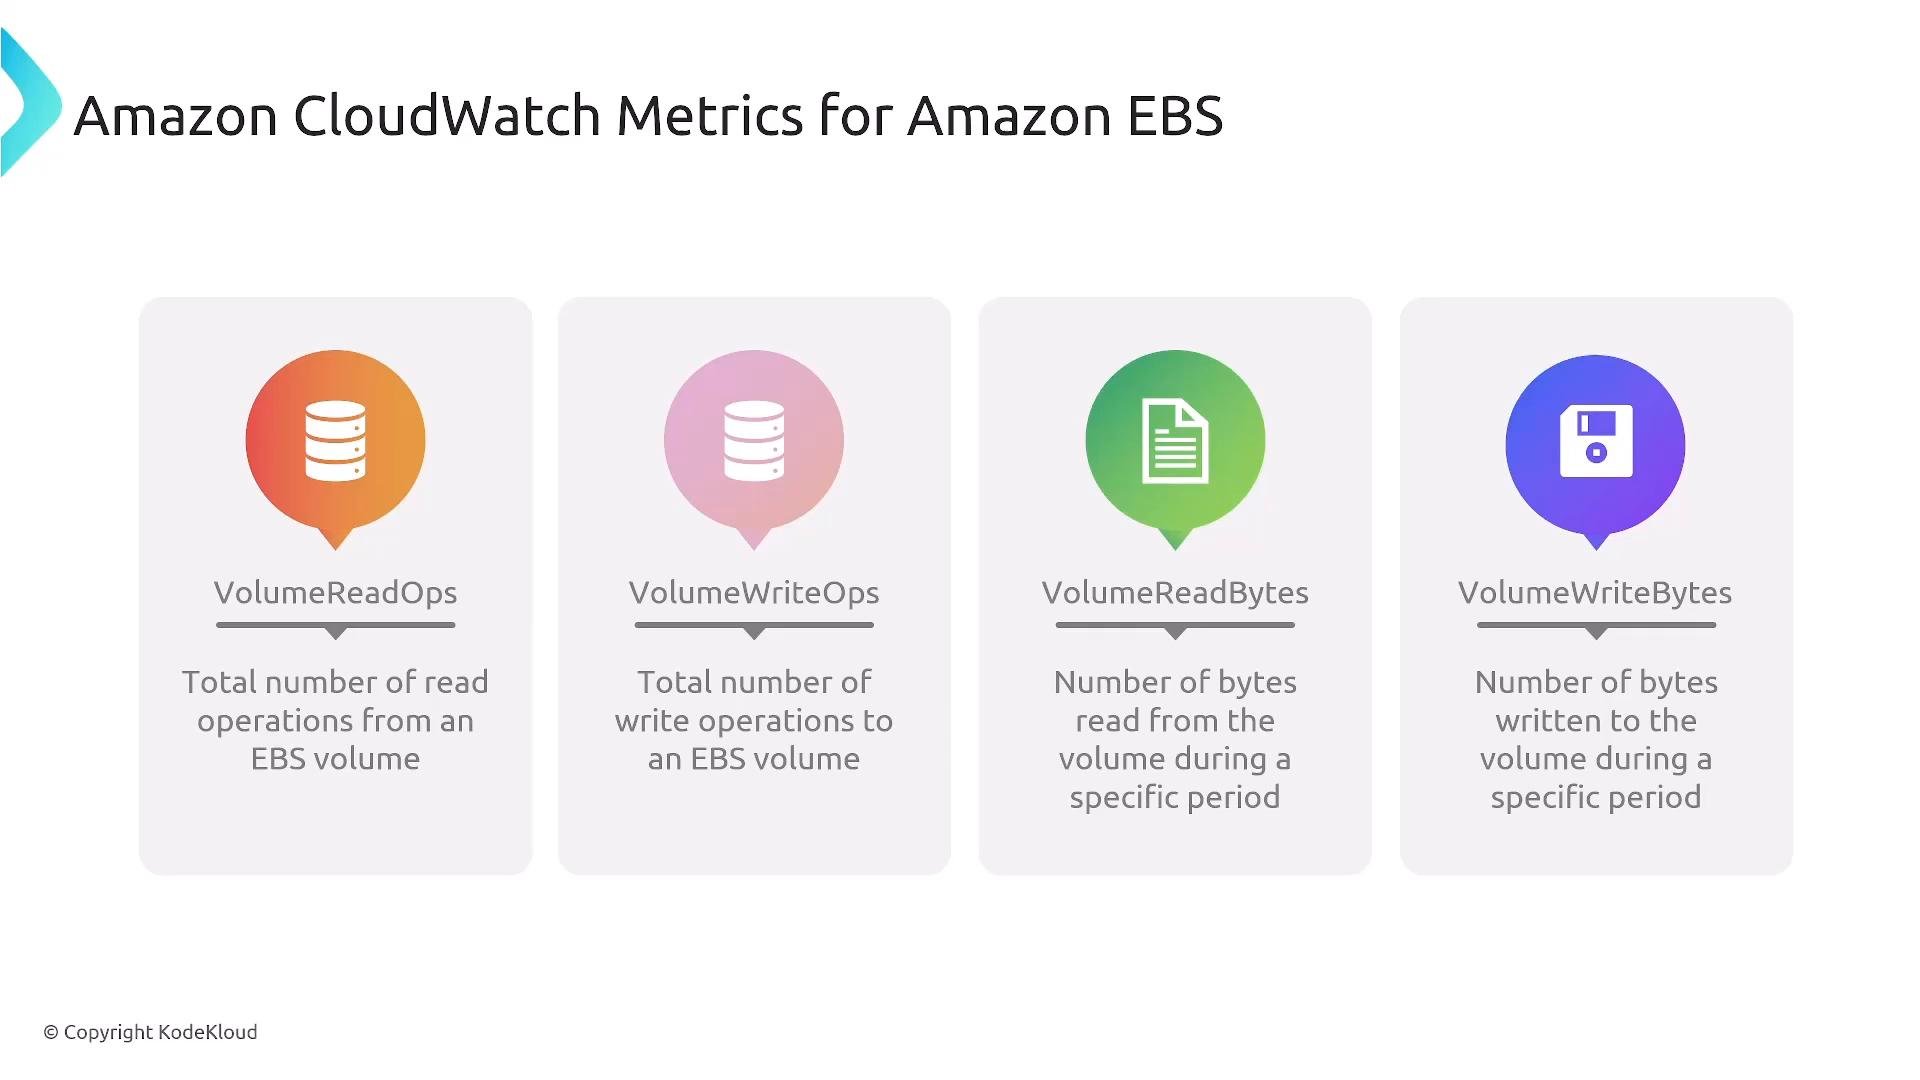
VolumeReadOps / VolumeWriteOps
These report the total read and write operations during the metric period. Divide by the period length to obtain IOPS (operations/sec). -
VolumeReadBytes / VolumeWriteBytes
These report total bytes transferred. Divide by period length to get throughput (bytes/sec). -
QueueLength (Queue Depth)
QueueLength shows the number of outstanding I/O requests waiting to be processed. A sustained, rising QueueLength indicates the disk is a performance bottleneck (for example, your workload is issuing more IOPS than the volume can deliver). -
Provisioned IOPS / throughput metrics (
VolumeConsumedReadWriteOps,VolumeThroughputPercentage)
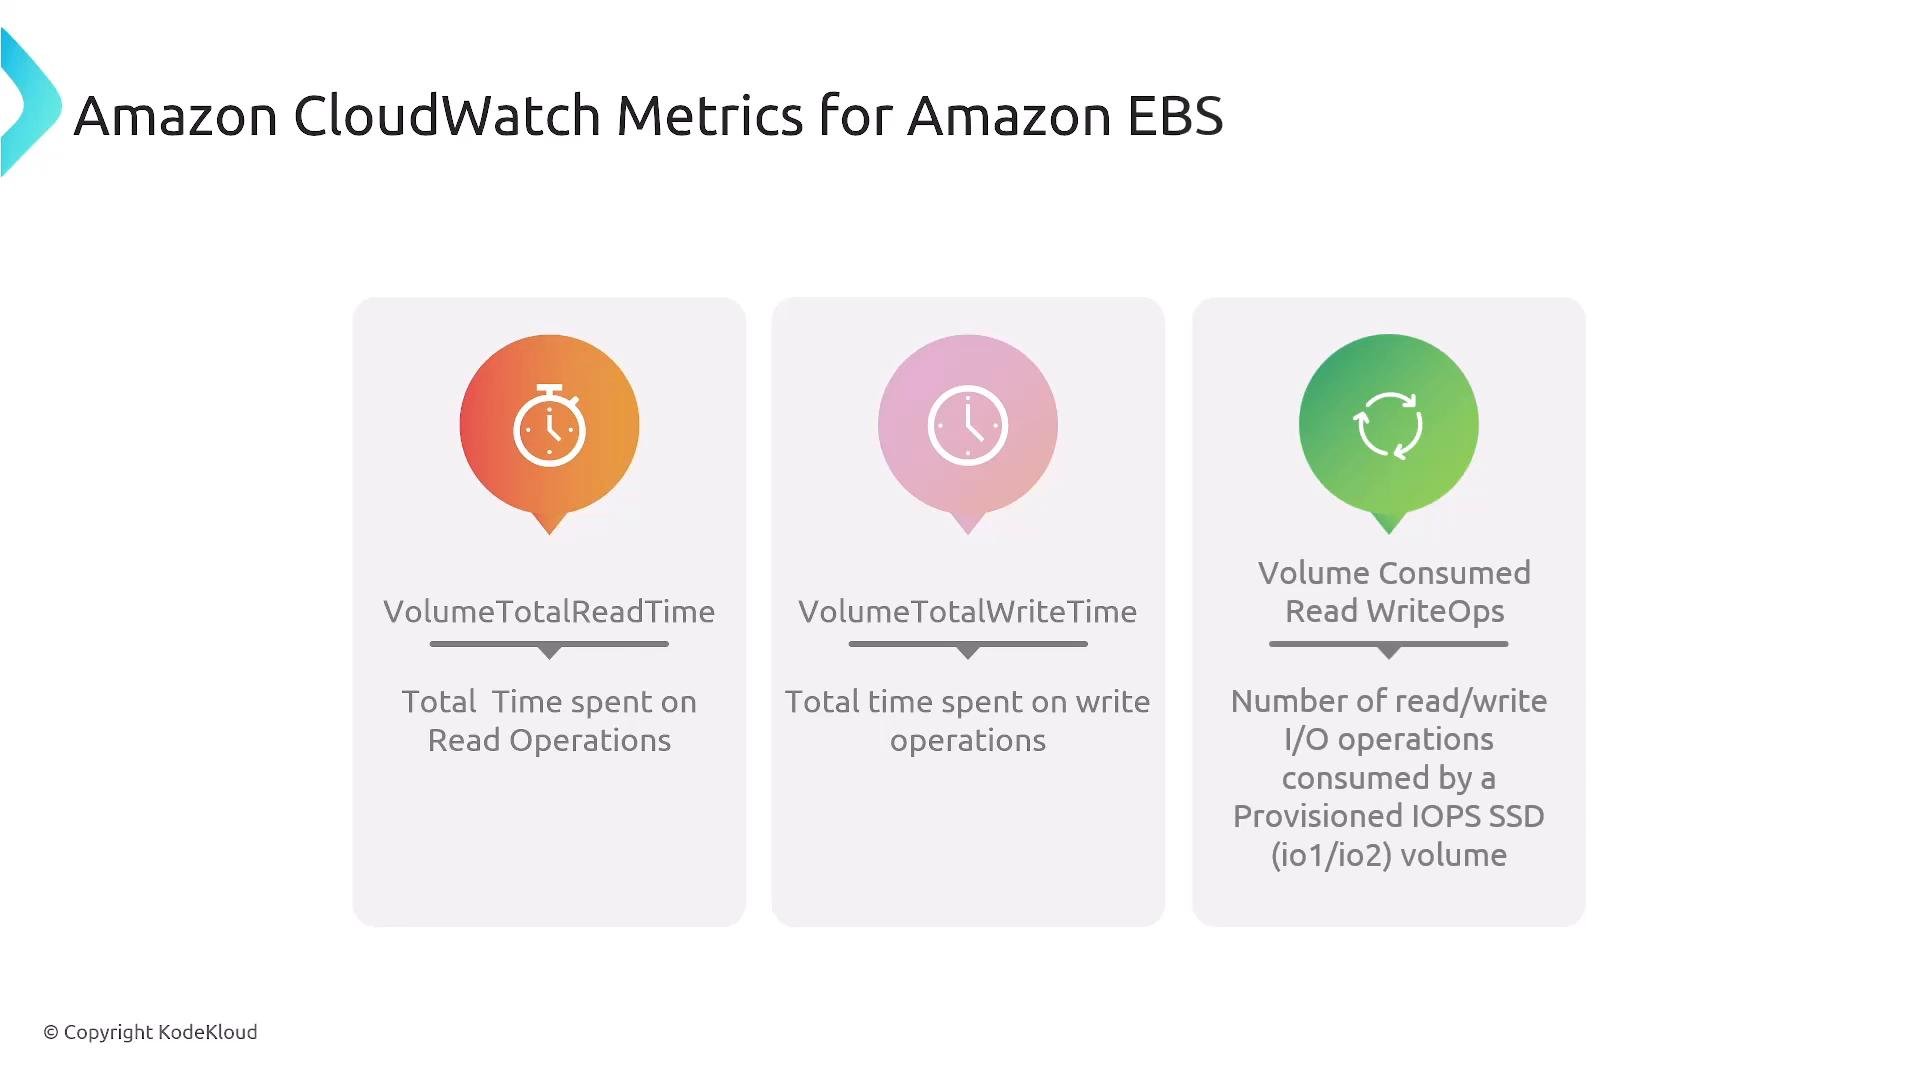
For io1/io2 (provisioned) or gp3 configurations, CloudWatch exposes consumed IOPS/throughput and percentage-of-provisioned metrics. These help you tell if you’re hitting the provisioned limits. Values near 100% mean you’re using all the provisioned capacity. -
BurstBalance and gp2 burst credits
gp2 volumes use a credit-bucket model and can burst above their baseline rate while credits remain. gp3 separates IOPS/throughput from storage capacity and is generally preferred.
Note: gp2 still exists but gp3 is generally preferred. If you encounter performance issues on gp2 volumes, check
BurstBalance before changing volume types.- Timing metrics (
VolumeIdleTime,VolumeTotalReadTime,VolumeTotalWriteTime)
These report time-based aggregates that you can use to compute average latencies per operation.
How to reason about these metrics together
-
IOPS (operations per second)
- read IOPS =
VolumeReadOps / period_seconds - write IOPS =
VolumeWriteOps / period_seconds
- read IOPS =
-
Throughput (bytes/sec)
- read throughput =
VolumeReadBytes / period_seconds - write throughput =
VolumeWriteBytes / period_seconds
- read throughput =
-
Average latency per operation
- average read latency =
VolumeTotalReadTime / VolumeReadOps - average write latency =
VolumeTotalWriteTime / VolumeWriteOps
Note:VolumeTotalReadTimeandVolumeTotalWriteTimeare reported in seconds in CloudWatch, so the result is seconds per operation — convert to milliseconds (×1000) if desired.
- average read latency =
-
QueueLength (queue depth)
If QueueLength grows steadily, that indicates operations are backing up — a classic sign of I/O saturation (disk bottleneck), not necessarily CPU or memory.
CloudWatch alarms and automated actions
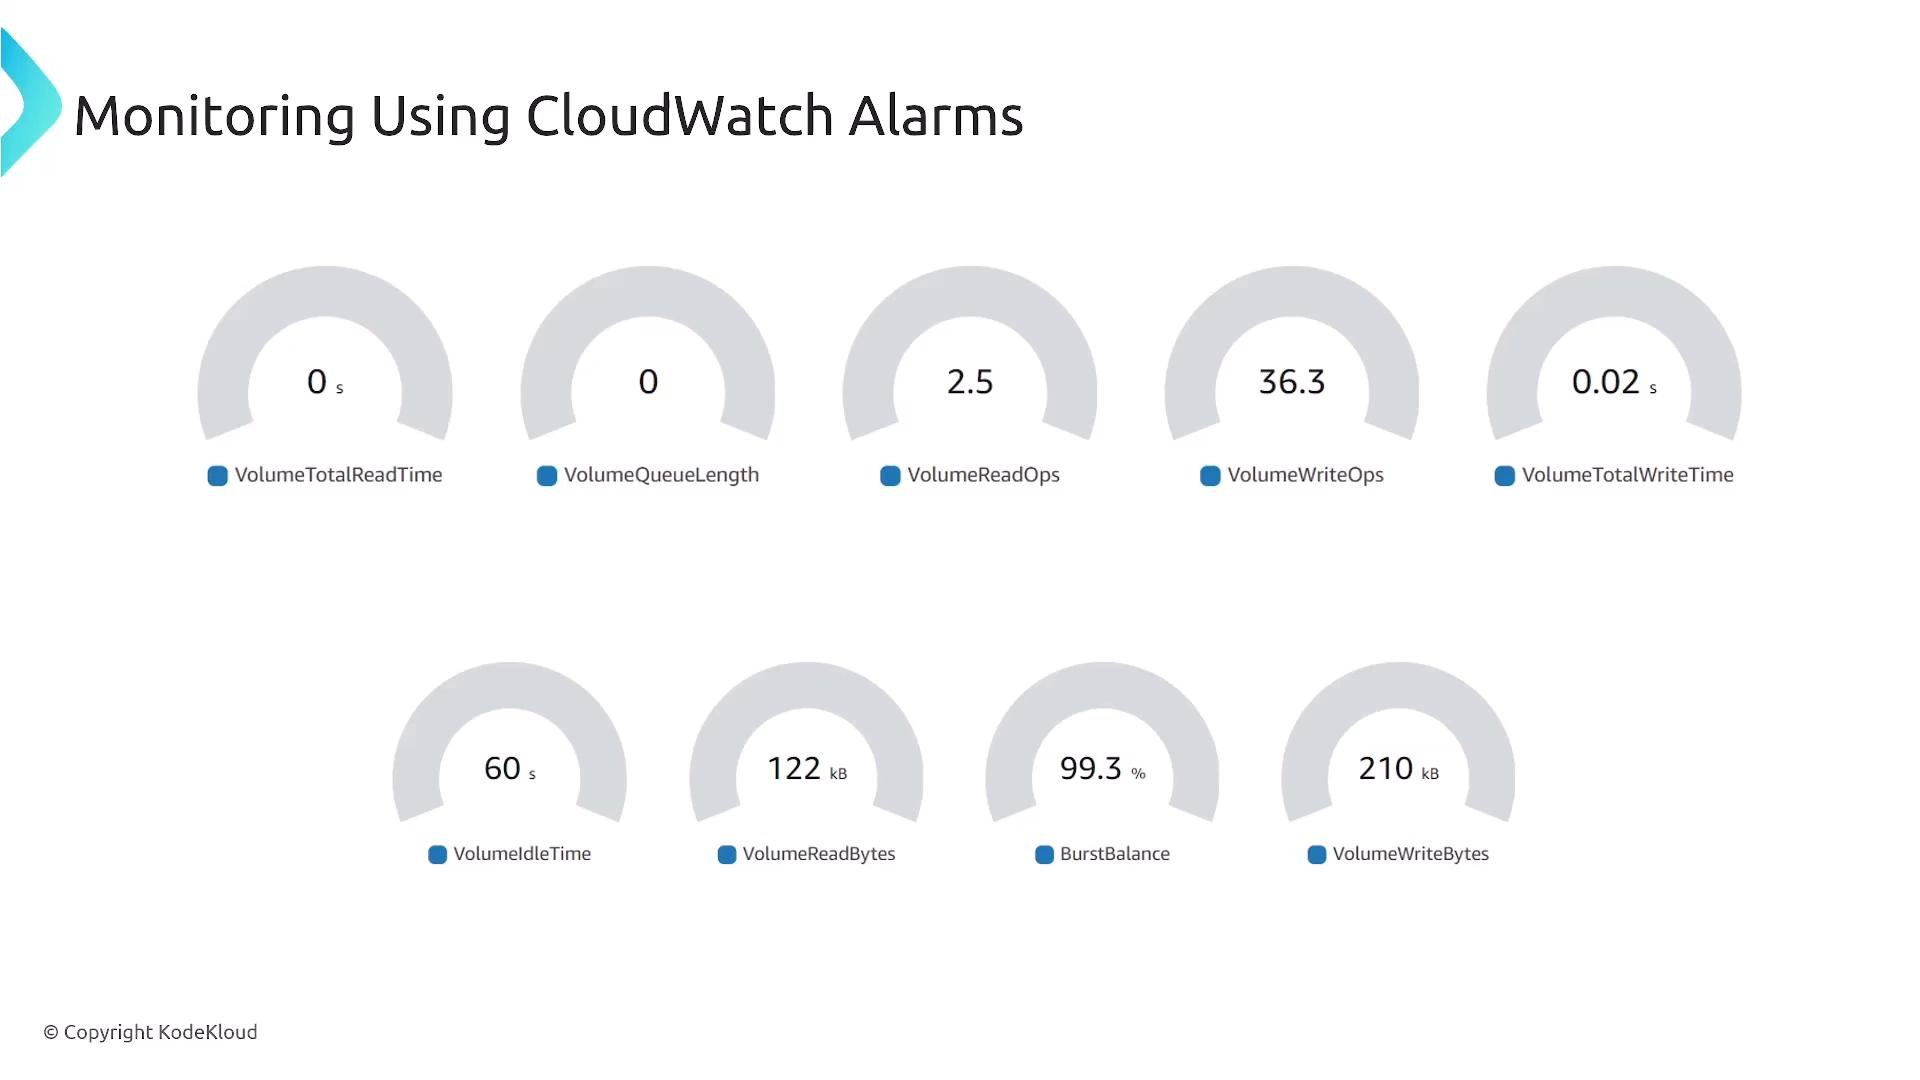
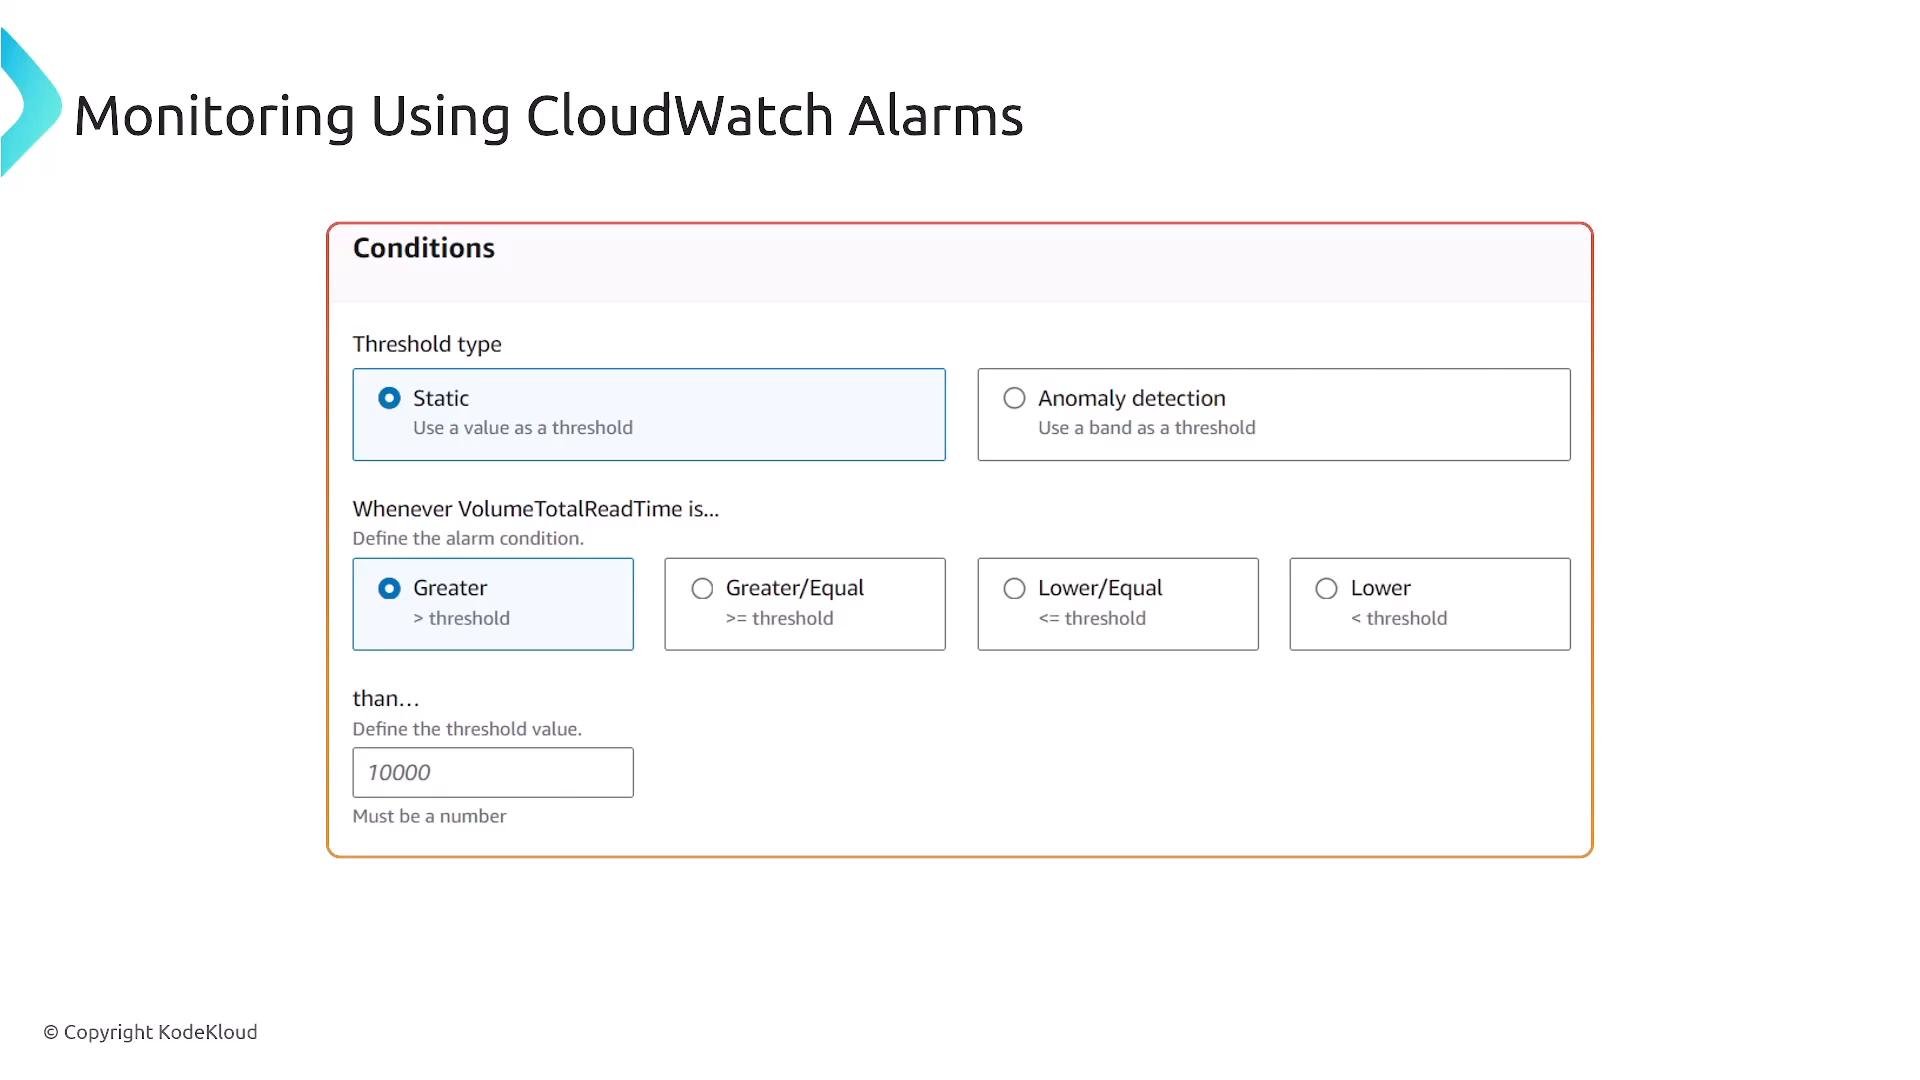
- You can create CloudWatch alarms on any EBS metric. Choose between static thresholds and anomaly detection to reduce false positives.
- Alarm comparison operators include
GreaterThanThreshold,GreaterThanOrEqualToThreshold,LessThanThreshold,LessThanOrEqualToThreshold, etc. - Alarm actions commonly notify an SNS topic. From SNS you can:
- Notify humans via email or SMS
- Fan-out to other systems
- Trigger an
AWS Lambdafunction to run automated remediation
- Use anomaly detection for variable workloads to avoid noisy alerts.
- For disk bottlenecks, combine thresholds (e.g.,
QueueLength > XandVolumeConsumedReadWriteOpsclose to provisioned IOPS) to reduce false positives. - Consider automated remediation only after careful testing (e.g., scale-out, move data, modify EBS type).
Example alarm configuration options
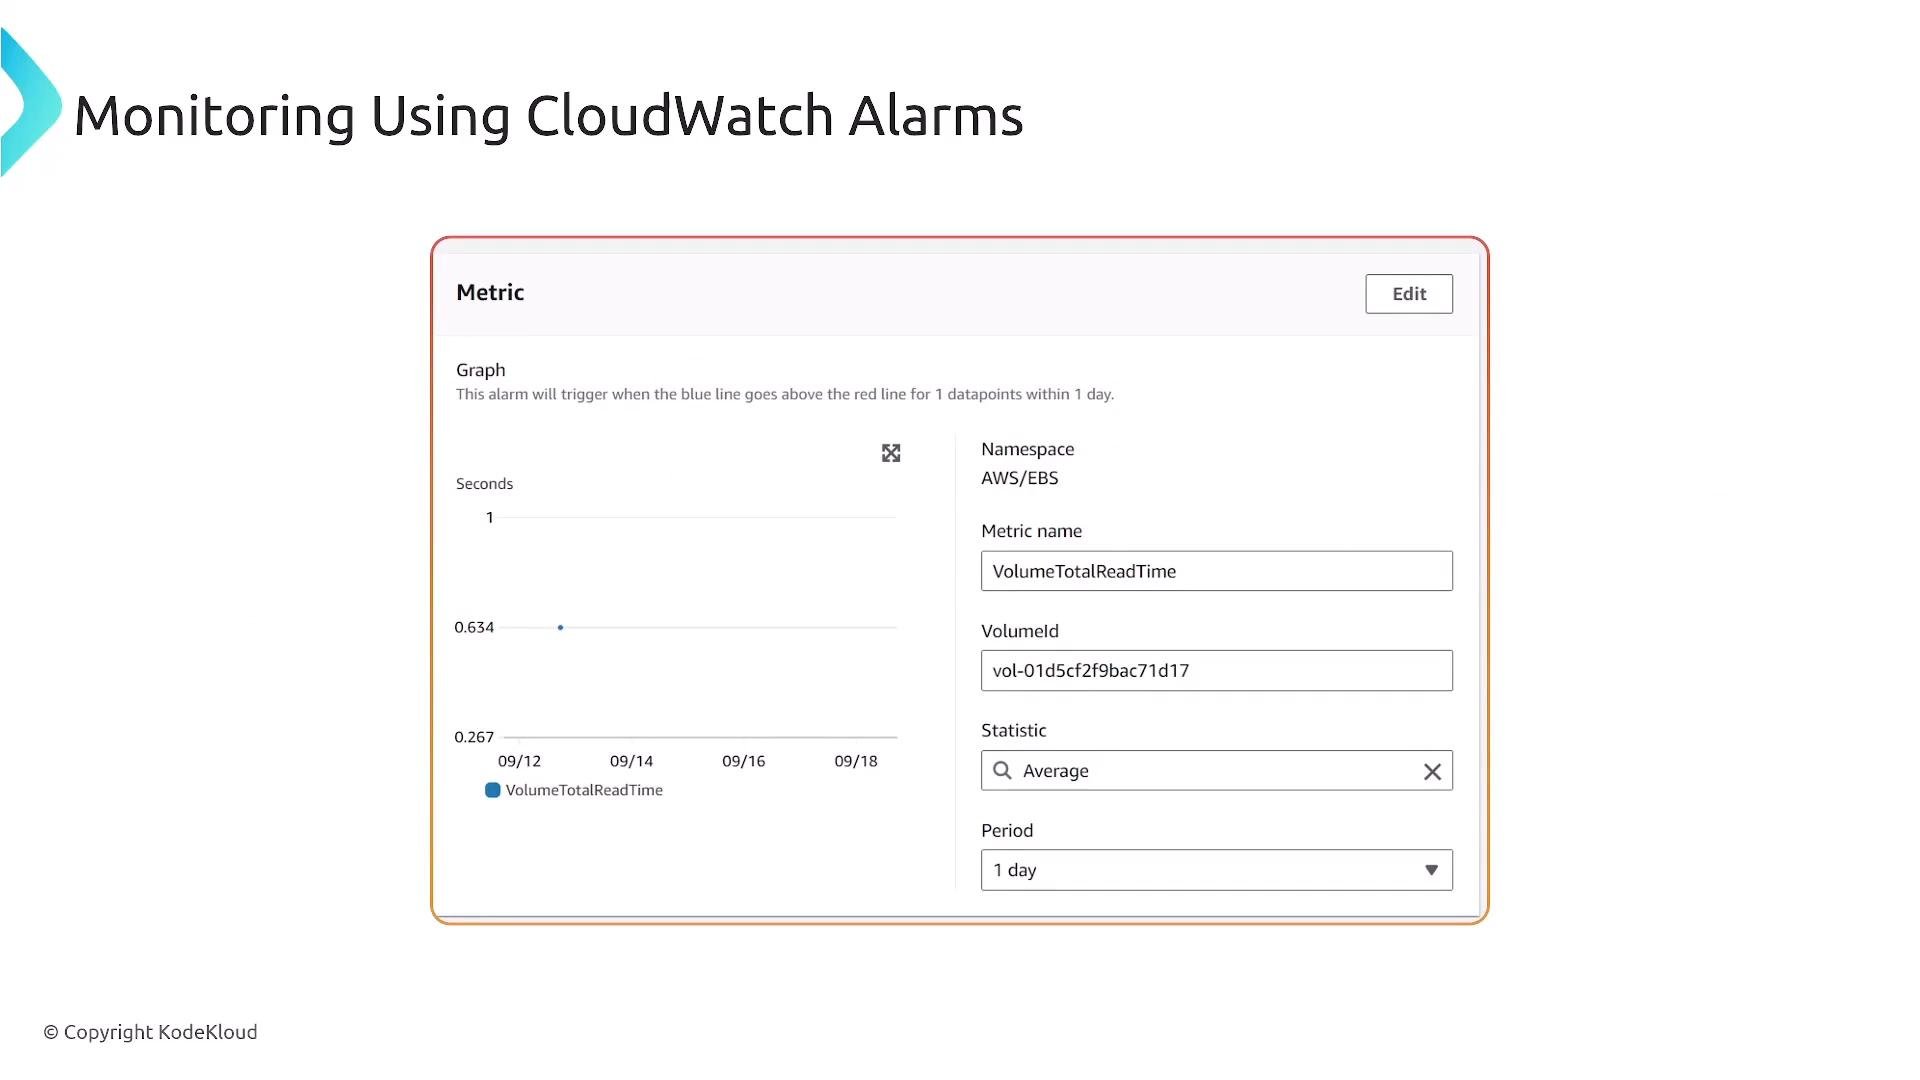
- Choose Static threshold or Anomaly detection depending on workload patterns.
- Set comparison operator (e.g.,
GreaterThanThreshold) and an appropriate threshold value based on your baseline. - Configure evaluation periods and actions (SNS topics, Lambda functions).
Exam tips / summary
- Identify disk bottlenecks: a high and sustained
QueueLength(queue depth) indicates the disk is overloaded — not CPU or memory. - Compute average latency from total time and operation counts:
average read latency = VolumeTotalReadTime / VolumeReadOpsaverage write latency = VolumeTotalWriteTime / VolumeWriteOps
- Remember gp2 burst behavior (
BurstBalance) and that provisioned IOPS volumes expose consumed I/O metrics (VolumeConsumedReadWriteOps,VolumeThroughputPercentage). - Use CloudWatch alarms (static or anomaly detection) and consider automation via SNS →
AWS Lambdafor remediation, but test automation carefully.
Links and references
- AWS CloudWatch course
- AWS Lambda course
- AWS documentation: Amazon EBS monitoring with CloudWatch