

Key metrics and what they indicate
CPU utilization
Monitor the percentage of CPU used by your RDS instance. Sustained high CPU usually signals heavy read/write activity or inefficient queries.- What to check:
- Query patterns and slow queries.
- Index usage and full table scans.
- Background tasks such as backups or maintenance.
- Scaling guidance:
- Vertical scaling (larger instance) is commonly required for write-heavy workloads.
- Horizontal scaling (read replicas) is effective when reads dominate.
- Always profile and optimize queries before resizing; inefficient SQL can consume CPU even on larger instances.
Before vertical scaling, profile slow queries and confirm that CPU is the real bottleneck. Increasing CPU without fixing inefficient queries can be costly and temporary.
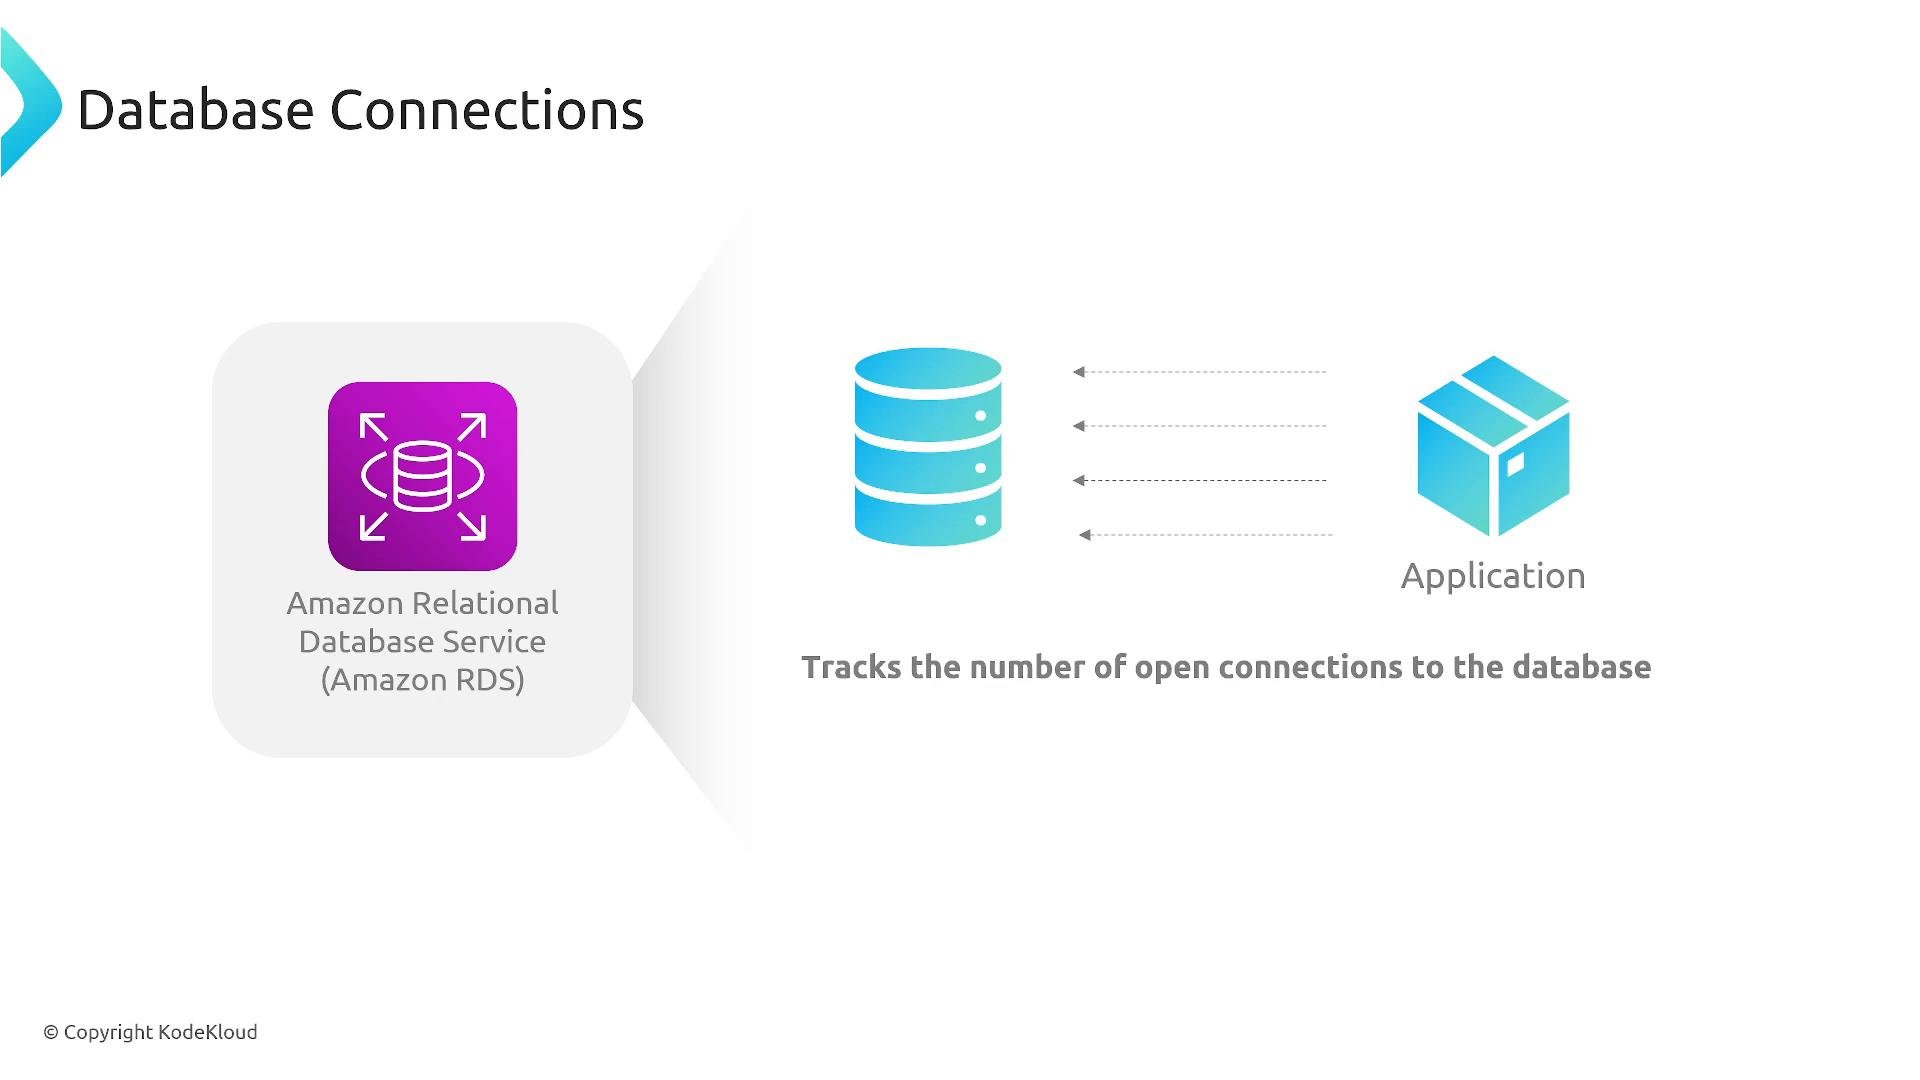
Database connections
Track the total number of open connections. A sudden rise or sustained high count can indicate missing connection pooling, app misconfiguration, or too many clients.- Solutions:
- Implement connection pooling in the application.
- Use RDS Proxy to multiplex client connections and maintain a controlled pool of persistent DB connections.
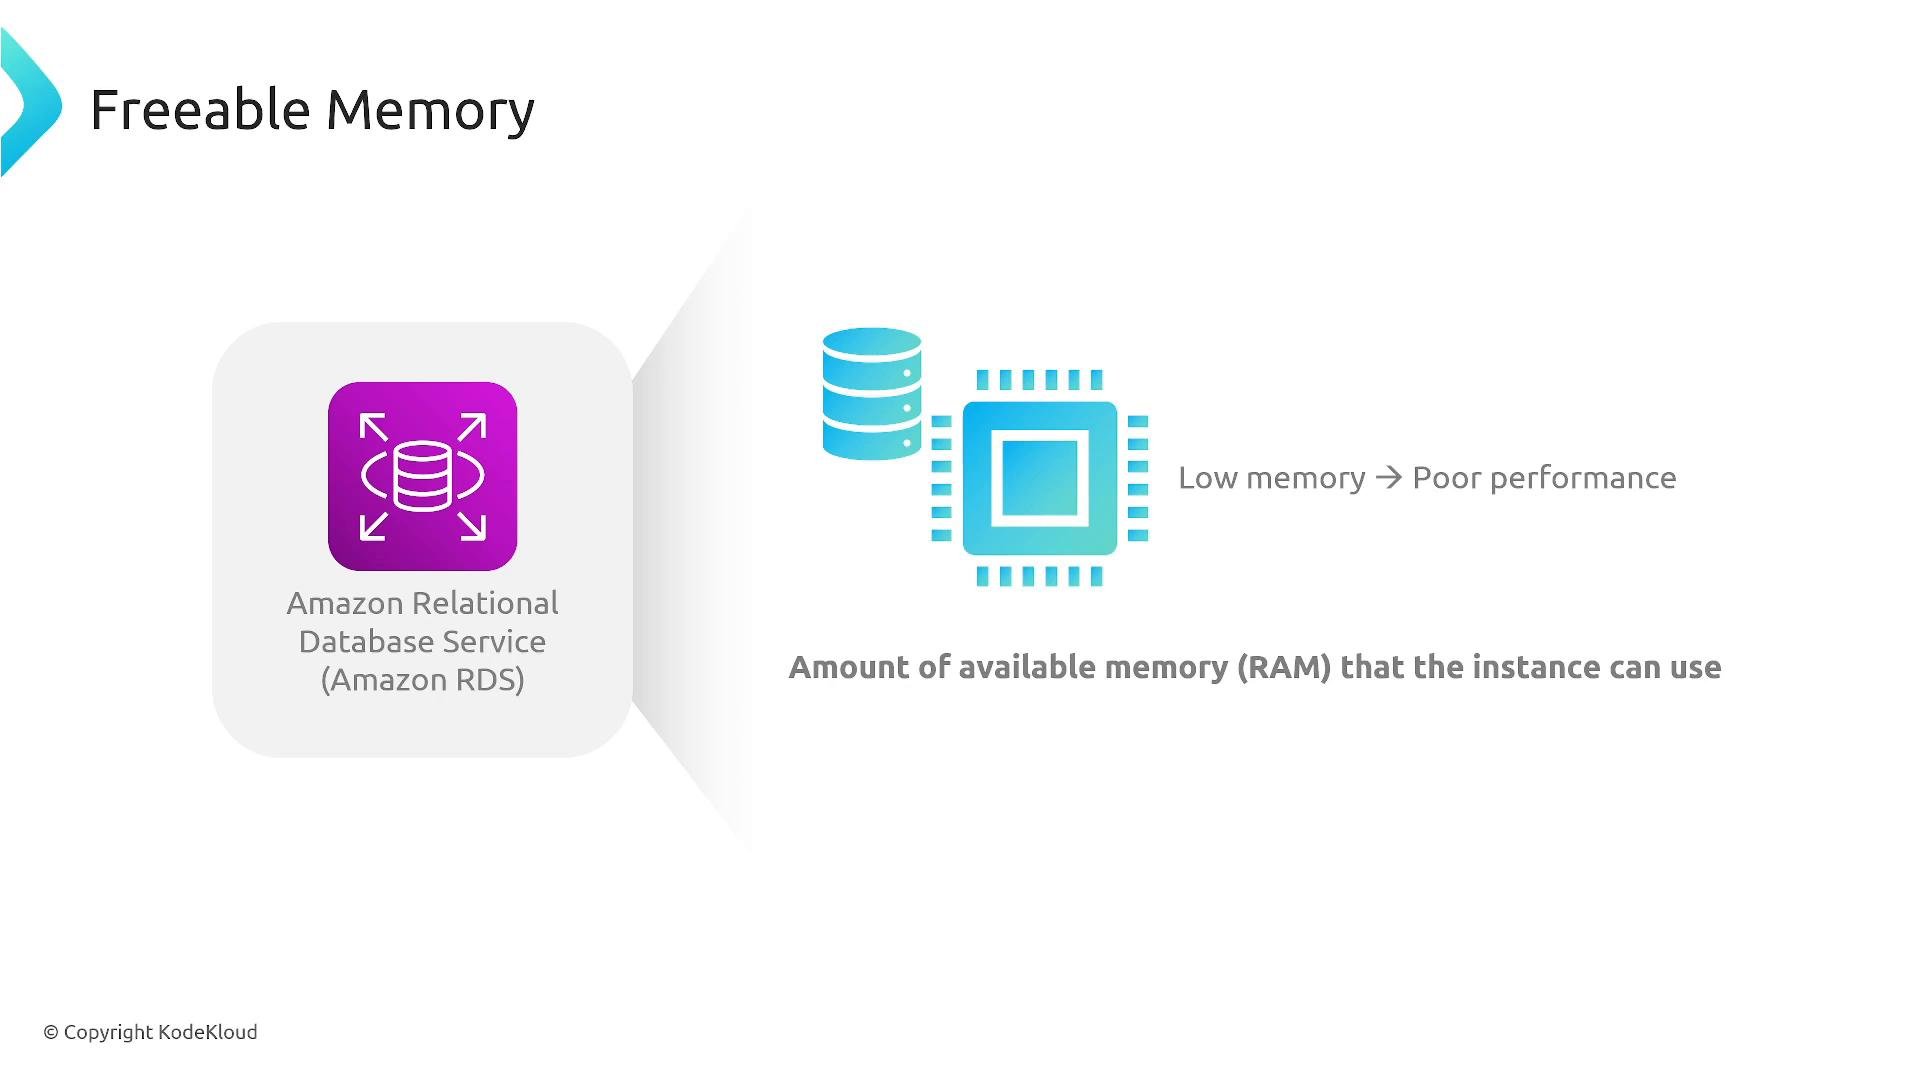
Freeable memory
Freeable memory is the RAM available on the DB instance. Low freeable memory often correlates with degraded performance (e.g., increased swapping, evictions from caches).- If memory is low:
- Consider vertical scaling to a larger instance type with more RAM.
- Offload read-heavy workloads to read replicas so the primary’s memory is less pressured.
- Re-evaluate indexing and caching strategies so working sets fit in memory.
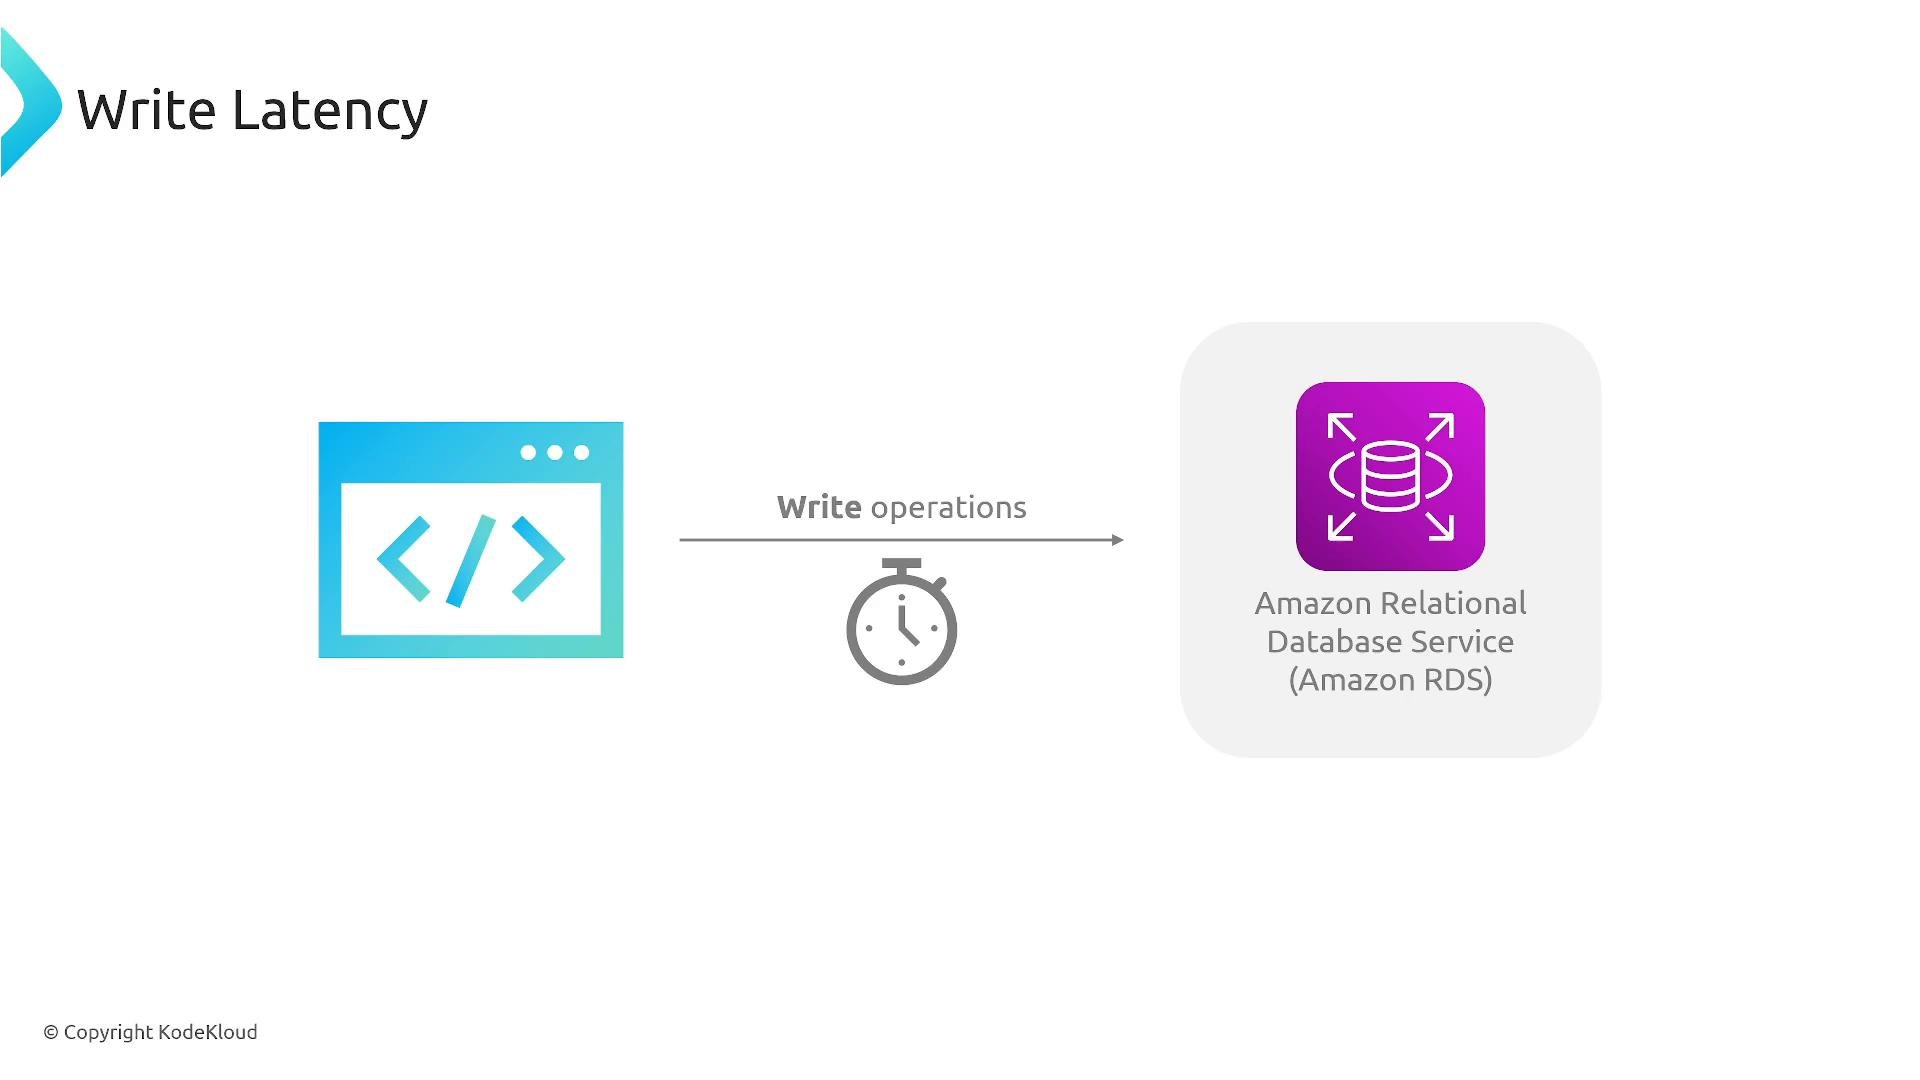
I/O metrics (Read/Write IOPS and latency)
Key I/O metrics are ReadIOPS, WriteIOPS, ReadLatency, and WriteLatency. They show how active and responsive your storage layer is.- High read latency: consider read replicas, caching (Redis/Memcached), or query/index optimization.
- High write latency: consider higher-throughput storage (Provisioned IOPS), larger instance types, or batching writes where possible.
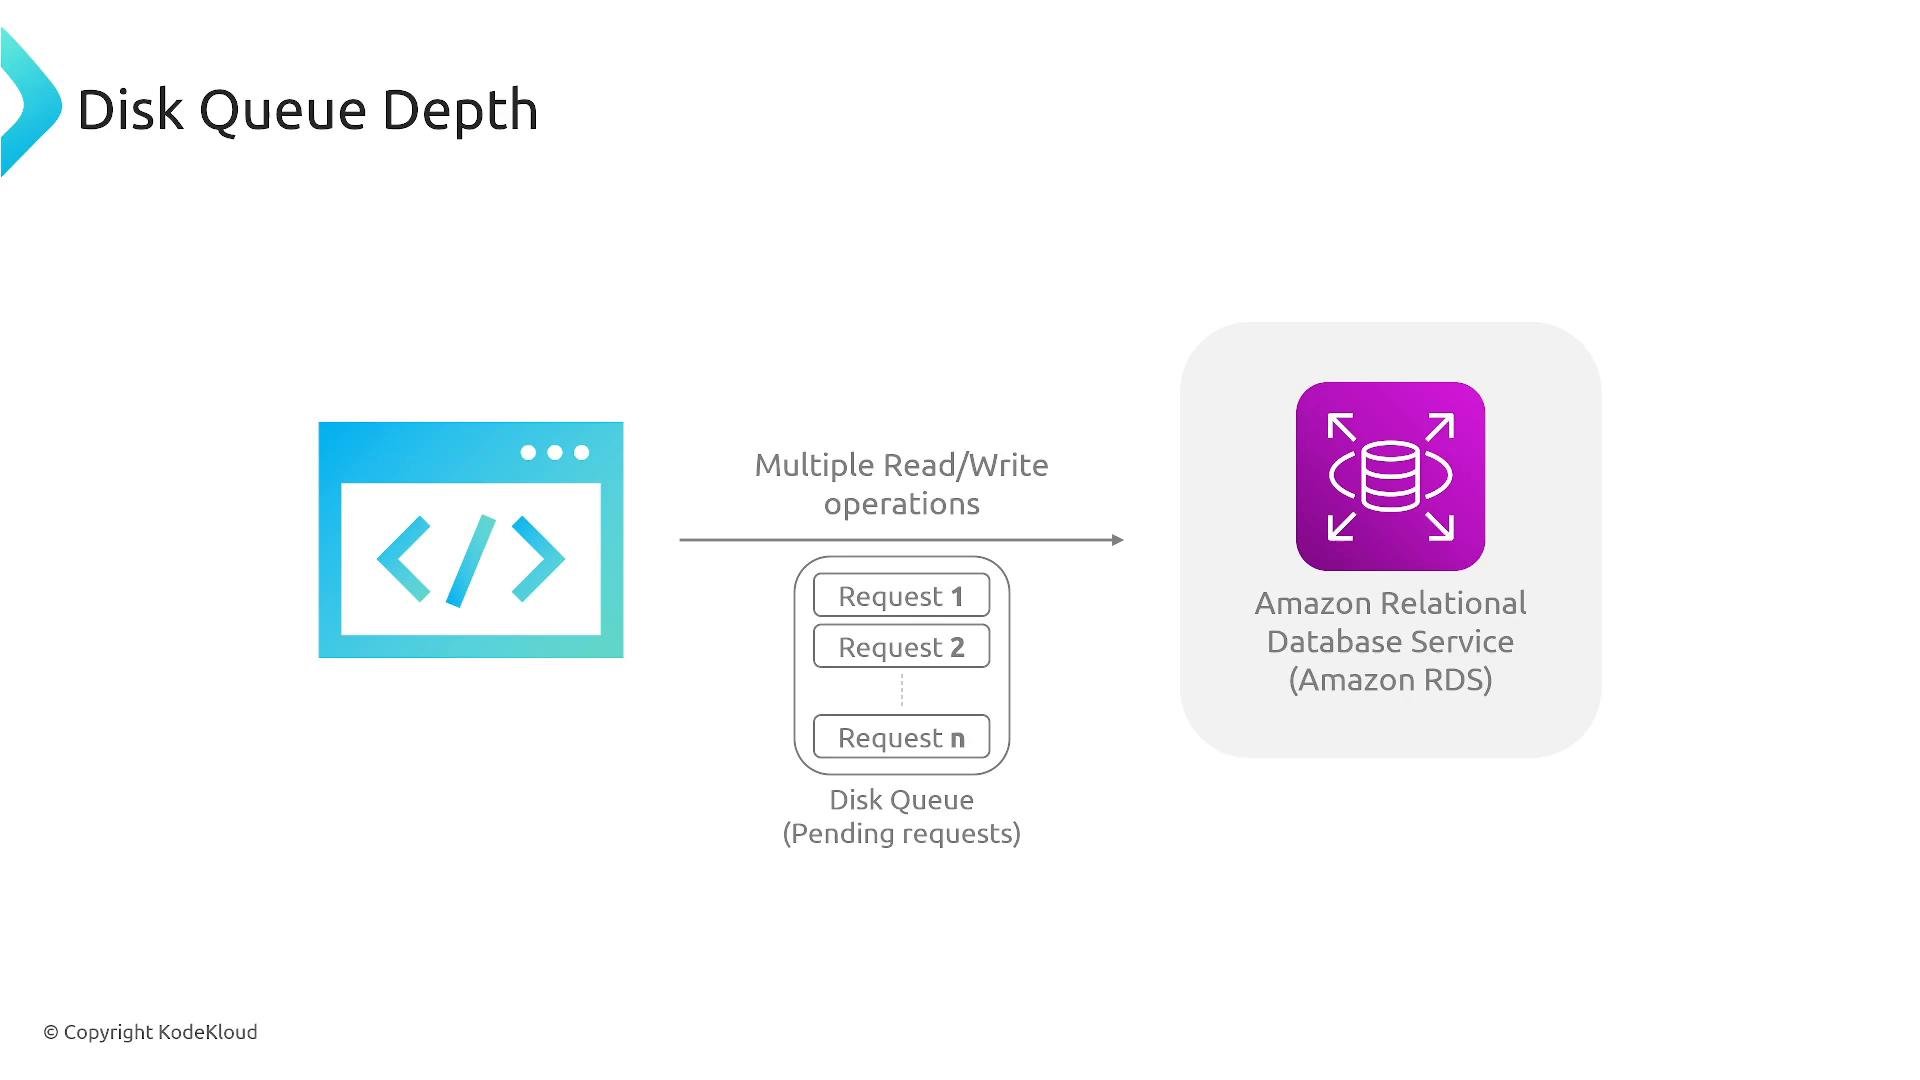
Disk queue depth
DiskQueueDepth measures the number of pending I/O operations waiting for the disk. A sustained high queue depth indicates the disk cannot keep up with demand.- Remediation steps:
- Increase IOPS or switch to higher-performance volume types (Provisioned IOPS, io2).
- Increase instance size if the workload requires more CPU/memory to process IO.
- Offload reads to replicas or a cache to reduce IO pressure on the primary.
Quick reference table
Monitoring tools and deeper visibility
- Use Amazon CloudWatch to collect and alert on:
CPUUtilization,DatabaseConnections,FreeableMemory,ReadIOPS,WriteIOPS,ReadLatency,WriteLatency, andDiskQueueDepth. (CloudWatch docs: https://learn.kodekloud.com/user/courses/aws-cloudwatch) - Enable Enhanced Monitoring to get OS-level metrics: https://docs.aws.amazon.com/AmazonRDS/latest/UserGuide/USER_Monitoring.OS.html
- Enable Performance Insights for query-level visibility and top wait events: https://docs.aws.amazon.com/AmazonRDS/latest/UserGuide/USER_PerfInsights.html
Monitor related metrics together. Example: high CPU with low DiskQueueDepth implies compute-bound issues (optimize queries or scale CPU), while high DiskQueueDepth with high latency indicates a storage bottleneck (increase IOPS or offload reads).
Best practices summary
- Profile and optimize slow queries and indexing before scaling.
- Use connection pooling and RDS Proxy to manage connection storms.
- Offload read traffic to read replicas or caches to reduce primary load.
- Pick the right storage class (Provisioned IOPS / io2) for write-heavy, latency-sensitive workloads.
- Combine CloudWatch alarms, Enhanced Monitoring, and Performance Insights for comprehensive diagnostics.
Links and references
- Amazon RDS Overview: https://learn.kodekloud.com/user/courses/aws-rds
- RDS Proxy: https://docs.aws.amazon.com/AmazonRDS/latest/UserGuide/rds-proxy.html
- Read replicas: https://docs.aws.amazon.com/AmazonRDS/latest/UserGuide/USER_ReadRepl.html
- RDS Storage and PIOPS: https://docs.aws.amazon.com/AmazonRDS/latest/UserGuide/CHAP_Storage.html#USER_PIOPS
- EBS volume types (io2): https://docs.aws.amazon.com/AWSEC2/latest/UserGuide/ebs-volume-types.html#io2
- Enhanced Monitoring: https://docs.aws.amazon.com/AmazonRDS/latest/UserGuide/USER_Monitoring.OS.html
- Performance Insights: https://docs.aws.amazon.com/AmazonRDS/latest/UserGuide/USER_PerfInsights.html