CloudWatch Overview
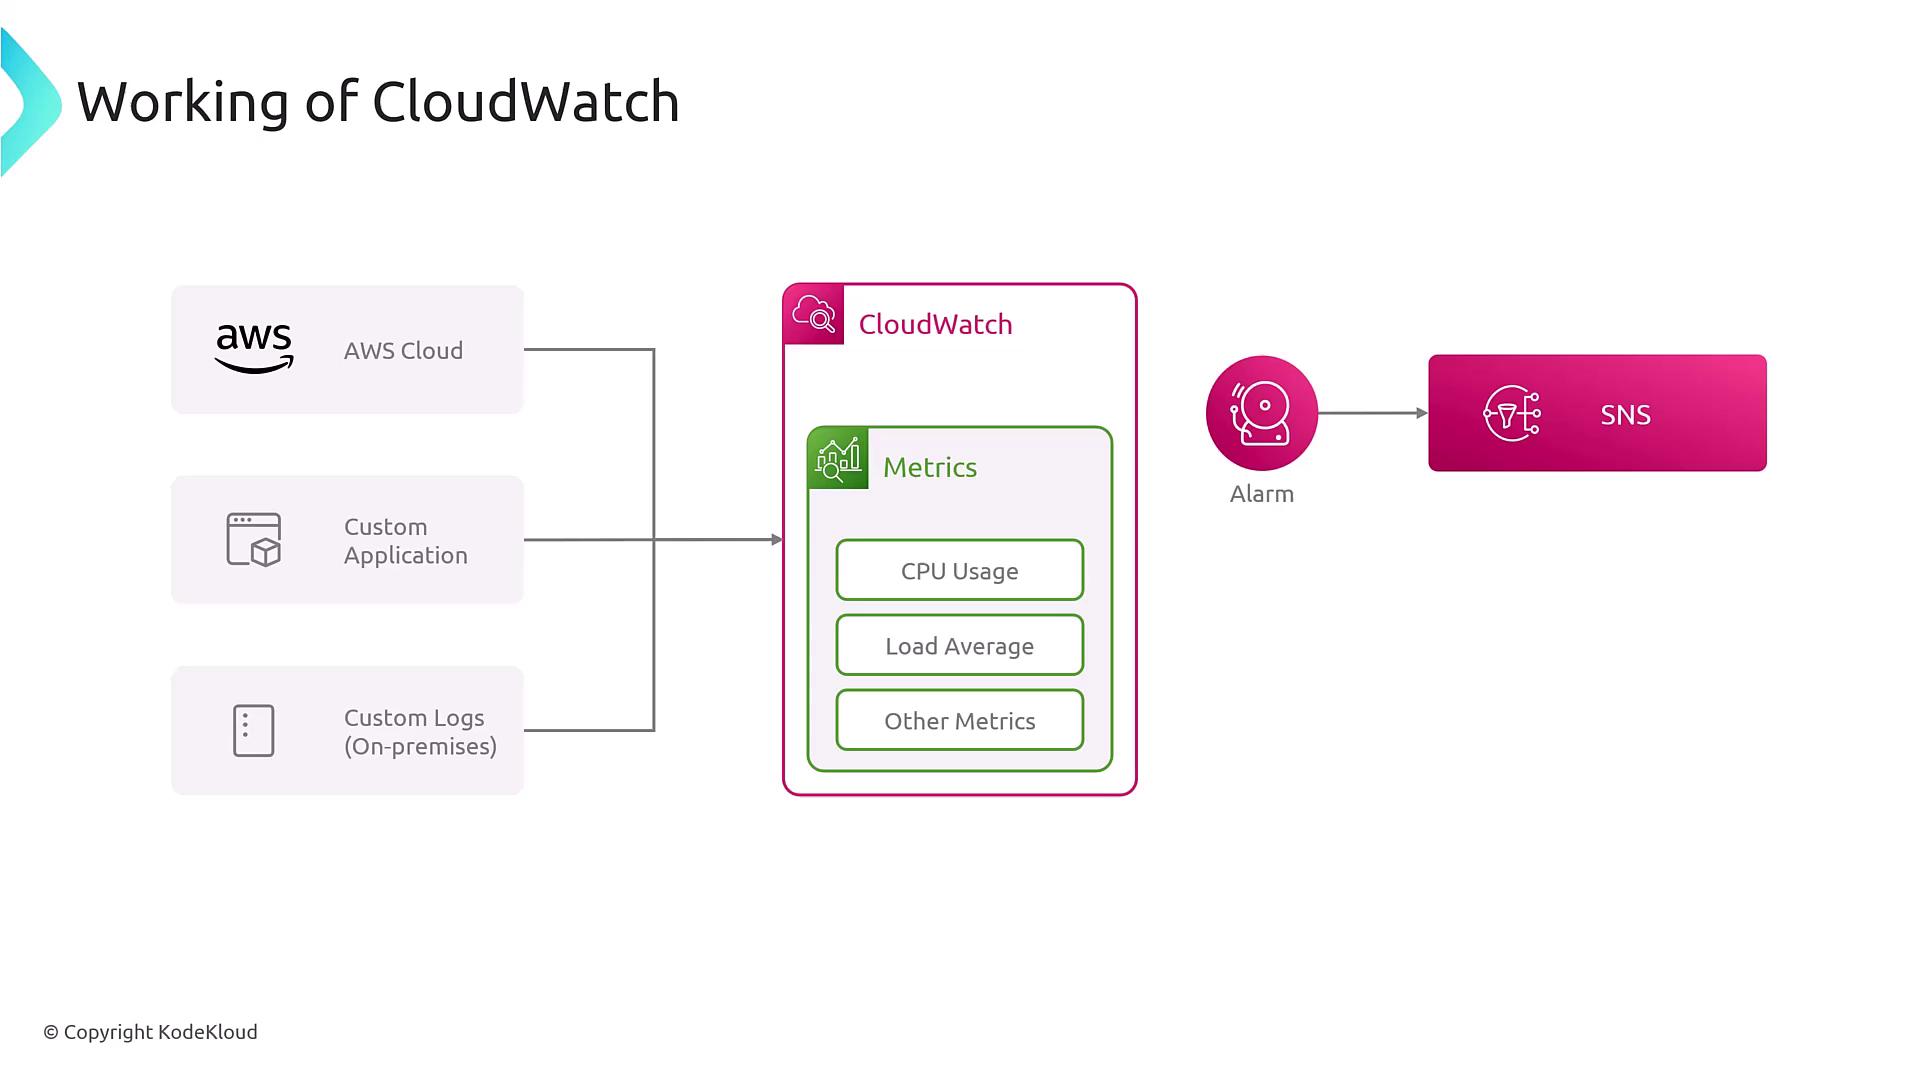
CloudWatch is a powerful monitoring service designed to collect and track metrics, logs, traces, and synthetic tests from AWS resources and on-premises applications. It acts as your centralized monitoring hub, ensuring that you maintain complete visibility over both your cloud and hybrid environments. You can use CloudWatch to:- Monitor system health and performance across AWS and on-premises resources.
- Collect various metrics including CPU usage, load average, disk I/O, network bandwidth, and burst credits.
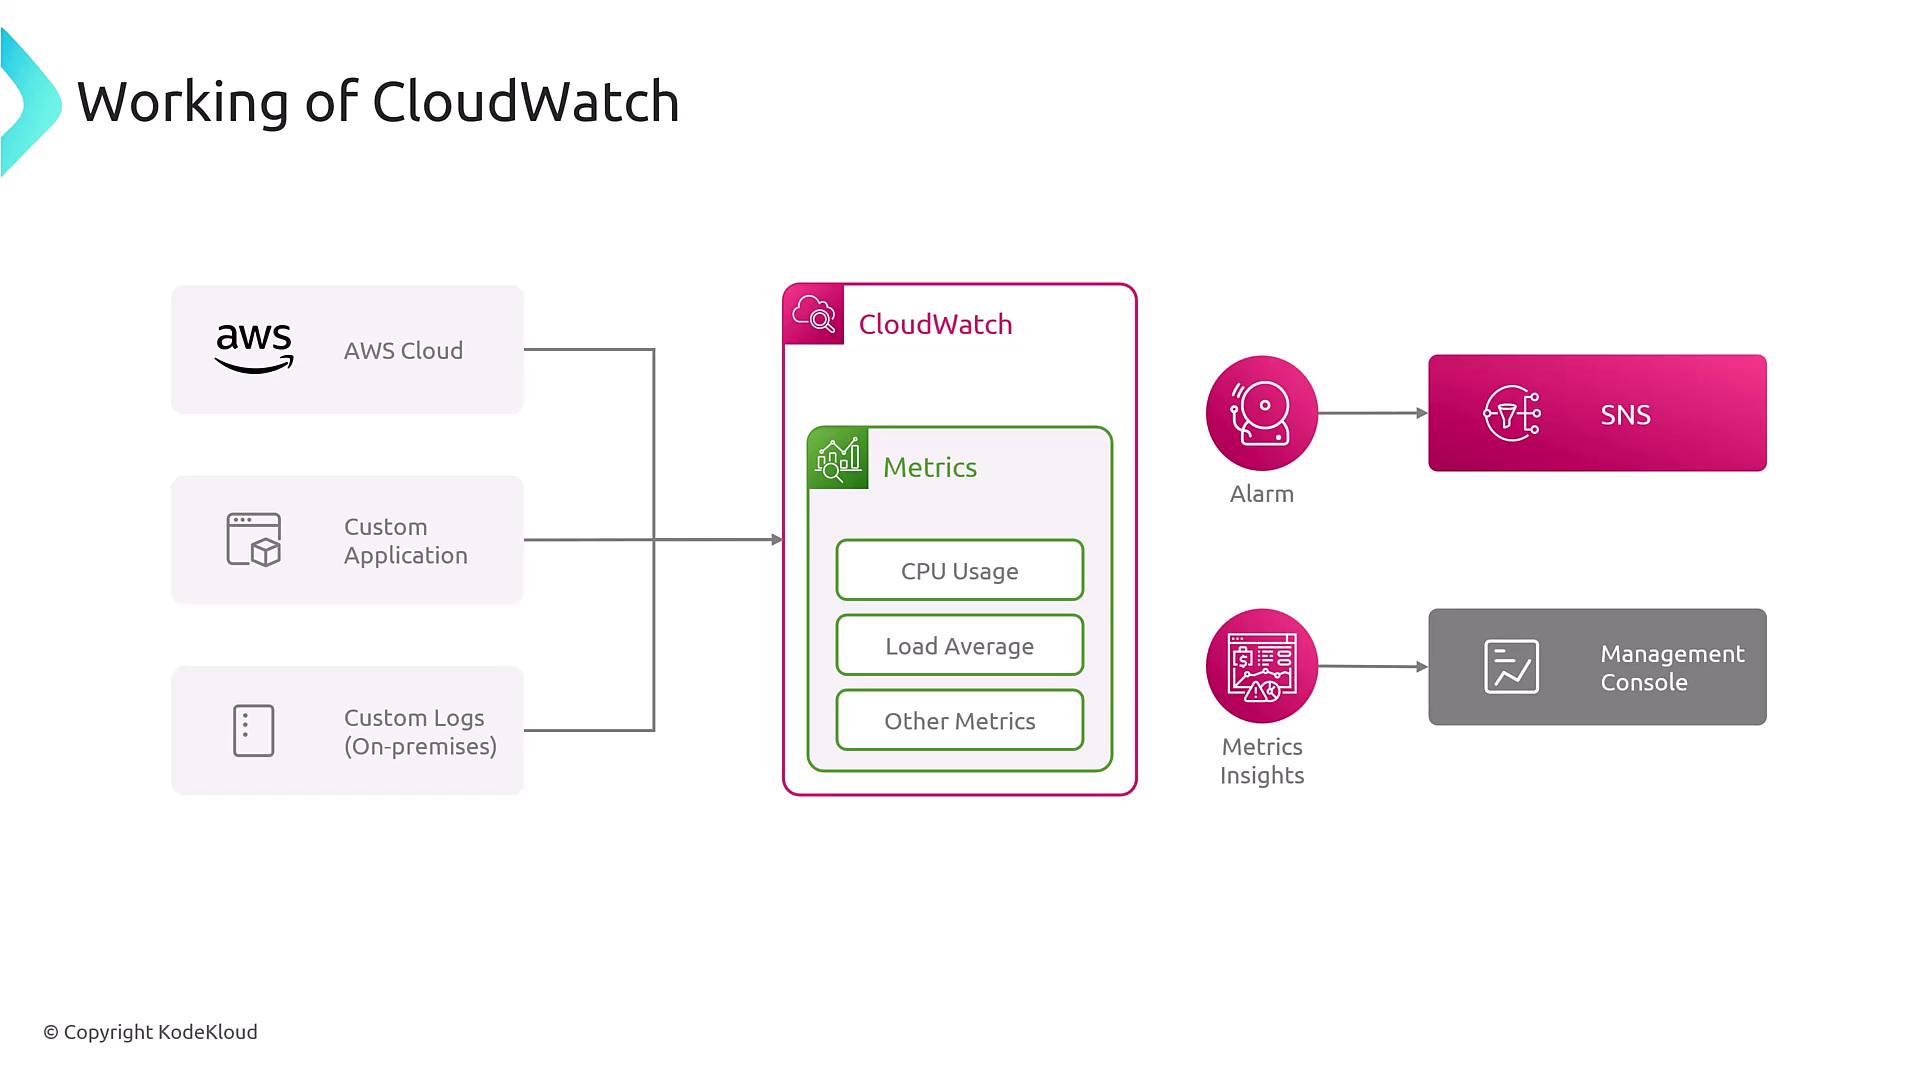
- Configure alarms with set thresholds (e.g., alert when CPU usage exceeds 85%) and automatically trigger notifications via the Simple Notification Service (SNS).
- Trending graphs of key metrics.
- Log insights for querying and analyzing log streams.
- Tracing capabilities for modern observability across distributed systems.
Key Components of CloudWatch
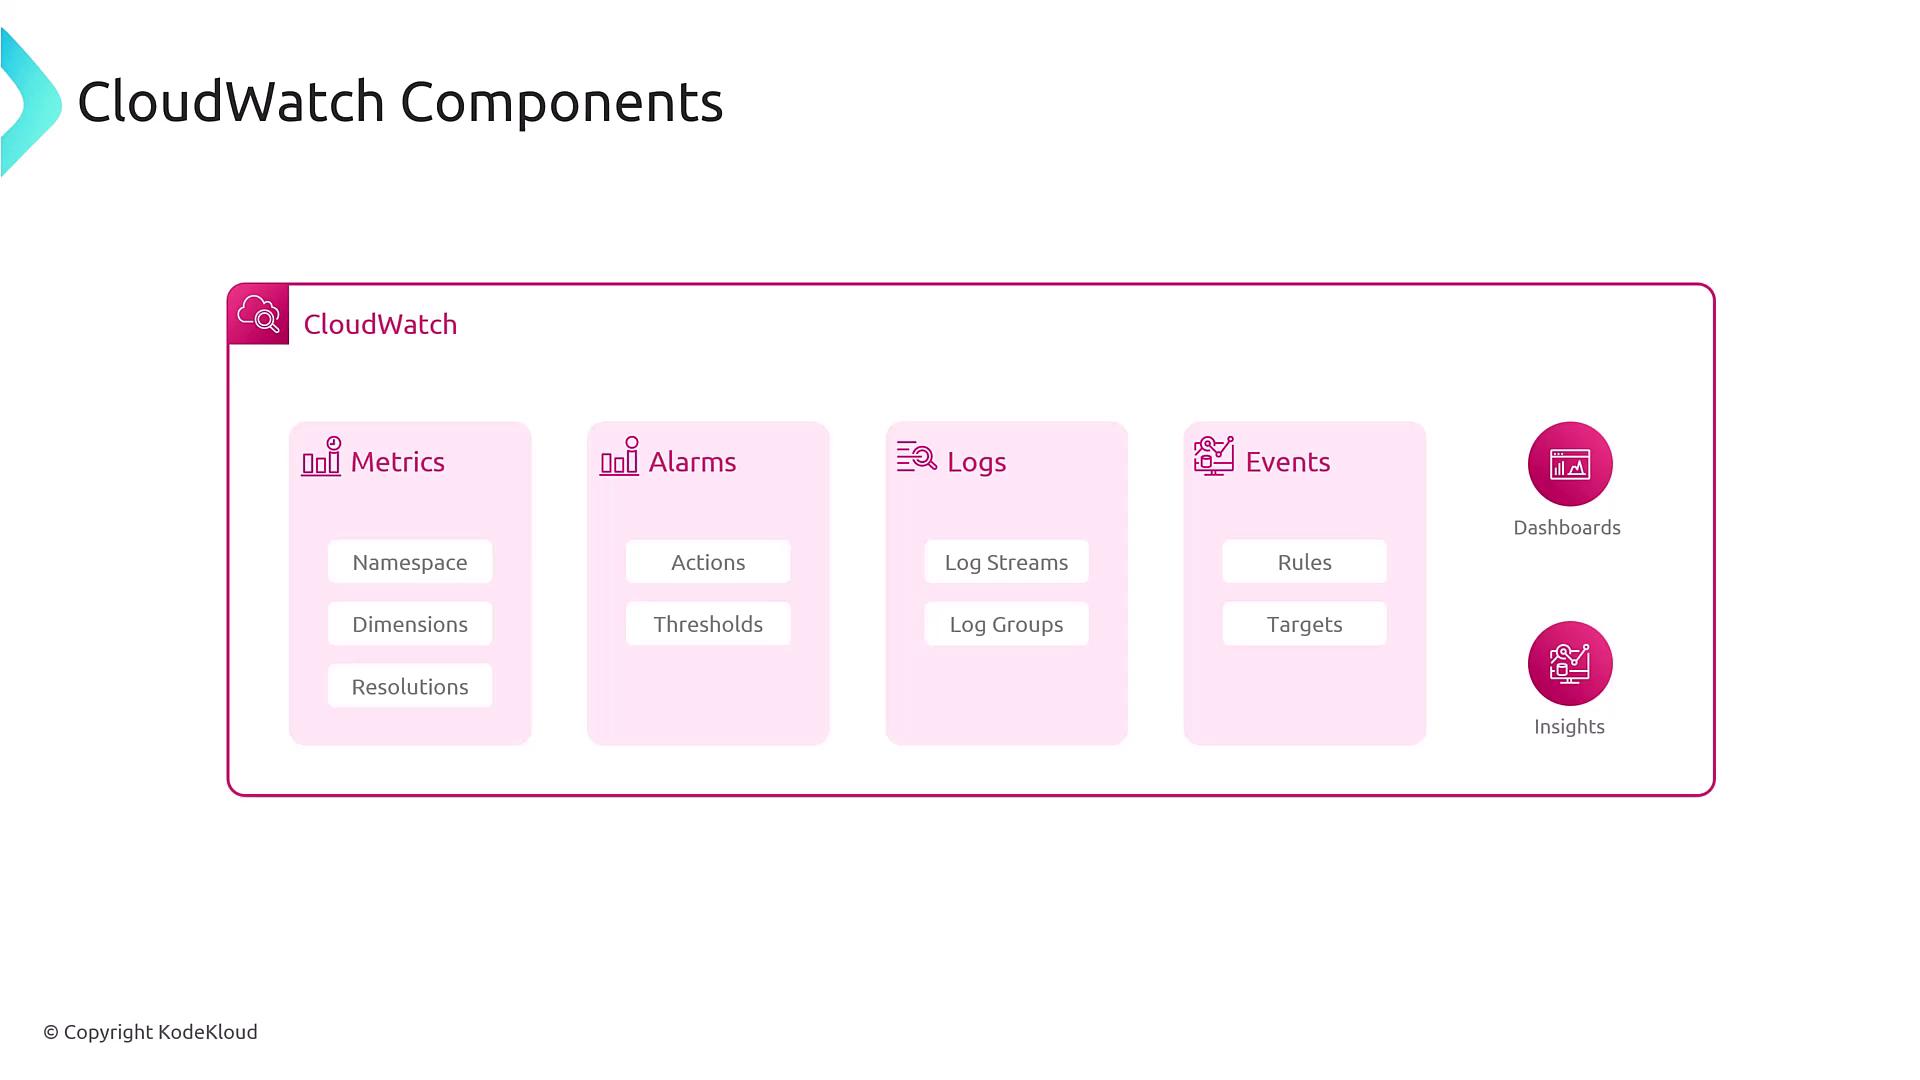
CloudWatch comprises several subservices that work together to provide comprehensive monitoring:- Metrics: Collect data with specific namespaces, dimensions, and resolutions (for example, CPU metrics can be reported every 30 seconds or every minute).
- Alarms: Define thresholds and automatically trigger actions when those thresholds are breached.
- Logs: Organize log streams into groups (such as by application or service) and use Log Insights for detailed analysis.
- Events: Process AWS or third-party events using custom rules that trigger specific targets.
- Dashboards: Create visualizations like pie charts, line charts, and historical trend graphs.
- Additional features: Leverage Synthetics, real-time user metrics, Container Insights, Serverless Insights, Service Mapping, and more.
CloudWatch not only collects and analyzes built-in metrics but also allows you to:
- Submit custom application metrics.
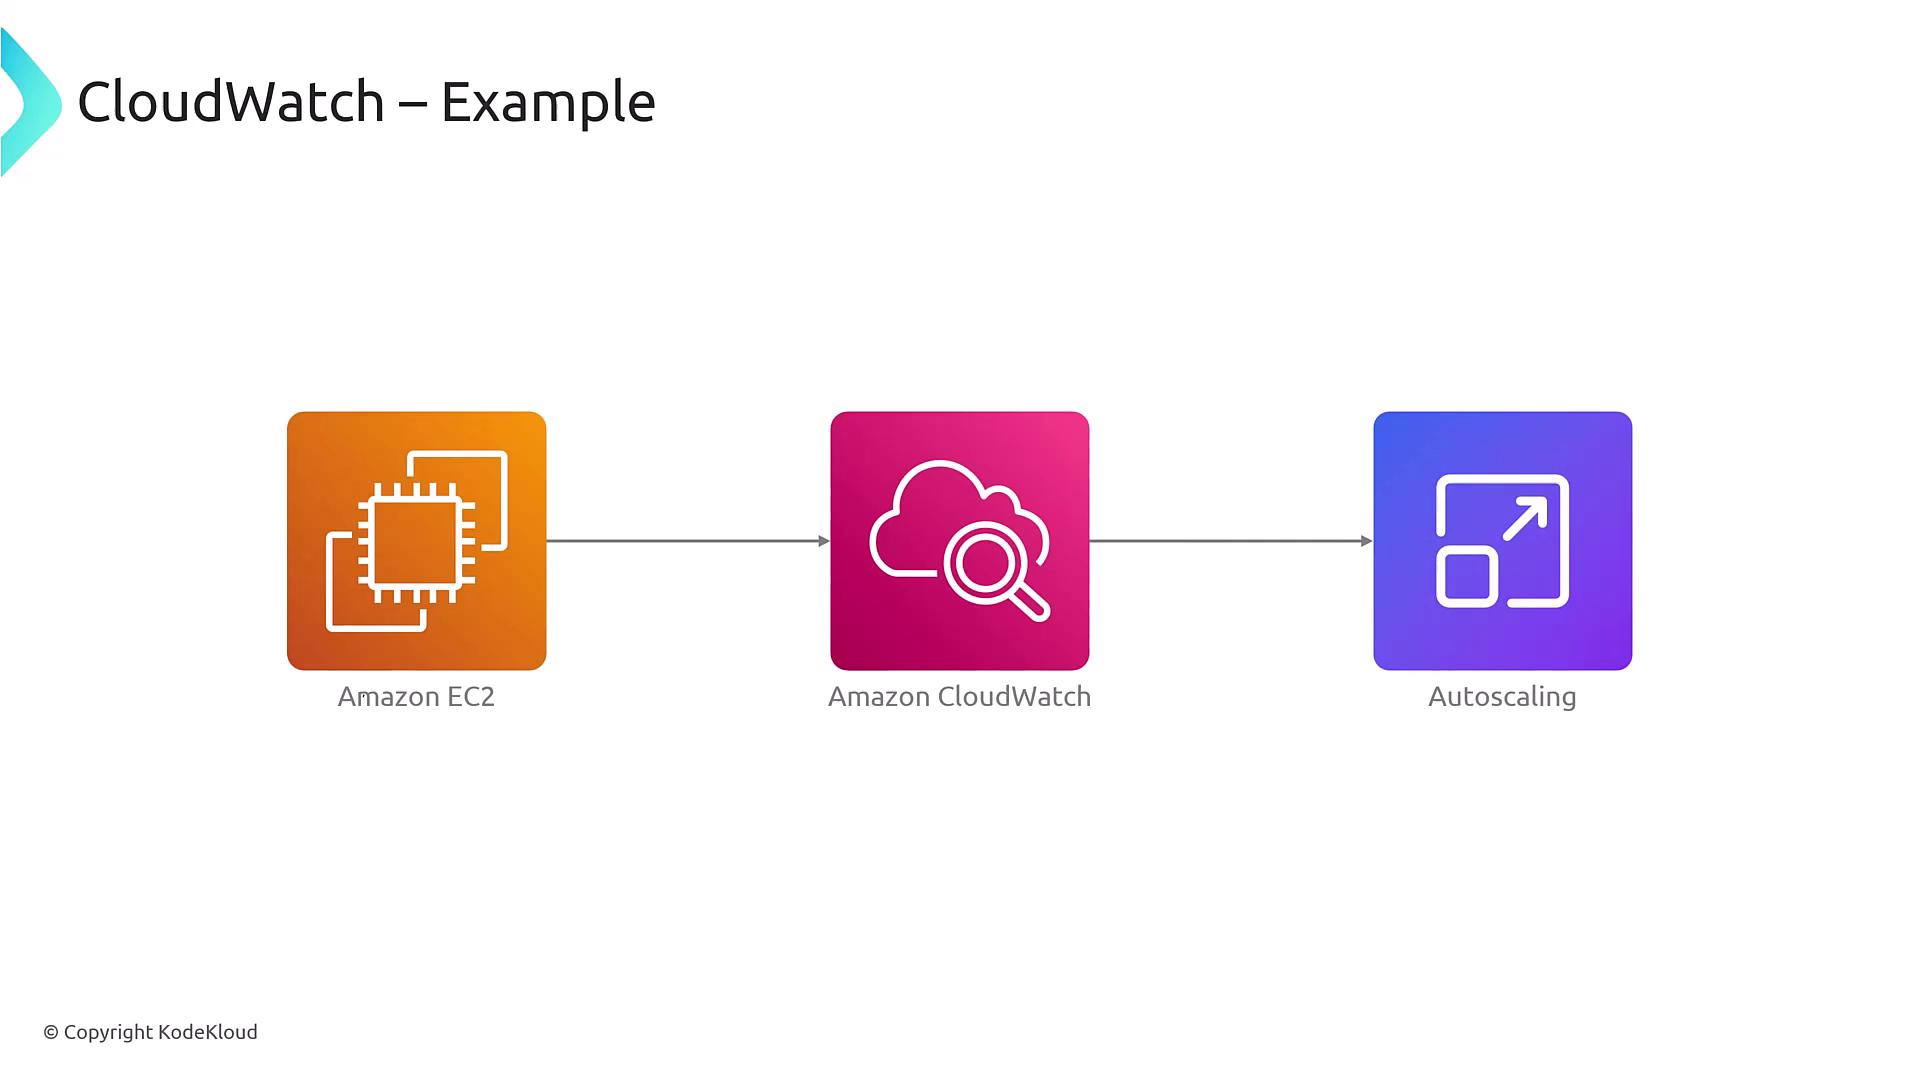
- Set alarms to automate response actions.
- Build detailed dashboards for containerized, serverless, and other service-specific insights.
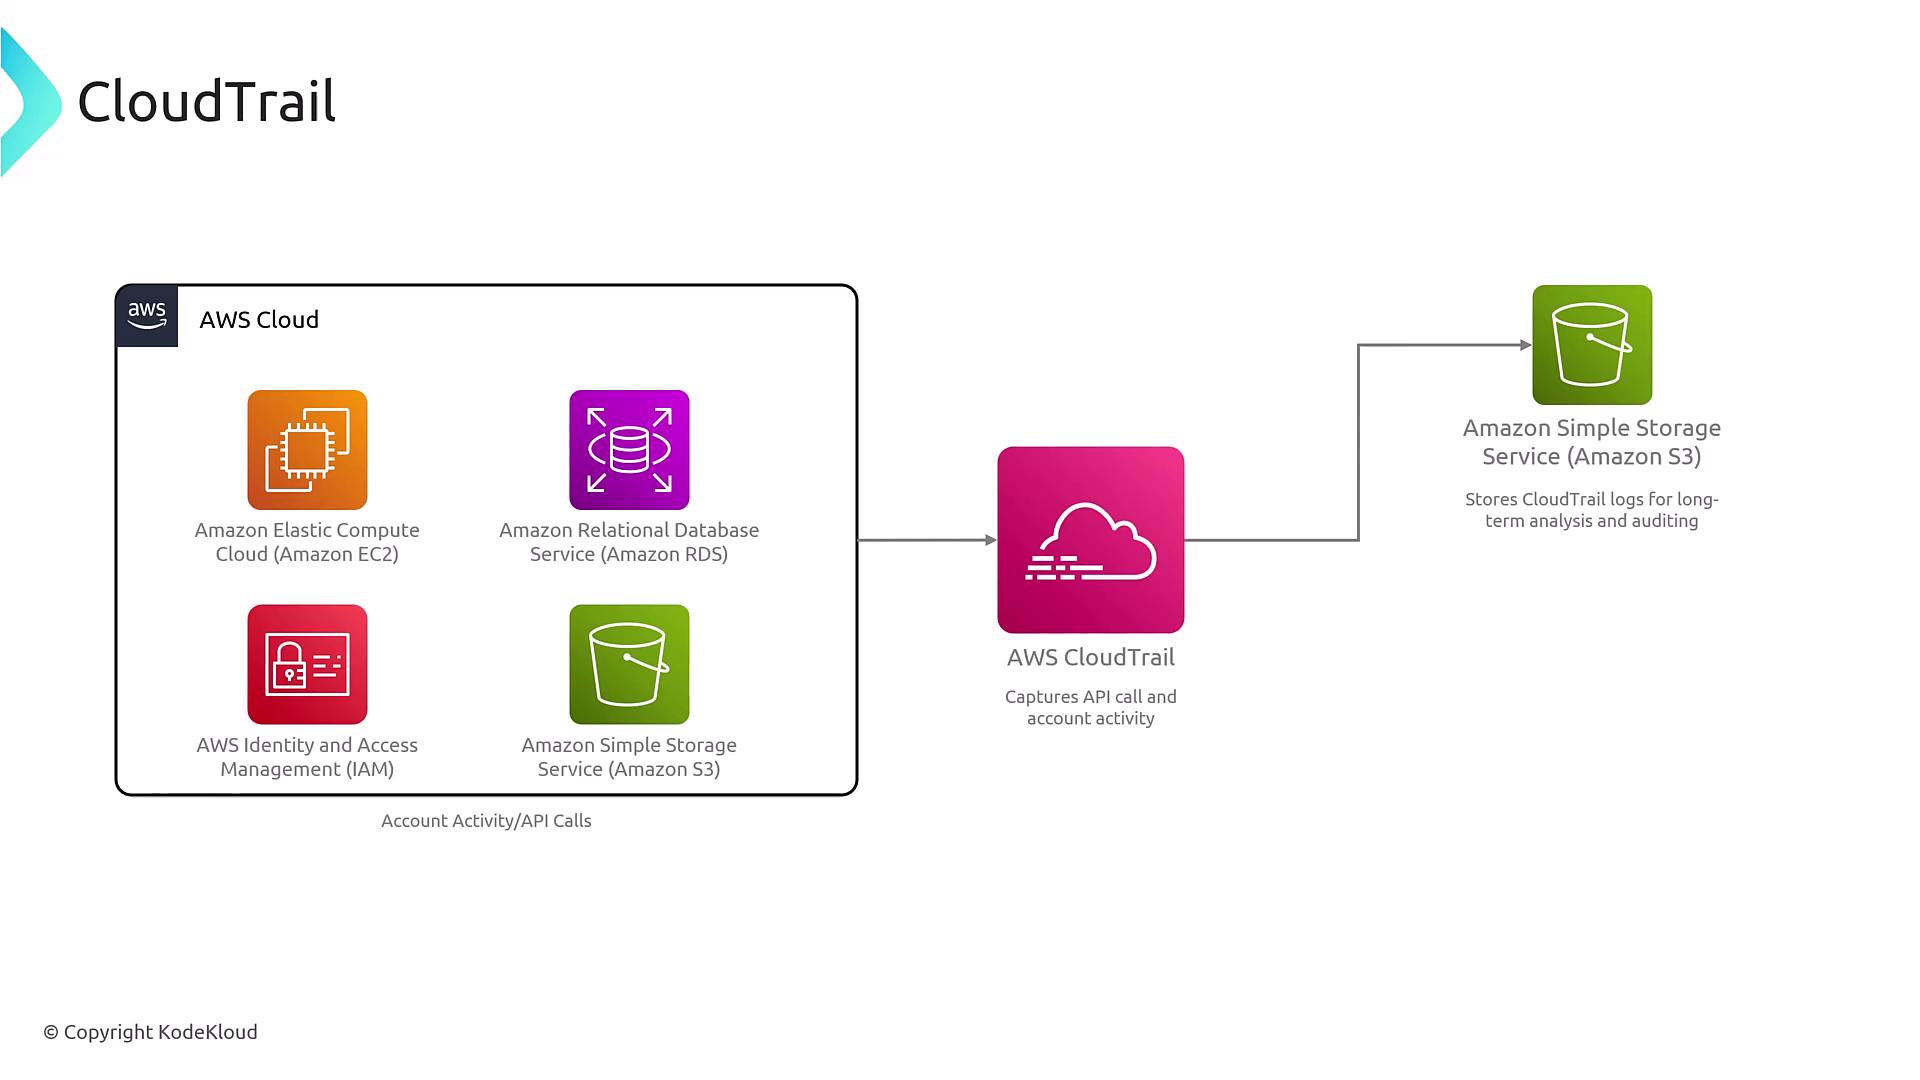
CloudTrail Overview
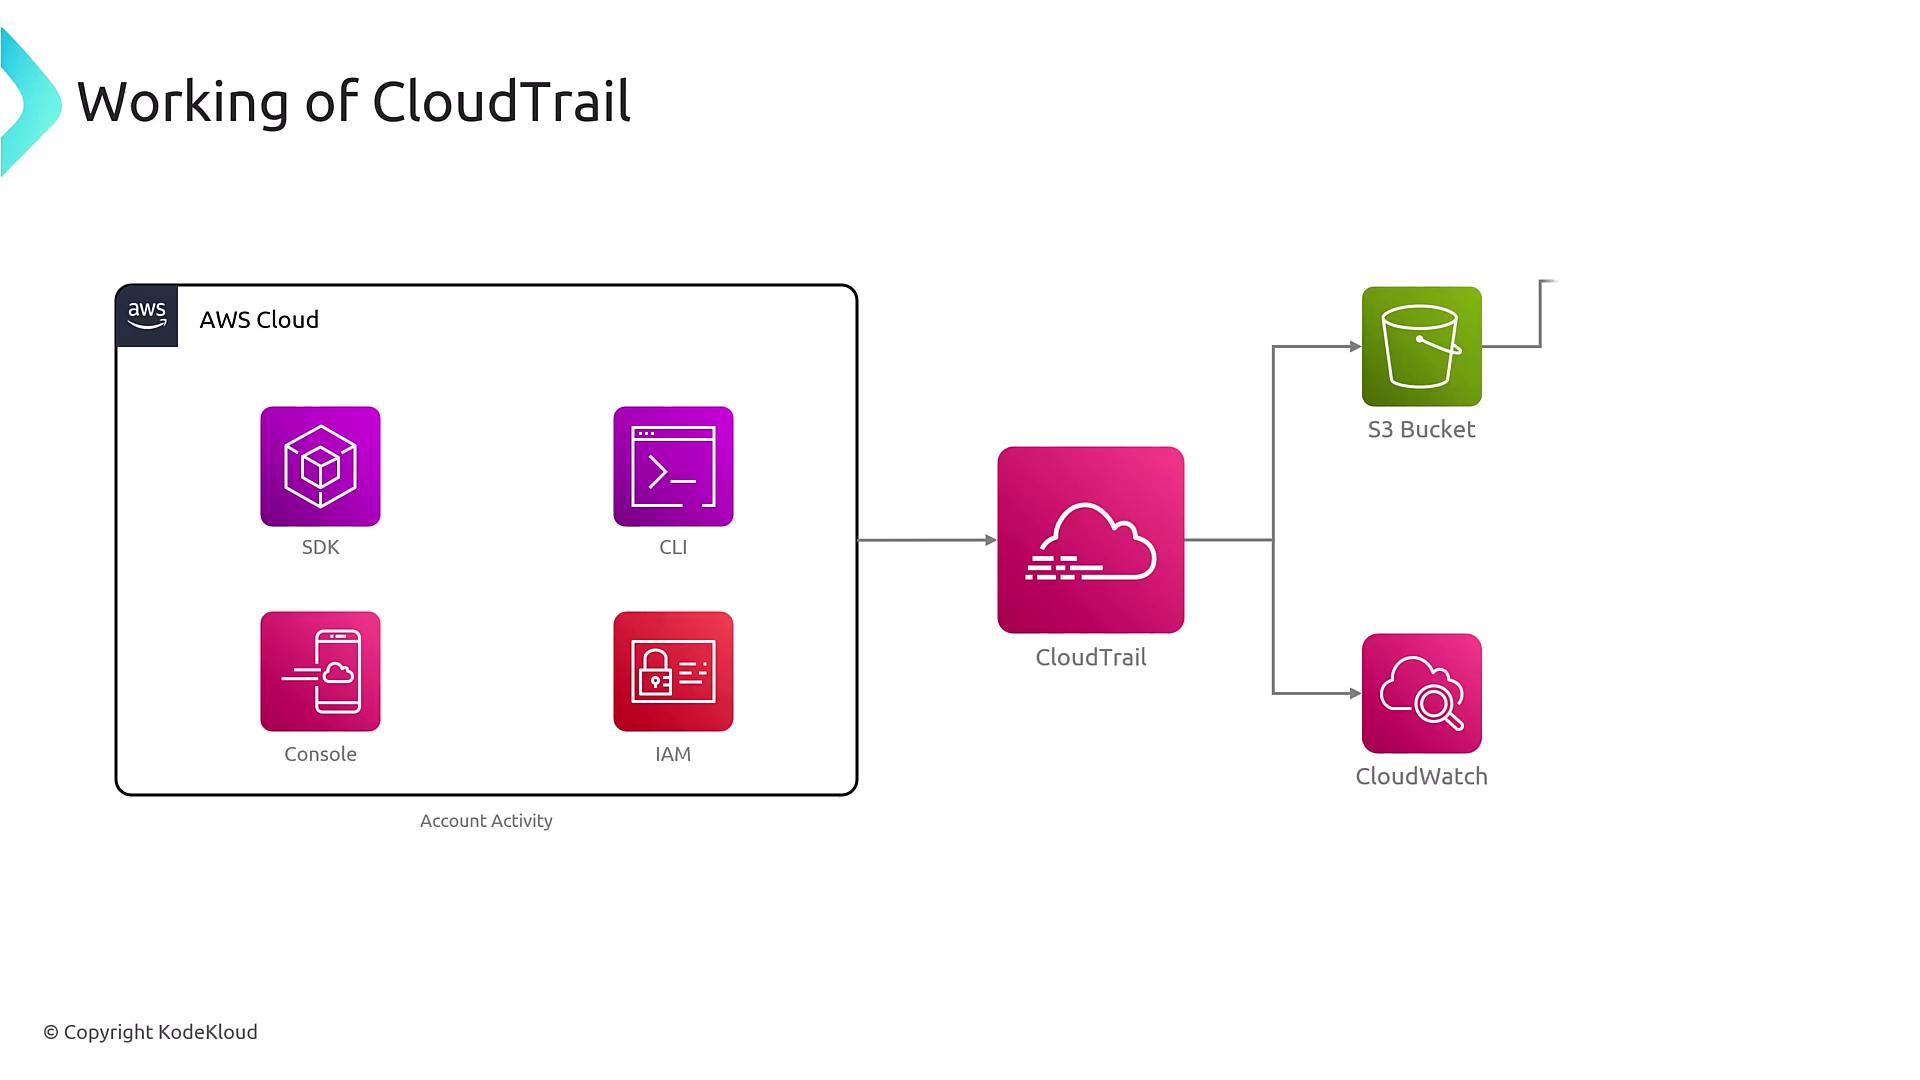
While CloudWatch focuses on real-time operational monitoring, CloudTrail specializes in recording API calls to deliver a detailed audit log of activities within your AWS account. This is critical for security analysis, compliance, and troubleshooting. CloudTrail tracks:- API calls made via the AWS CLI, SDKs, and Console actions.
- API events associated with managed services, such as those from Systems Manager.
- Changes to your AWS infrastructure, like launching or stopping an EC2 instance or updating an RDS instance.
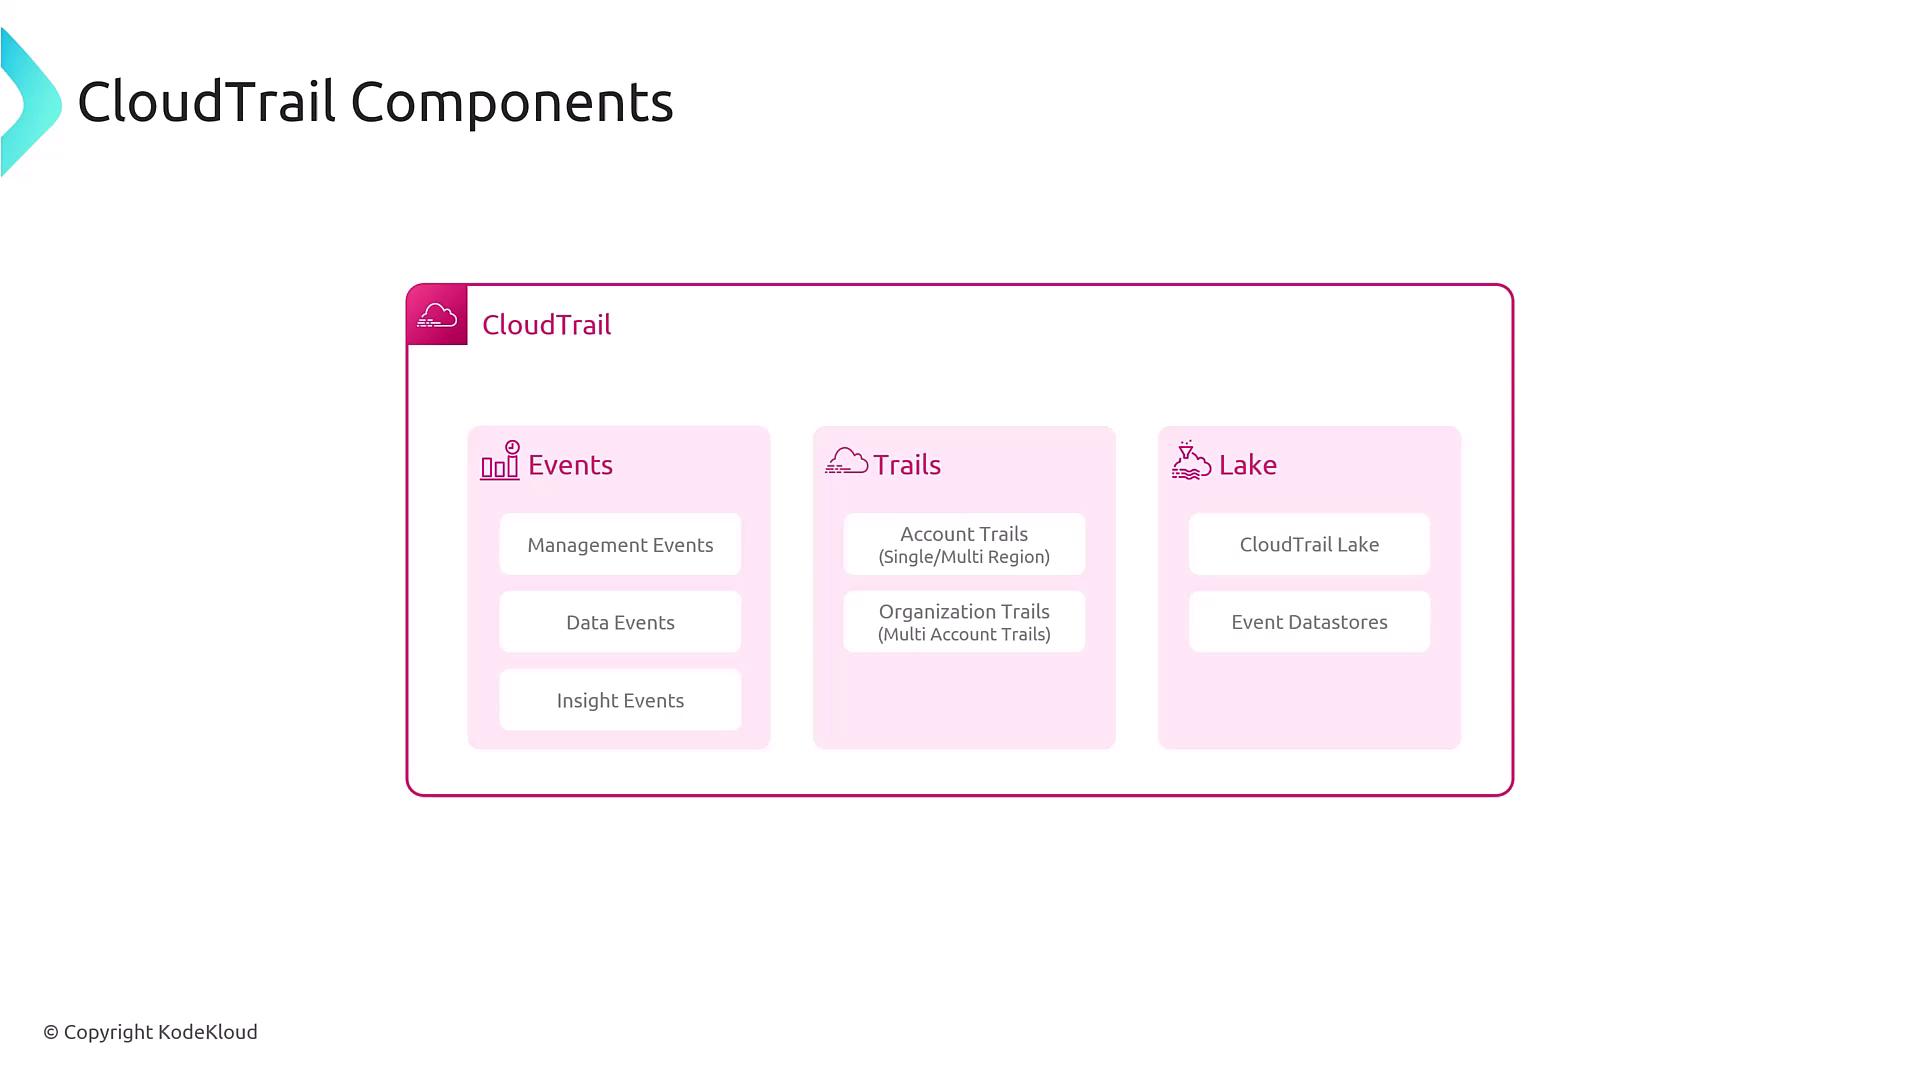
Key Components of CloudTrail
CloudTrail is built around several core components:- Events: Capture every API call including management, data, and insight events.
- Trails: Store the captured events. Trails can be set up globally, per account, or organization-wide, covering single or multiple regions.
- CloudTrail Lake: A feature designed for efficient storage and analysis of large volumes of CloudTrail log data.
Summary
- CloudWatch delivers a robust observability suite by collecting and analyzing metrics, logs, and traces from AWS and on-premises resources. It supports automated alarms, detailed dashboards, and rich insights into system performance.
- CloudTrail provides a thorough audit trail by logging all API calls across your AWS environment. This ensures that you can track changes, monitor user actions, and maintain security and compliance.
CloudWatch and CloudTrail complement each other: while CloudWatch offers real-time insights into performance and health, CloudTrail ensures a complete and verifiable audit trail of all API activities in your AWS environment.