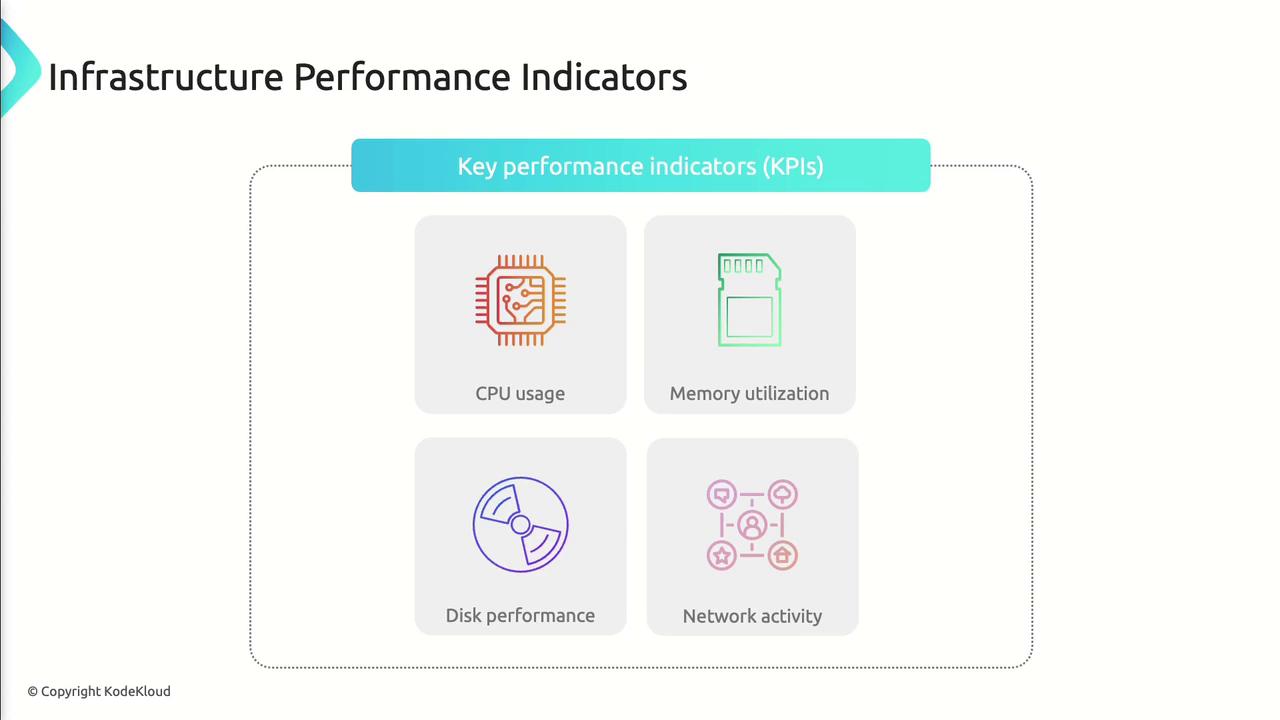
| Metric | Why It Matters | Azure Tools |
|---|---|---|
| CPU | Measures compute load and identifies processing bottlenecks | Azure Monitor, Azure Metrics |
| Memory | Tracks RAM consumption to prevent slowdowns and crashes | Azure Monitor, Azure Metrics |
| Disk | Monitors IOPS, latency, and throughput for data operations | Azure Storage Metrics, Azure Monitor |
| Network | Analyzes bandwidth, latency, and packet loss for connectivity | Azure Network Watcher, Network Performance Monitor |
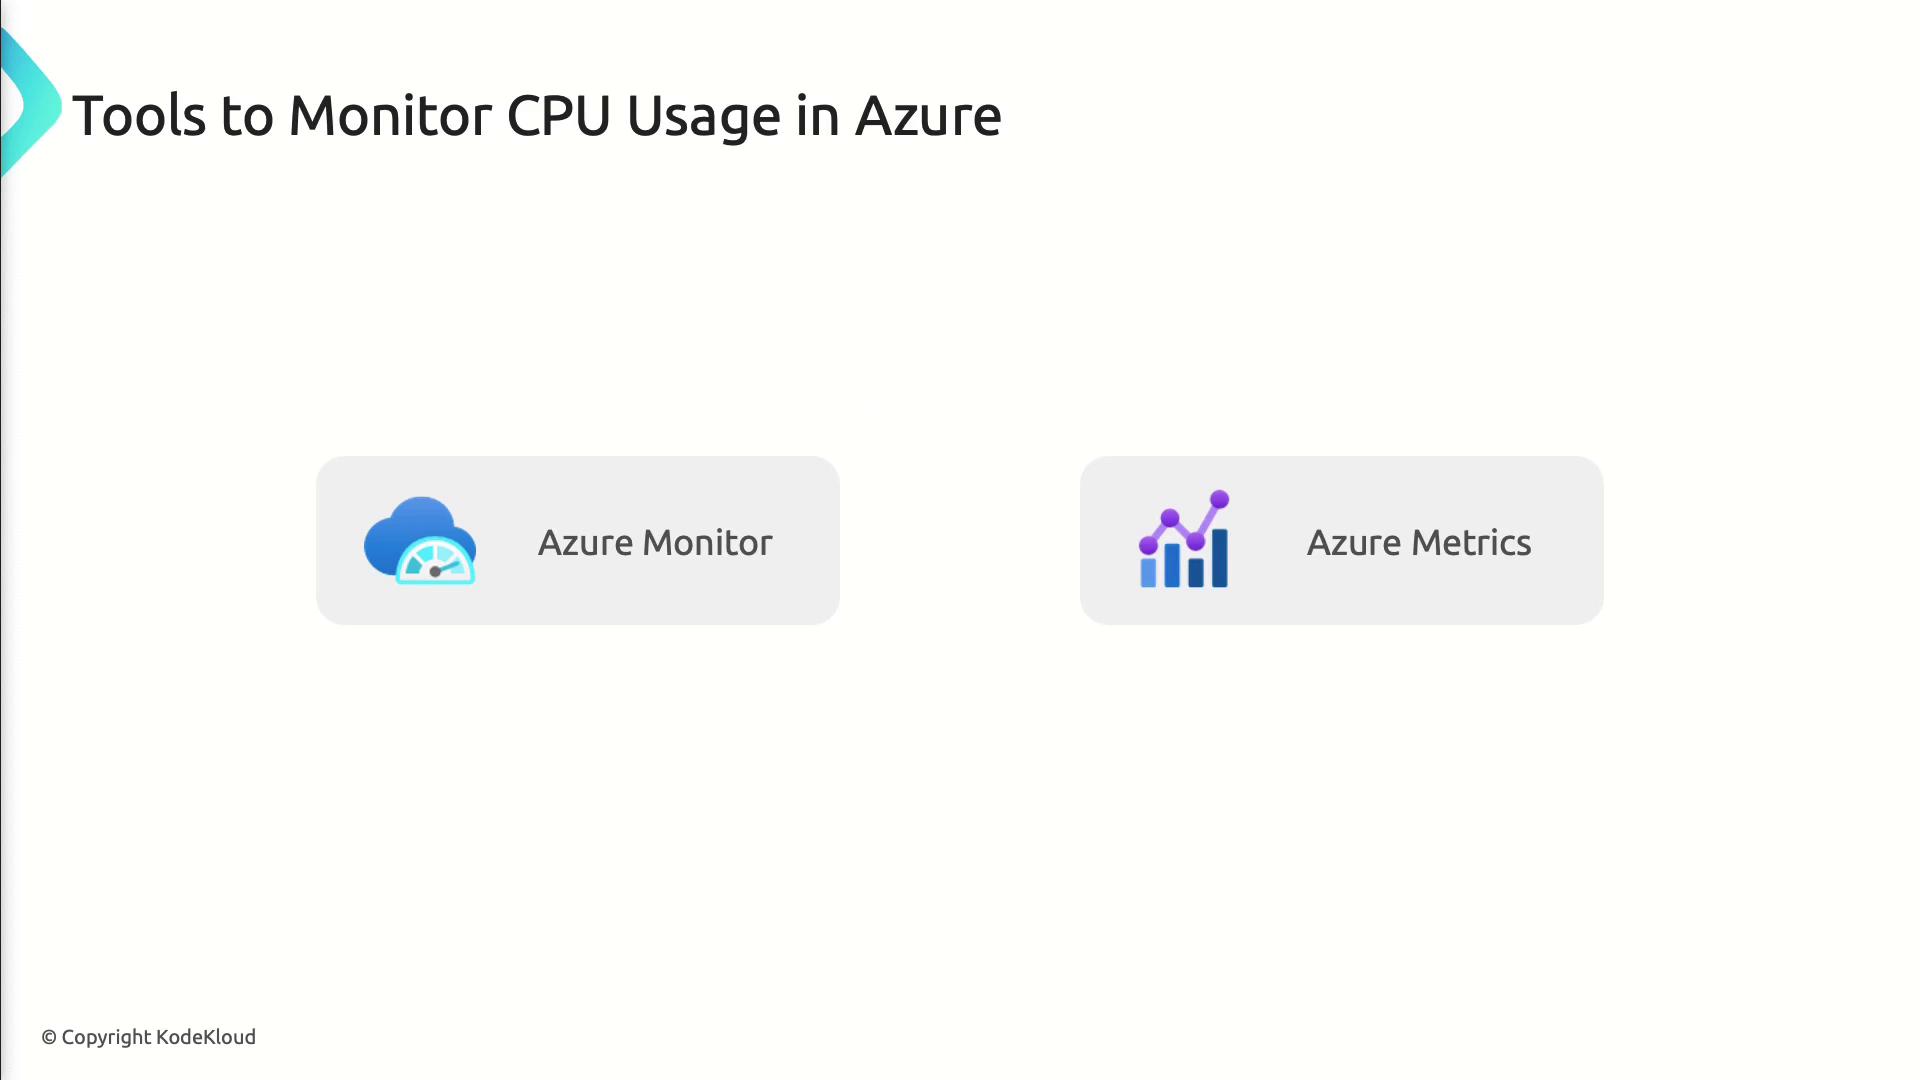
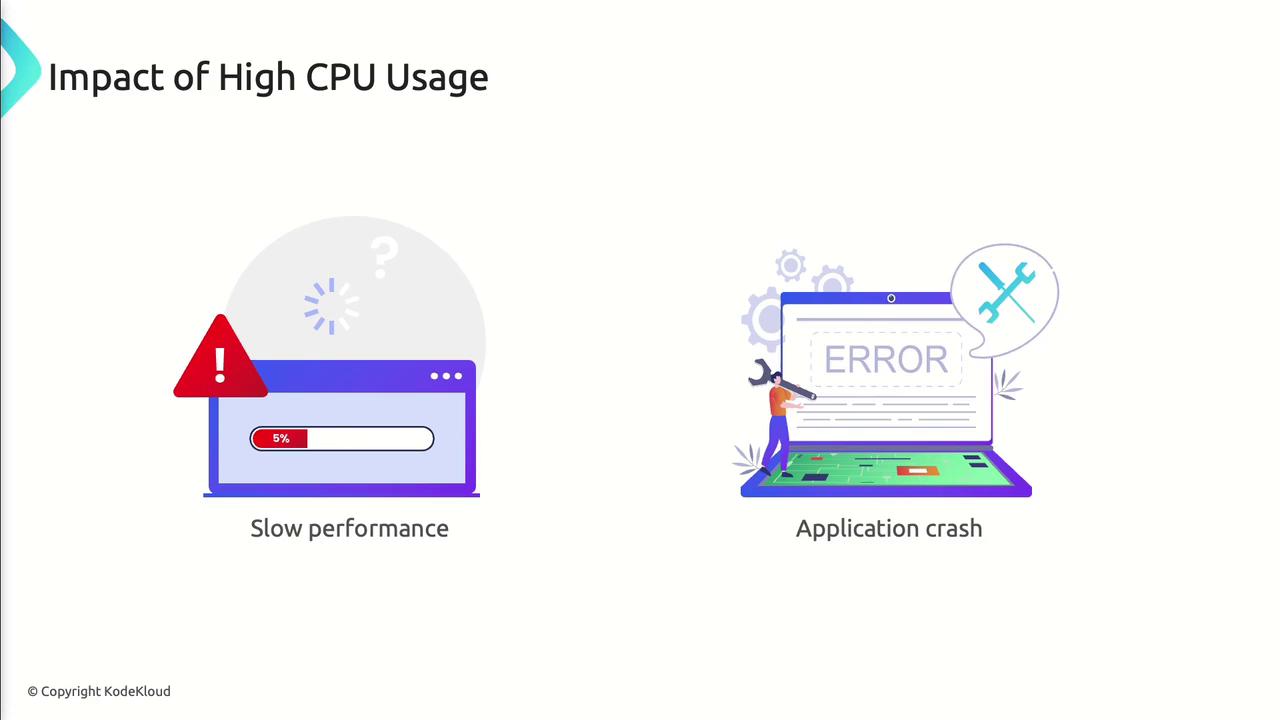
CPU Performance
CPU performance reflects the percentage of processing capacity your workloads consume. Sustained high CPU can lead to slow response times and application failures.
- Slow response times
- Increased processing latency
- Application crashes
Practical Example: Alerting on CPU Spikes
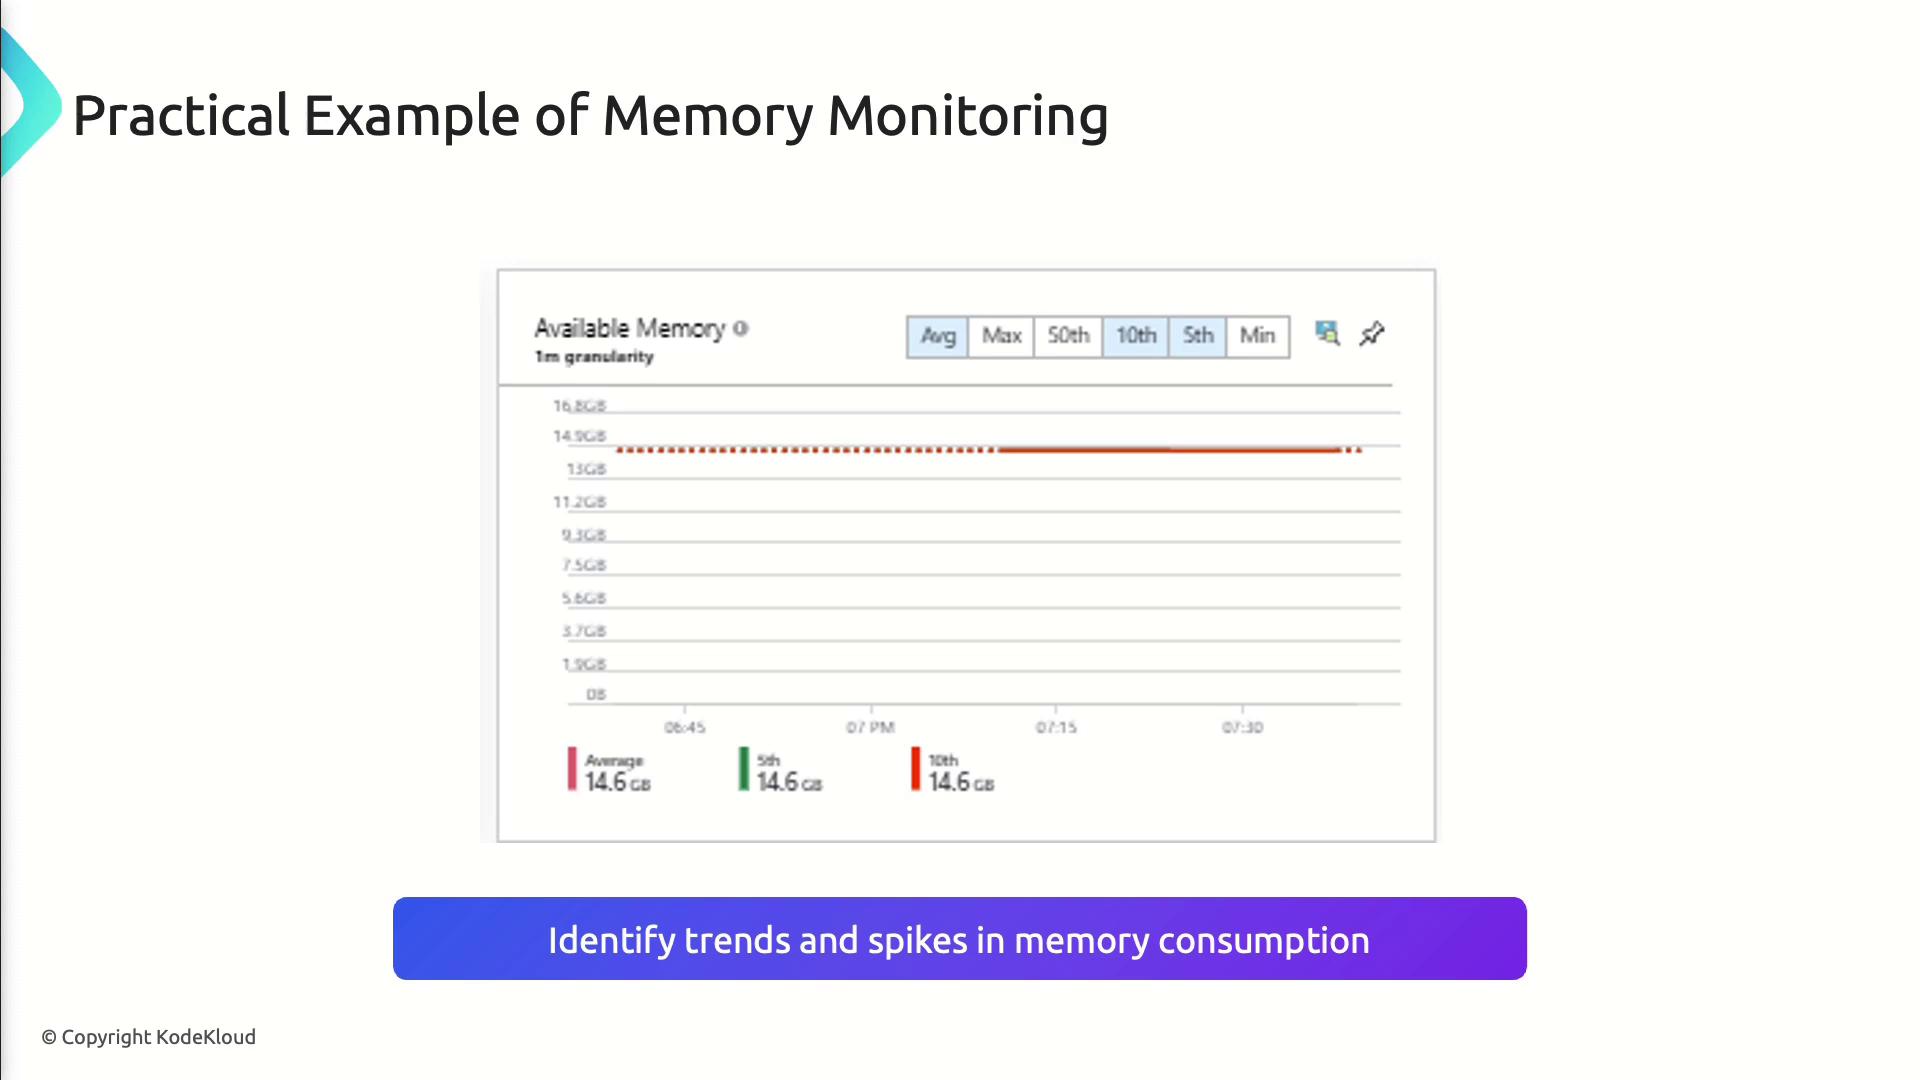
Memory Utilization
Memory utilization shows how much RAM your applications consume. Excessive memory usage can trigger slowdowns or out-of-memory errors.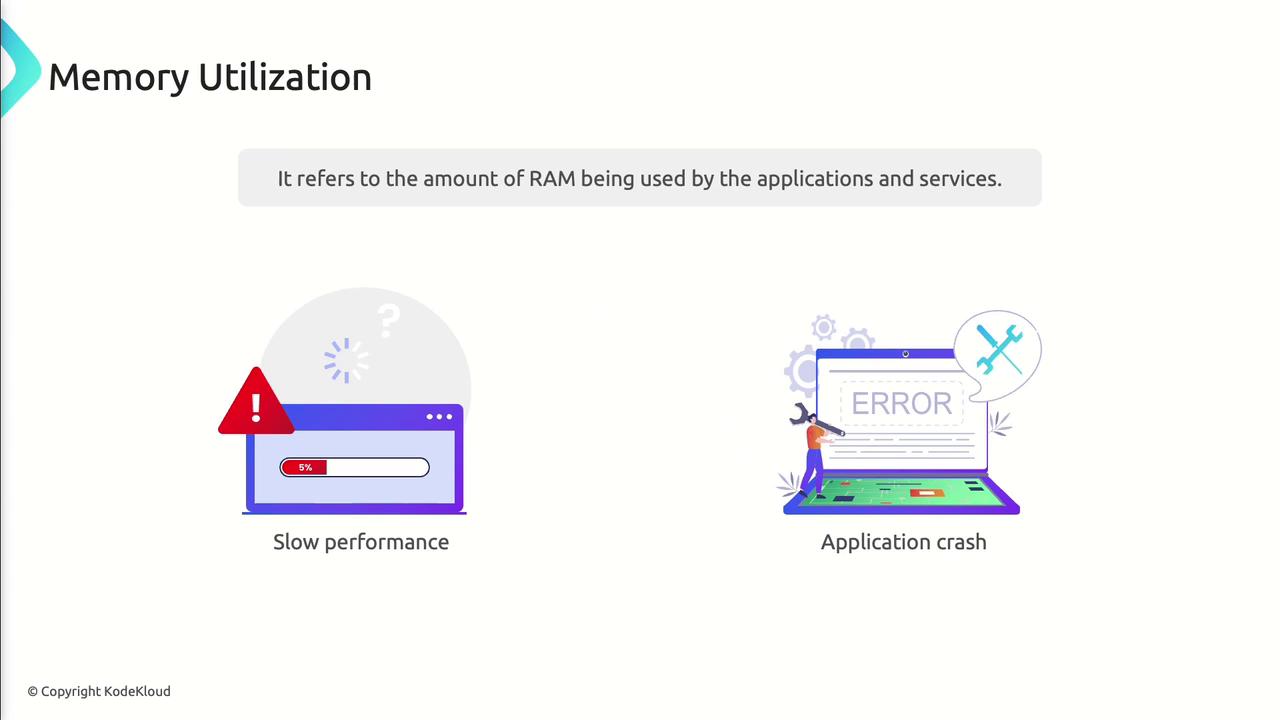
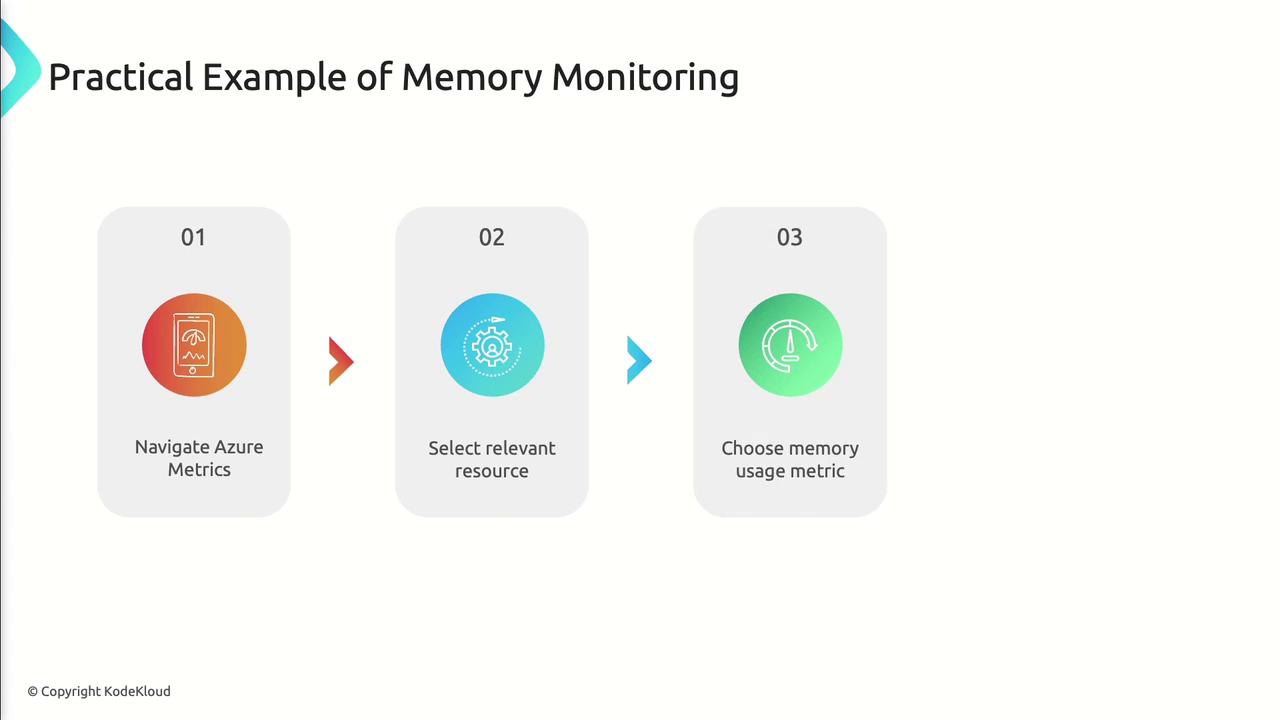
How to Monitor Memory
- In Azure Portal, navigate to Azure Metrics.
- Select your target resource (e.g., VM, Web App).
- Add the Memory Usage metric to a chart.
- Configure an alert on critical thresholds.
- Optimize code to release unused memory
- Scale up the VM or App Service plan if needed
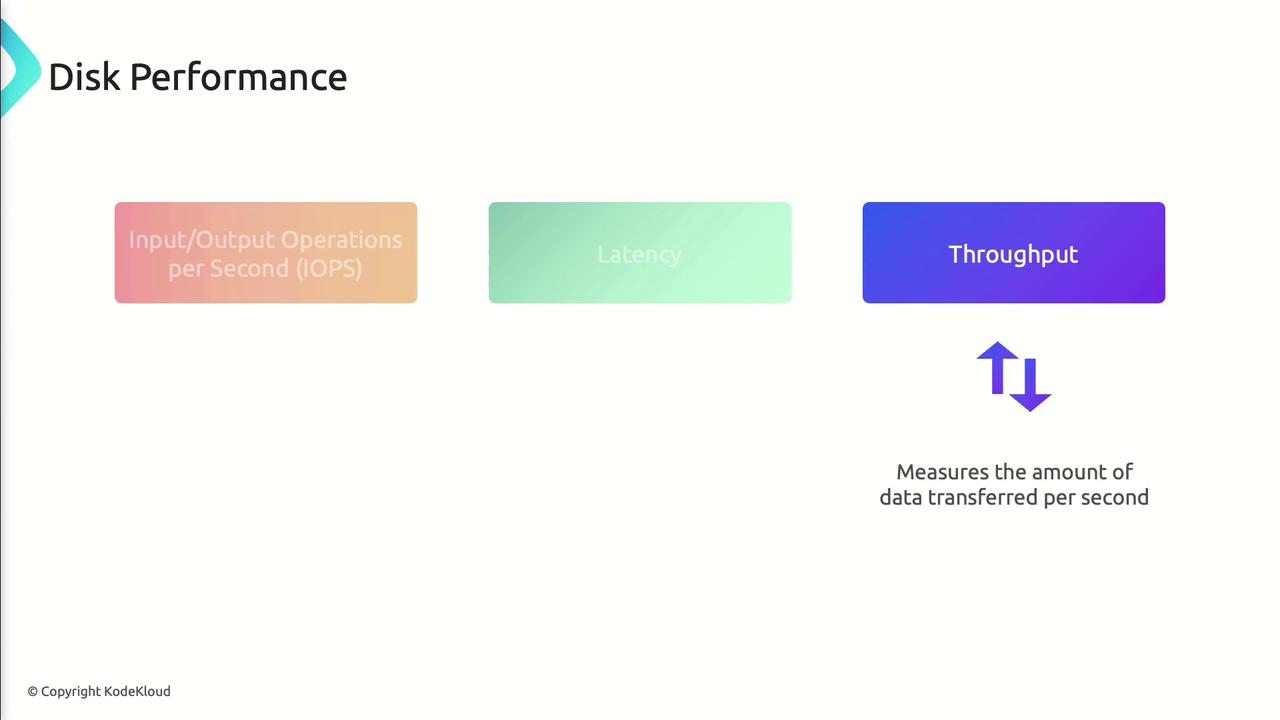
Disk Performance
Disk performance metrics gauge how efficiently your storage layer handles read/write operations—vital for data-intensive workloads.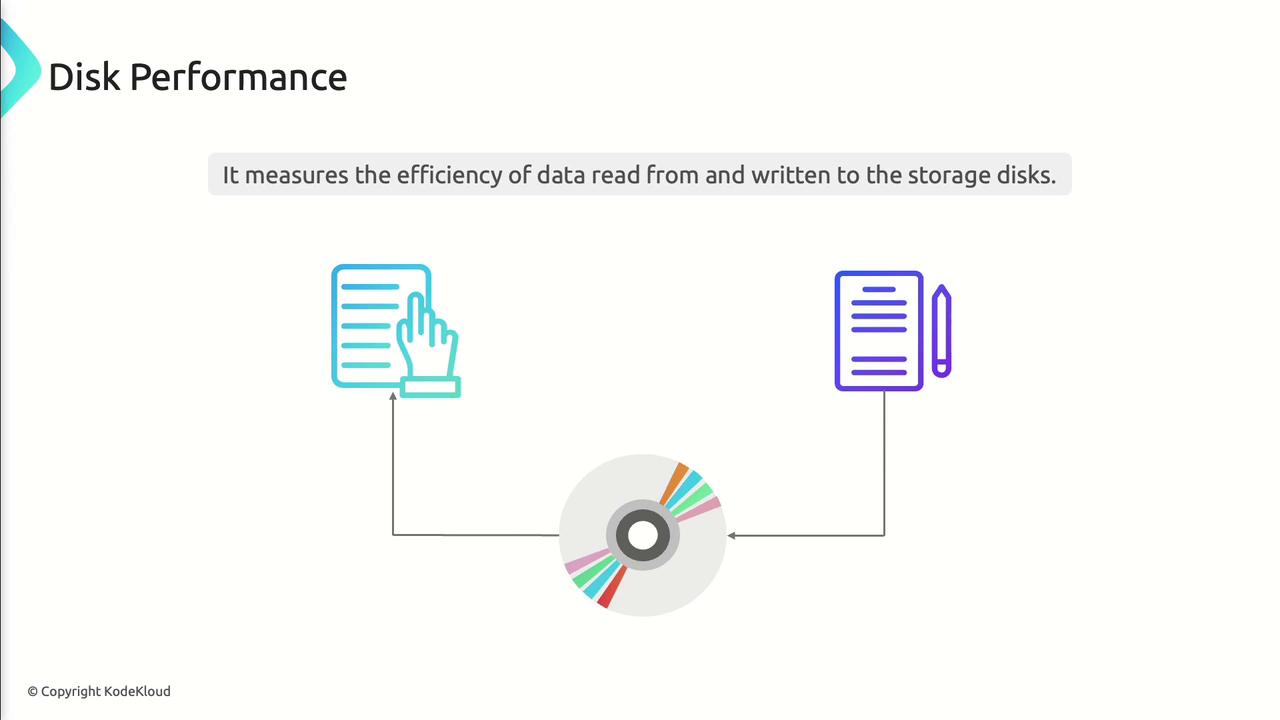
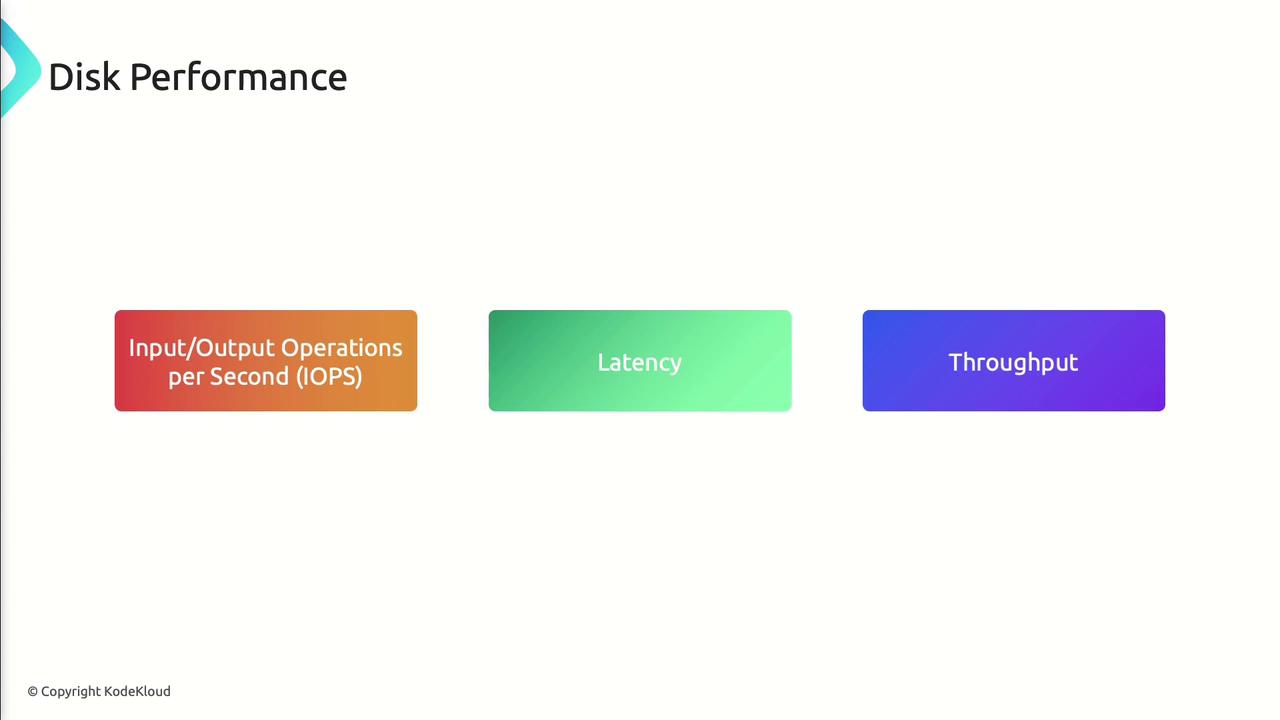
Key Disk Metrics
| Metric | Description |
|---|---|
| IOPS | Input/Output Operations per Second |
| Latency | Time taken for each read/write request |
| Throughput | Volume of data transferred per second |

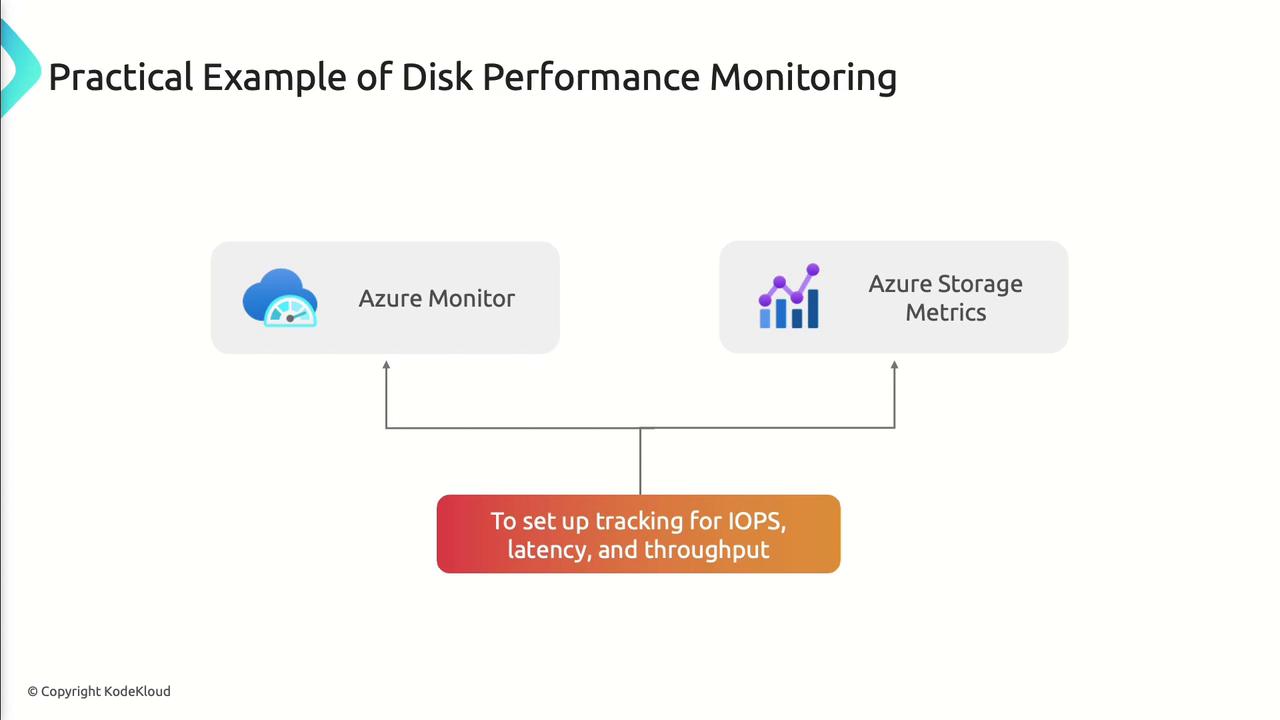
Monitoring Disk Performance
- Enable metrics for IOPS, latency, and throughput on your storage account or managed disk.
- Use Azure Monitor and Azure Storage Metrics to chart and alert.
- Set thresholds (e.g., latency > 20 ms) to trigger notifications.
- Upgrade to Premium or Ultra disks
- Use striping and caching for high-throughput scenarios
- Implement an in-memory or CDN cache for hot data
Network Performance
Network performance determines how swiftly and reliably data travels across your Azure resources and to end users. Key metrics:- Bandwidth: Maximum data transfer rate
- Latency: Round-trip time between endpoints
- Packet Loss: Percentage of dropped packets
Monitoring with Azure Network Watcher
- Enable Network Watcher in your subscription.
- Use Connection Monitor to assess latency and packet loss.
- Review bandwidth usage on each virtual NIC.


- Optimize routing, peering, and gateway configurations
- Increase bandwidth allocation for high-traffic workloads
- Apply QoS policies to prioritize mission-critical packets
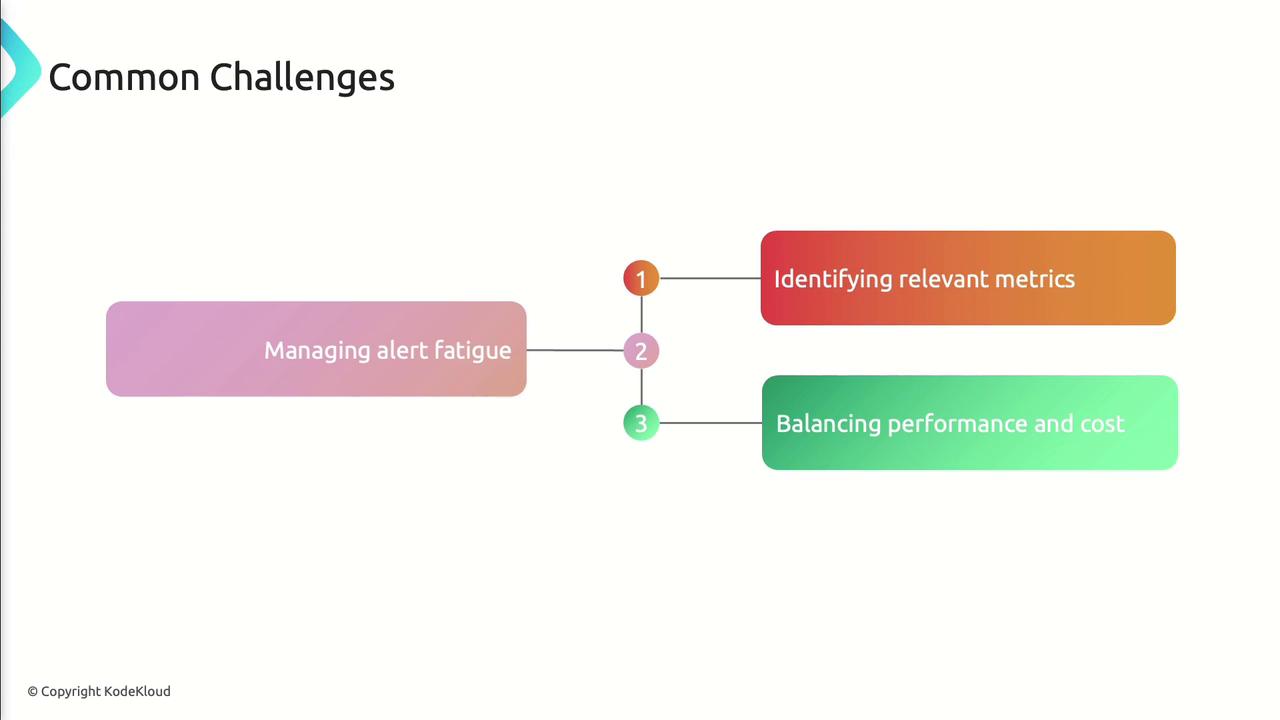
Benefits and Common Challenges
Proactive monitoring helps you:- Detect issues before they impact users
- Optimize resource allocation and reduce costs
- Maintain consistent performance under load
- Alert fatigue from too many notifications
- Difficulty selecting the most relevant metrics
- Balancing performance improvements with budget constraints
References
- Azure Monitor documentation
- Azure Metrics in Azure Portal
- Azure Network Watcher overview
- AZ-400 Exam Guide