Viewing an Existing Dashboard
- Sign in to Azure DevOps and select your project (e.g., KodeKloud Hotel).
- In the left navigation, click Dashboards.
- Any dashboards created for this project will appear.
Assigning a Work Item and Seeing Live Updates
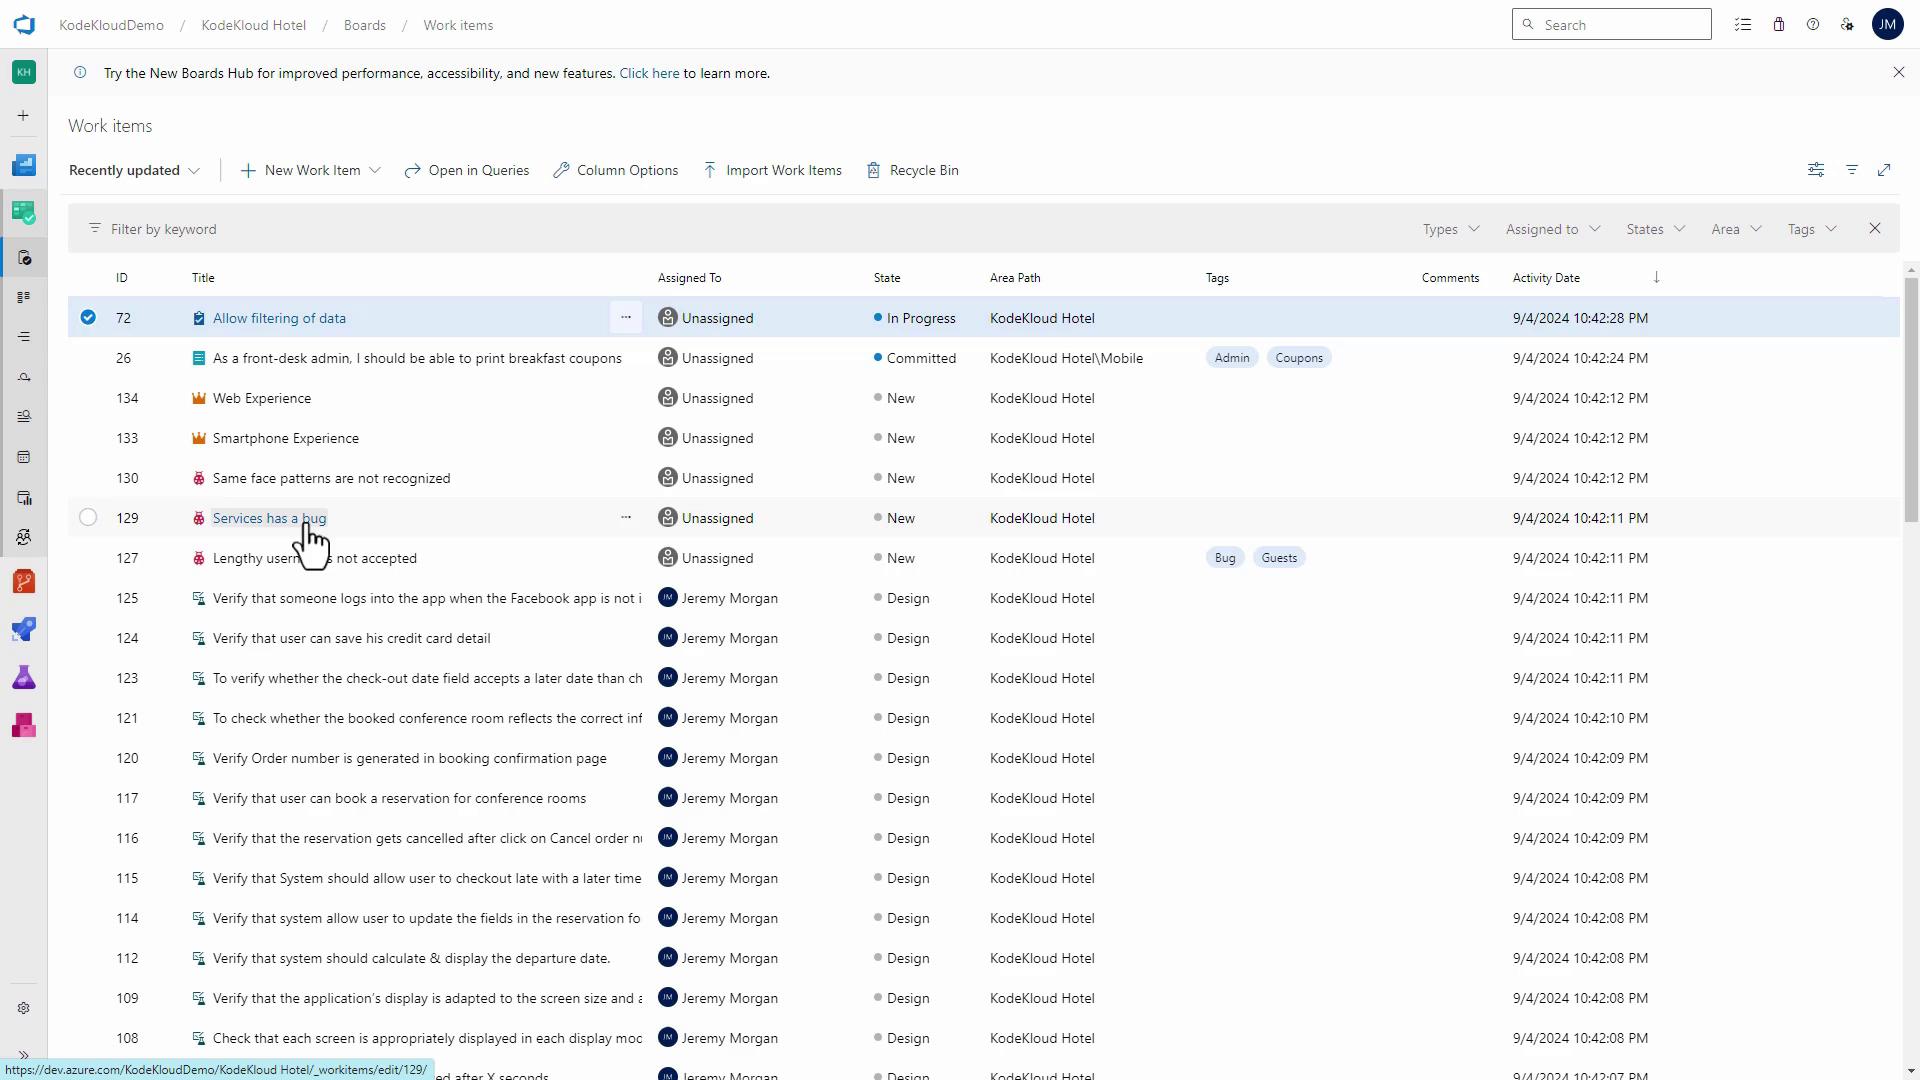
Simulate a live update to verify automatic refresh:- Go to Boards > Work Items in the left menu.
- Find a work item (e.g., “Services has a bug.”).
- Open it, assign it to yourself (e.g., Jeremy Morgan), and save.
Creating a New Dashboard
- In the Dashboards view, click New Dashboard.
- Enter a name and click Create.
- A grid canvas appears, representing widget slots—each occupies one or more cells.
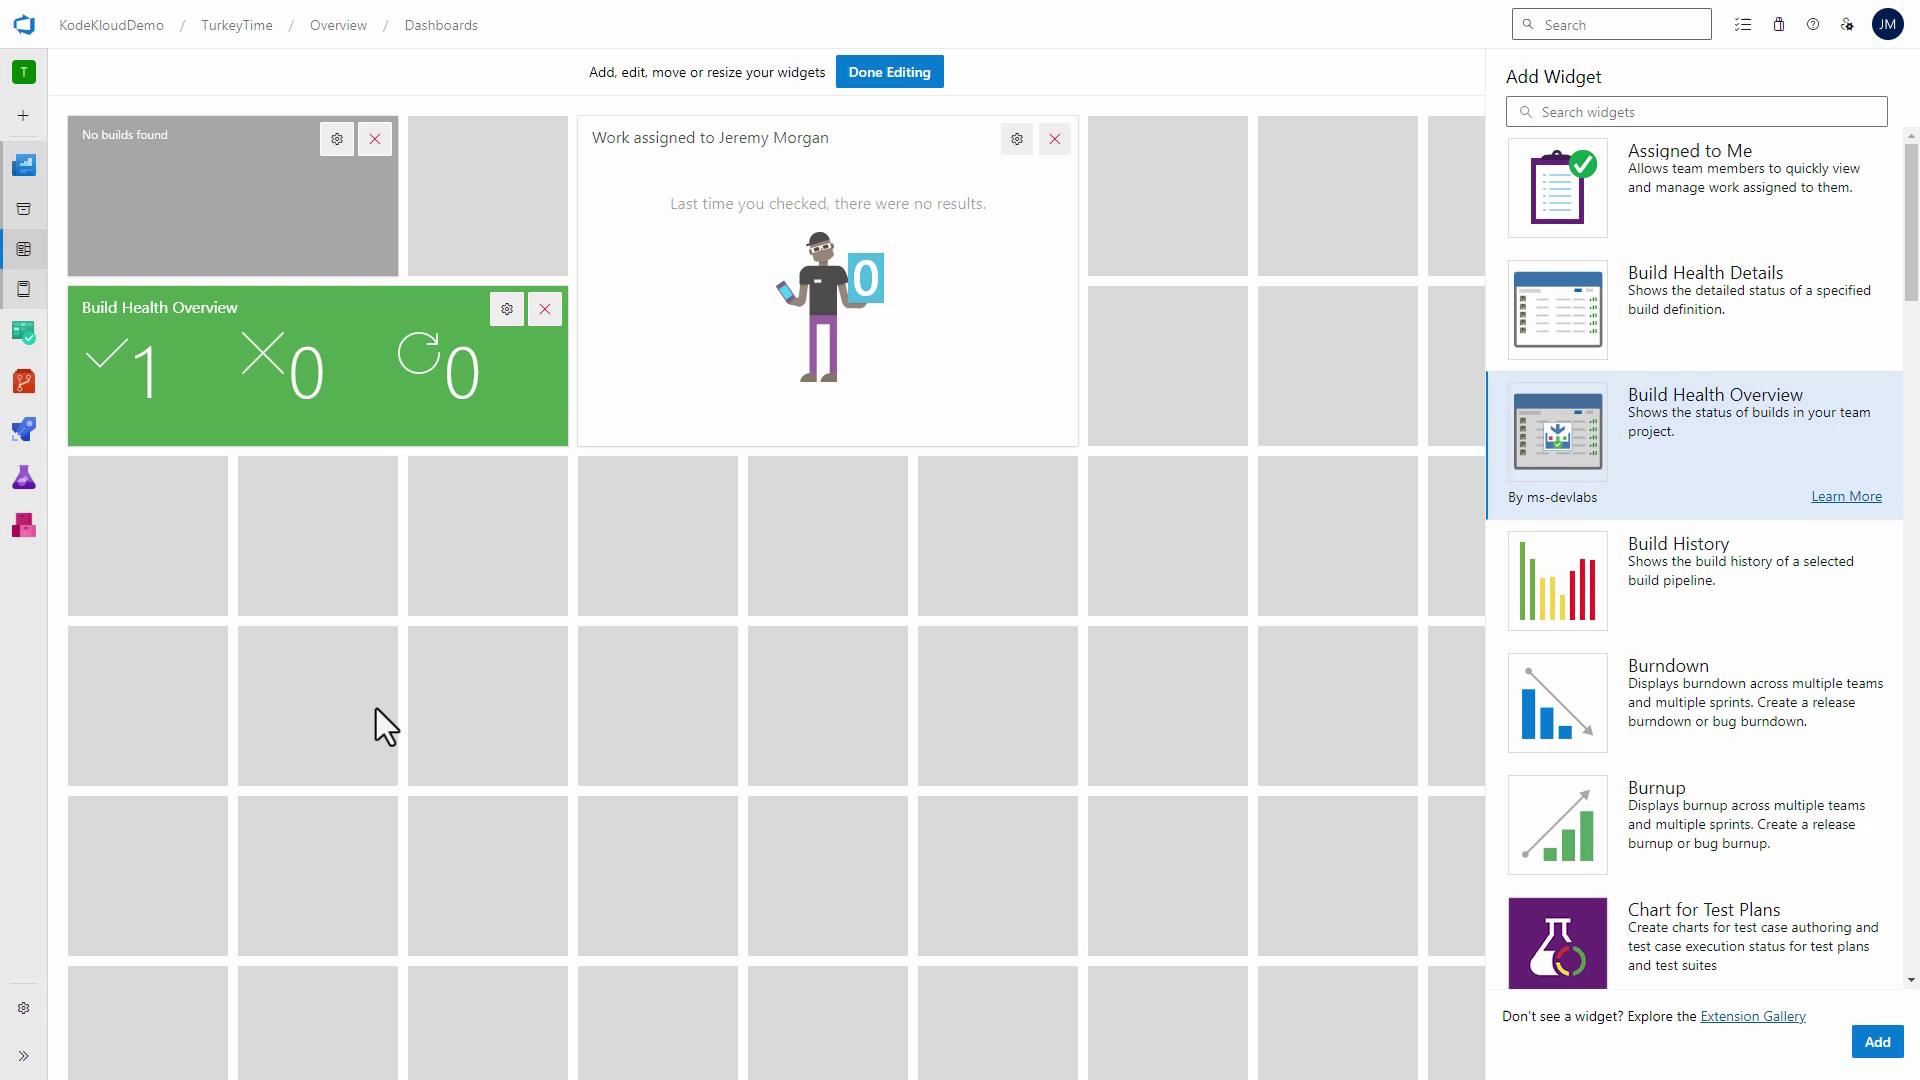
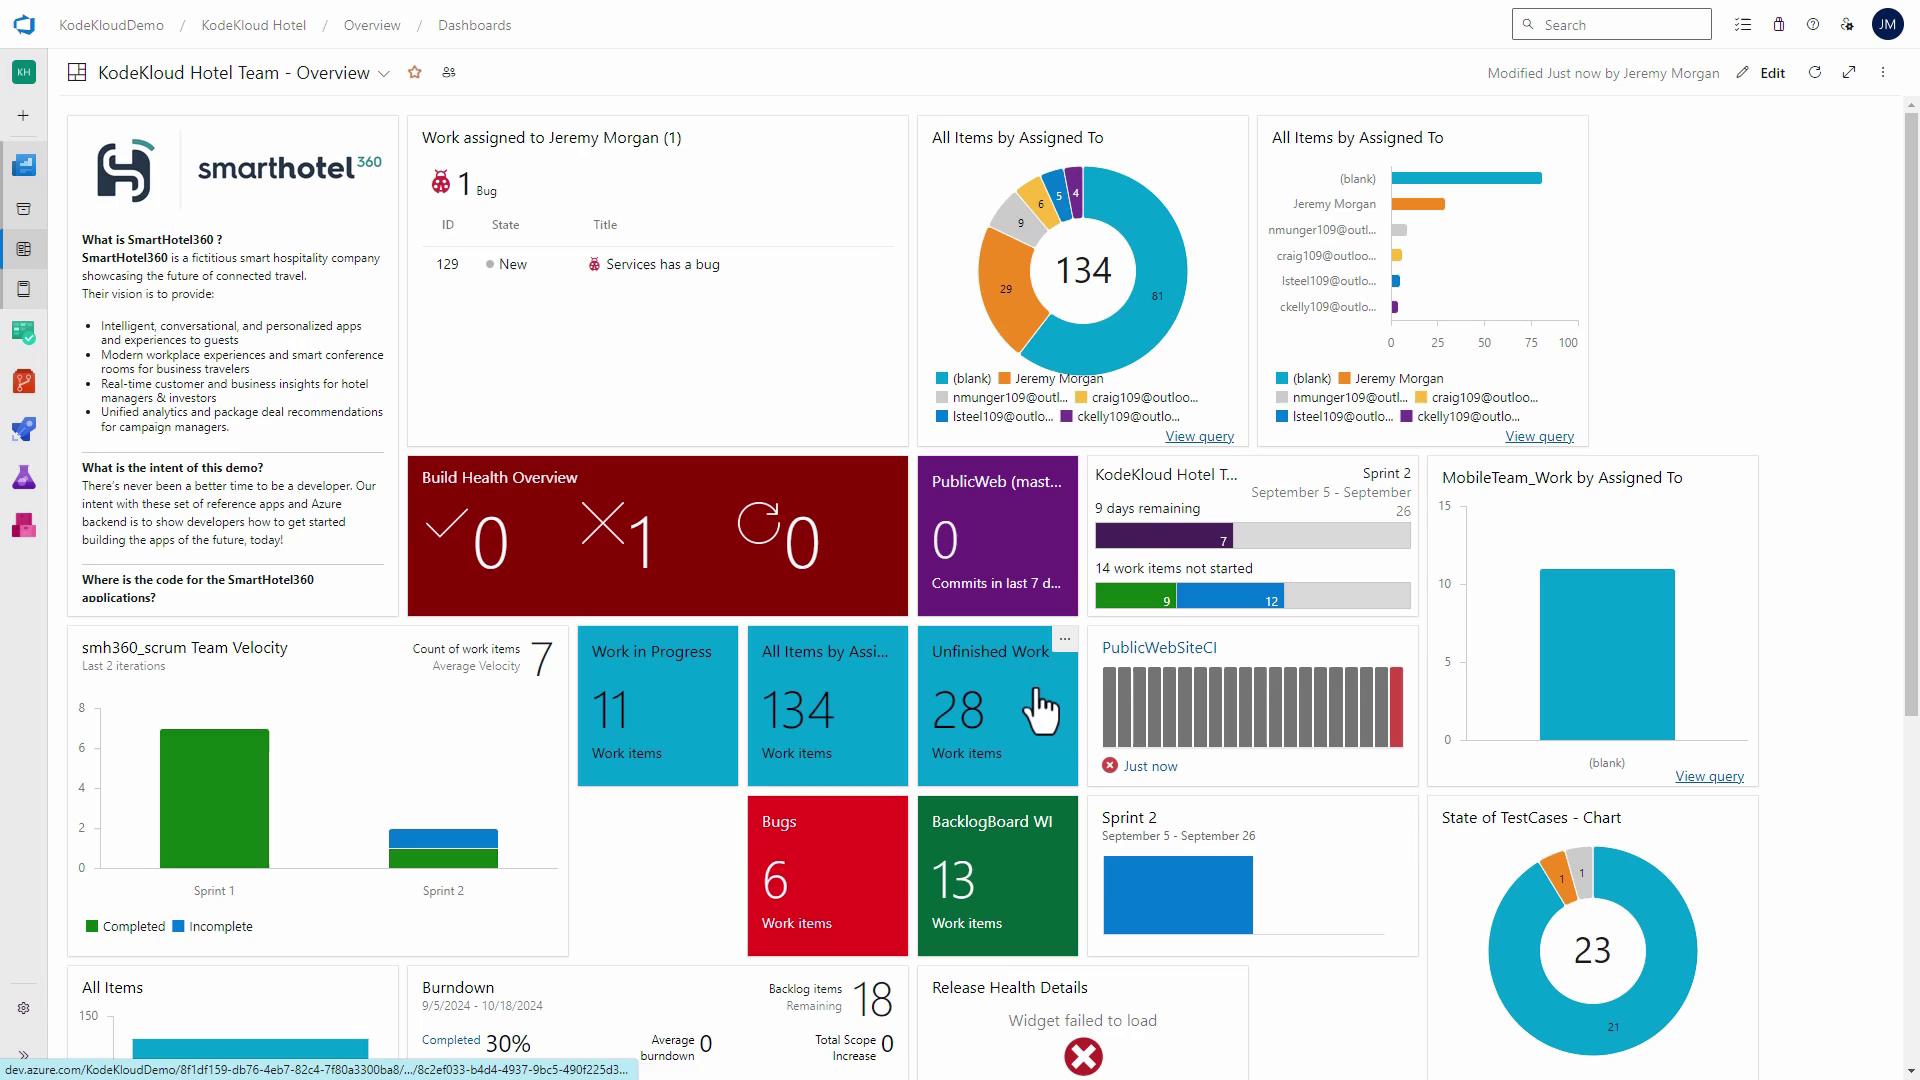
Adding and Arranging Widgets
Choose and place widgets that surface your critical insights:| Widget Name | Size (columns×rows) | Use Case |
|---|---|---|
| Assigned to Me | 6×2 | View your current work items |
| Build Health Overview | 3×2 | Monitor pipeline success and failures |
| Build History | 2×2 | Track recent builds |
| Burndown Chart | 6×4 | Visualize sprint progress |
| Work Items Chart | 4×3 | Analyze work item distribution |
| Cycle Time | 4×3 | Measure completion time |
- Top: Build health and history
- Center: Assigned work and cycle time
- Right: Burndown and workload charts
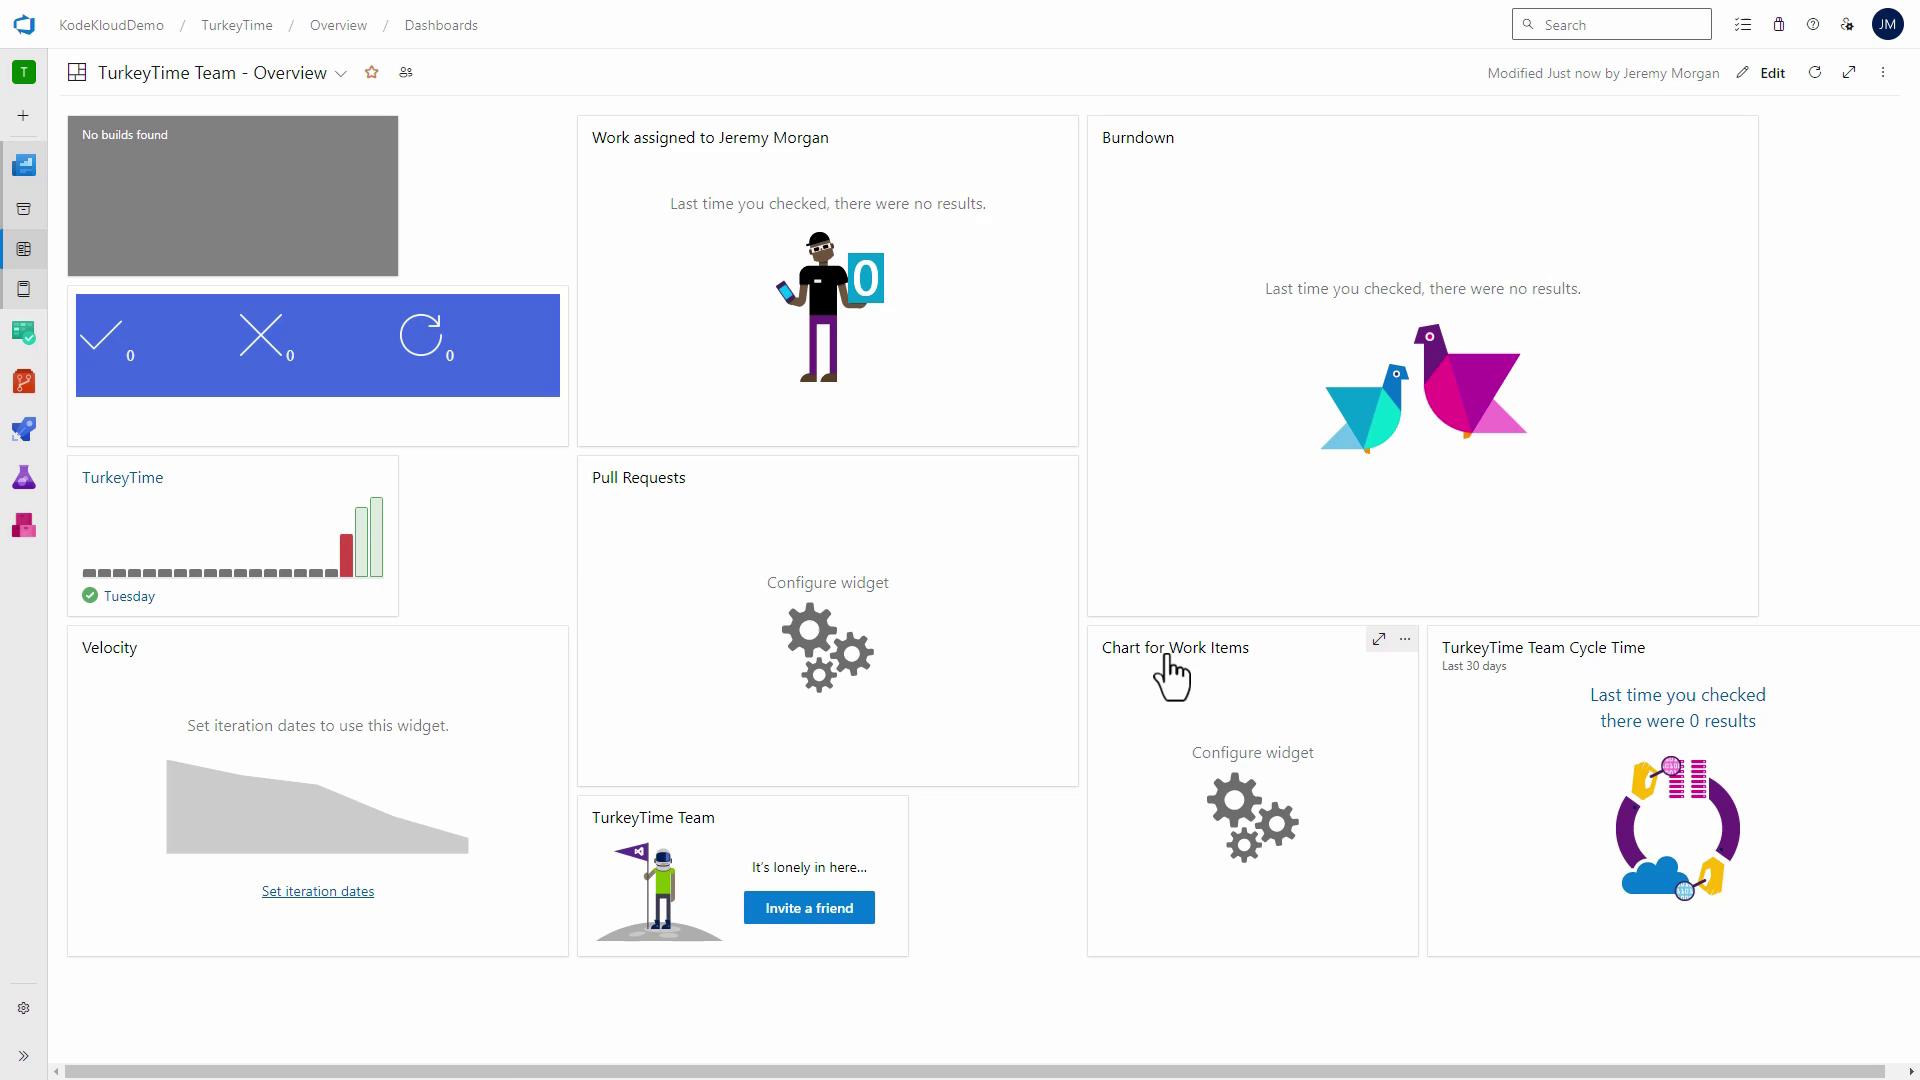
Preview with No Data
If your project has sparse data, some widgets display No results until builds or items populate them.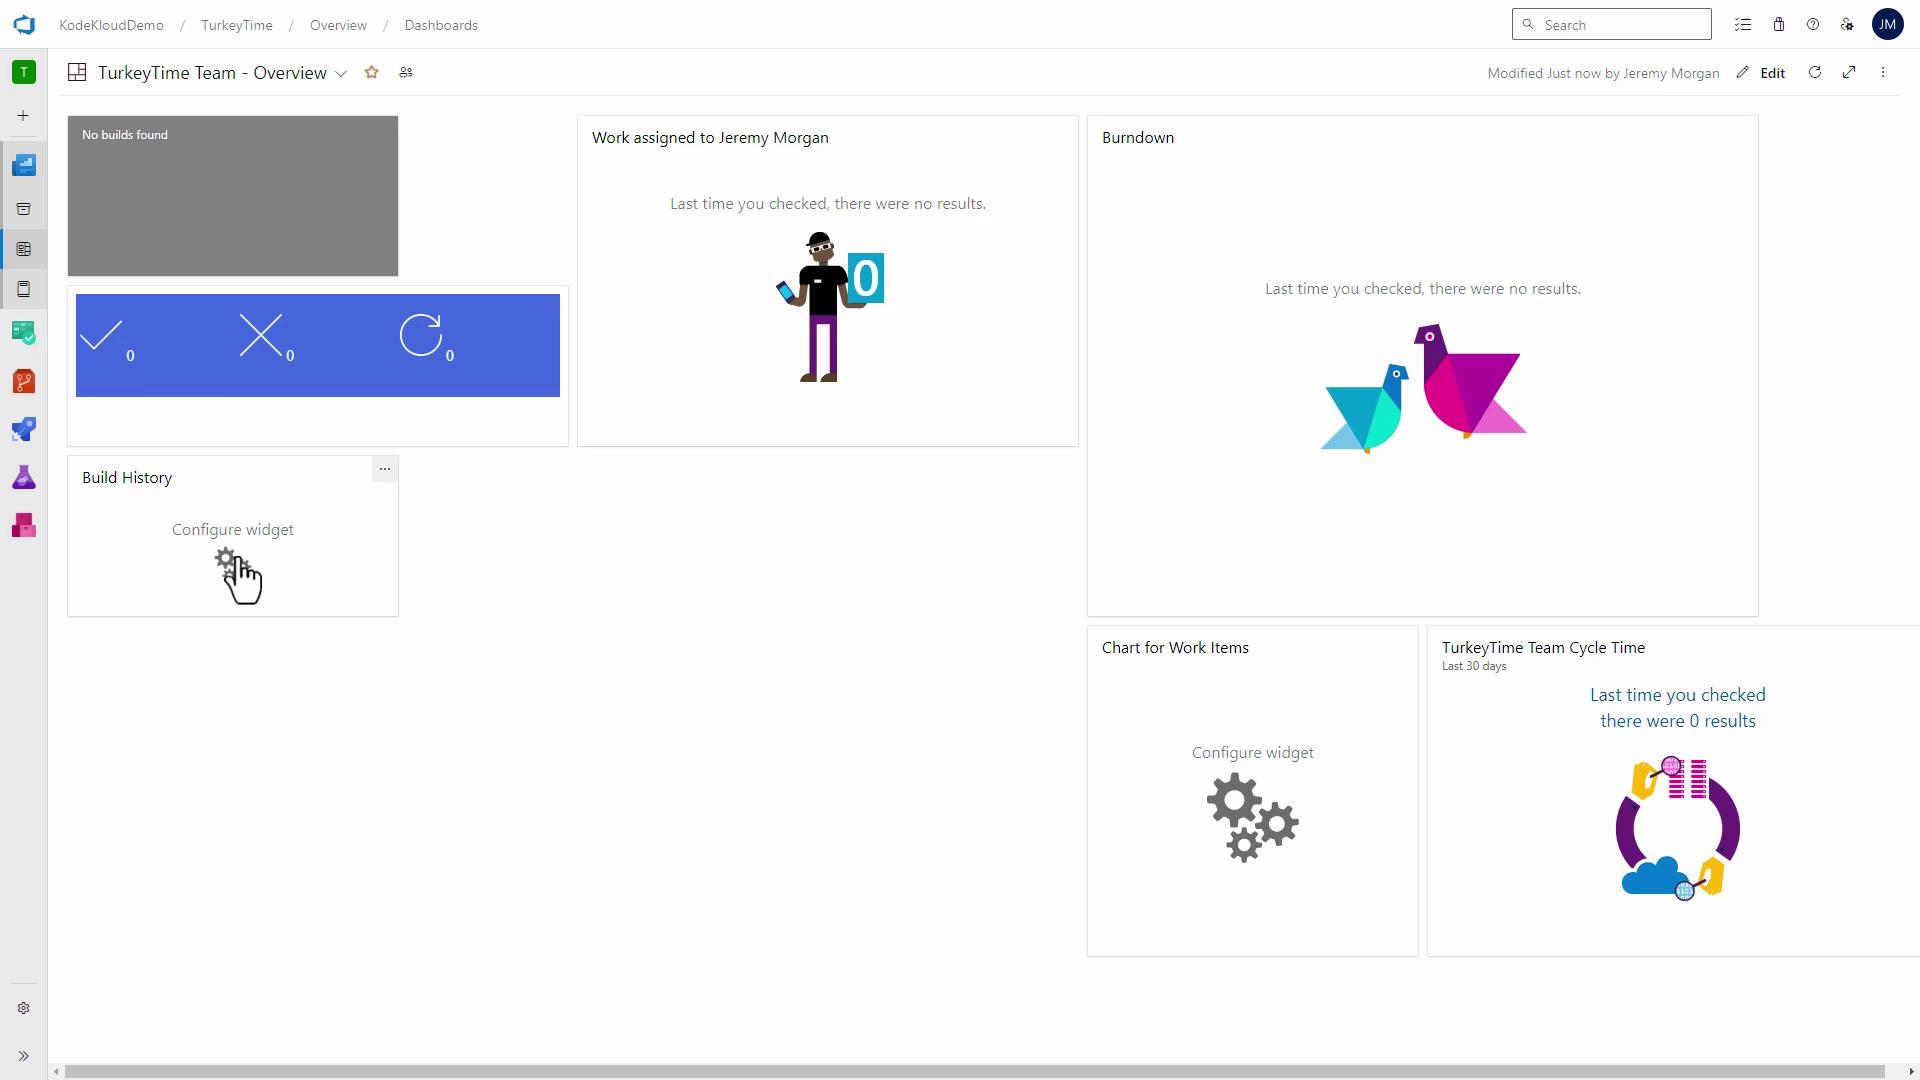
Empty widgets may look sparse at first. As your pipelines run and work items update, they’ll populate automatically.
Tailoring the Dashboard for Your Role
As a development lead, consider adding:- Pull Requests front and center
- Release Pipeline Health
- Team Velocity
- Click Edit.
- Drag these widgets onto your canvas and adjust sizes.
- Click Done Editing.
Best Practices
- Keep widget sources current (pipelines, queries).
- Remove unused widgets to reduce clutter.
- Focus on 2–3 critical widgets for maximum visibility.
- Review and adjust as team priorities evolve.
Fixing Broken or Misconfigured Widgets
When a widget fails to load (e.g., unhandled exception or invalid JSON), reconfigure its connection:- Click Edit and open the gear icon on the problematic widget.
- Select the correct pipeline or query.
- Save and click Done Editing.
If a pipeline or query no longer exists, the widget will remain broken. Ensure you recreate or update the source before reattaching.
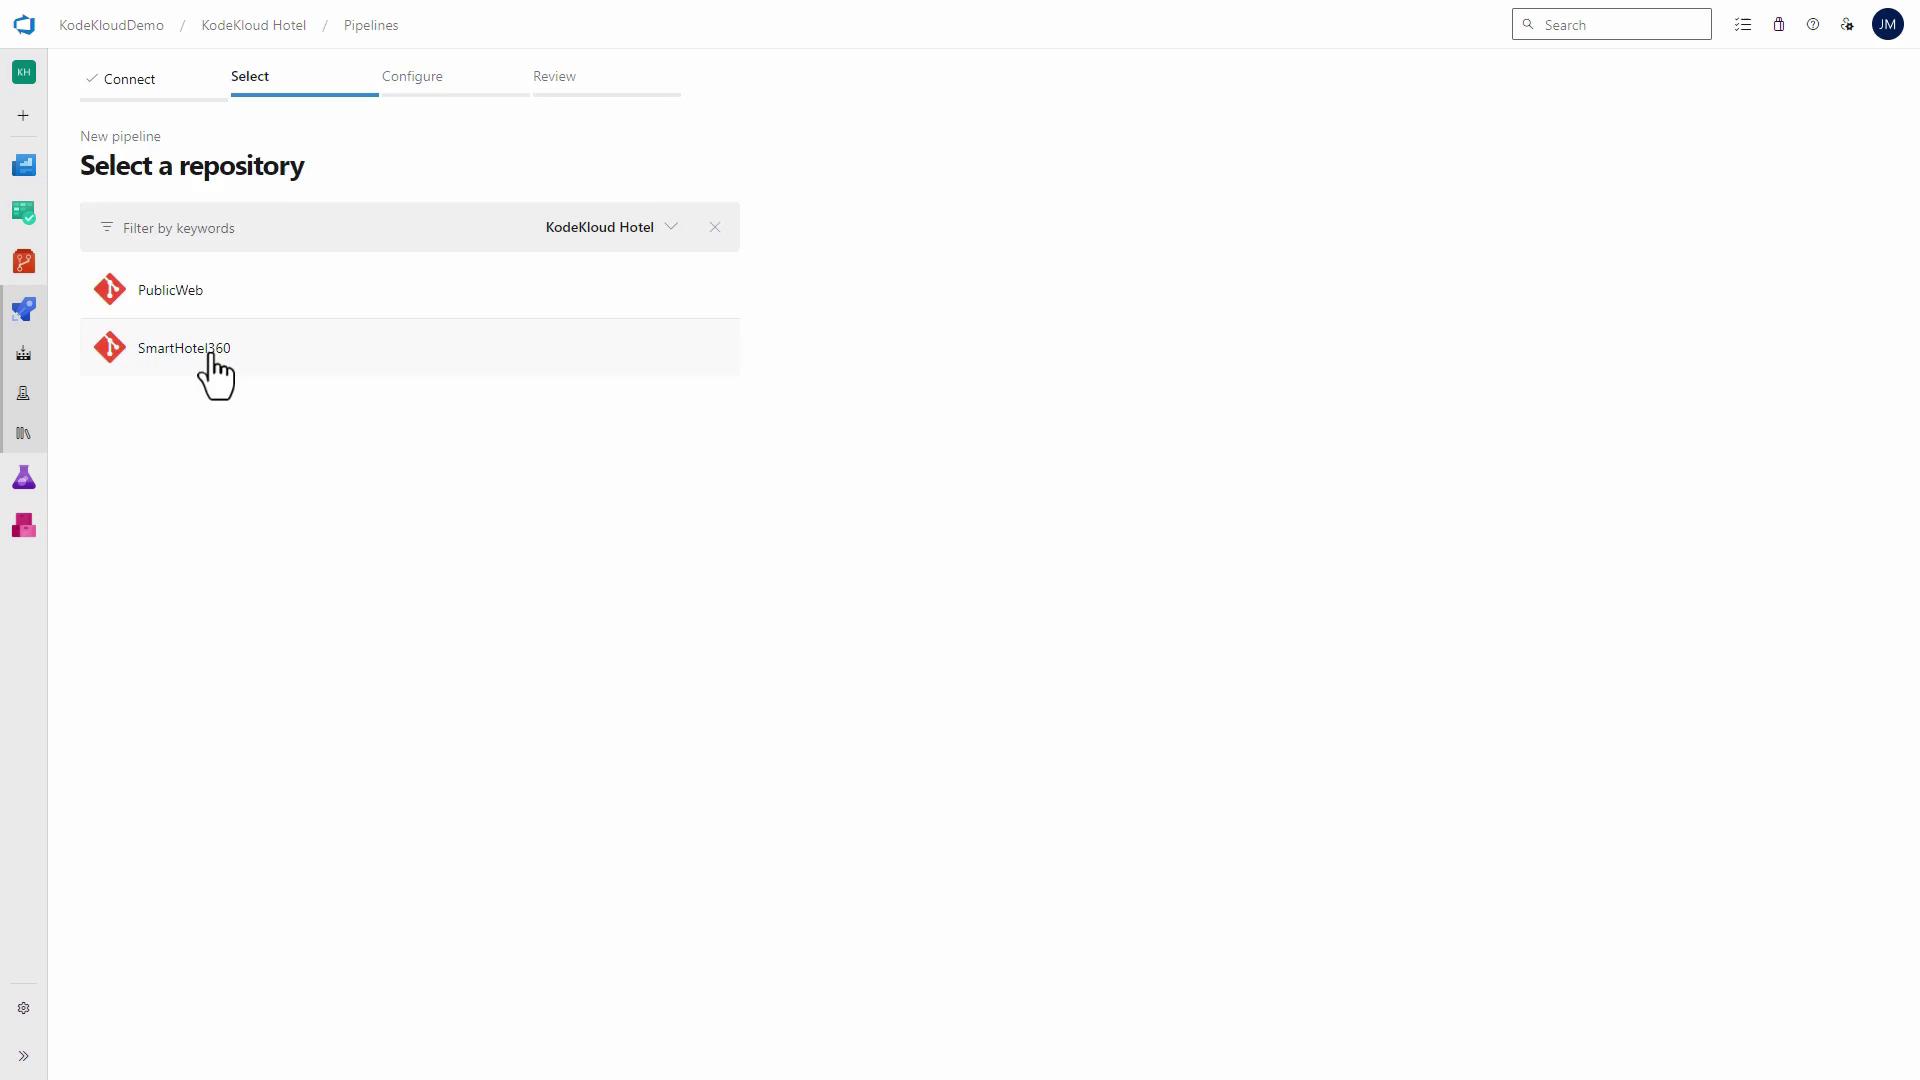
Example: Reattaching a Pipeline
- In Pipelines, click Create Pipeline.
- Connect to your repo (e.g., SmartHotel360 under KodeKloud Hotel).
- Use the starter template, then save and run.
- Return to Dashboards, edit the widget, attach the new pipeline, and save.
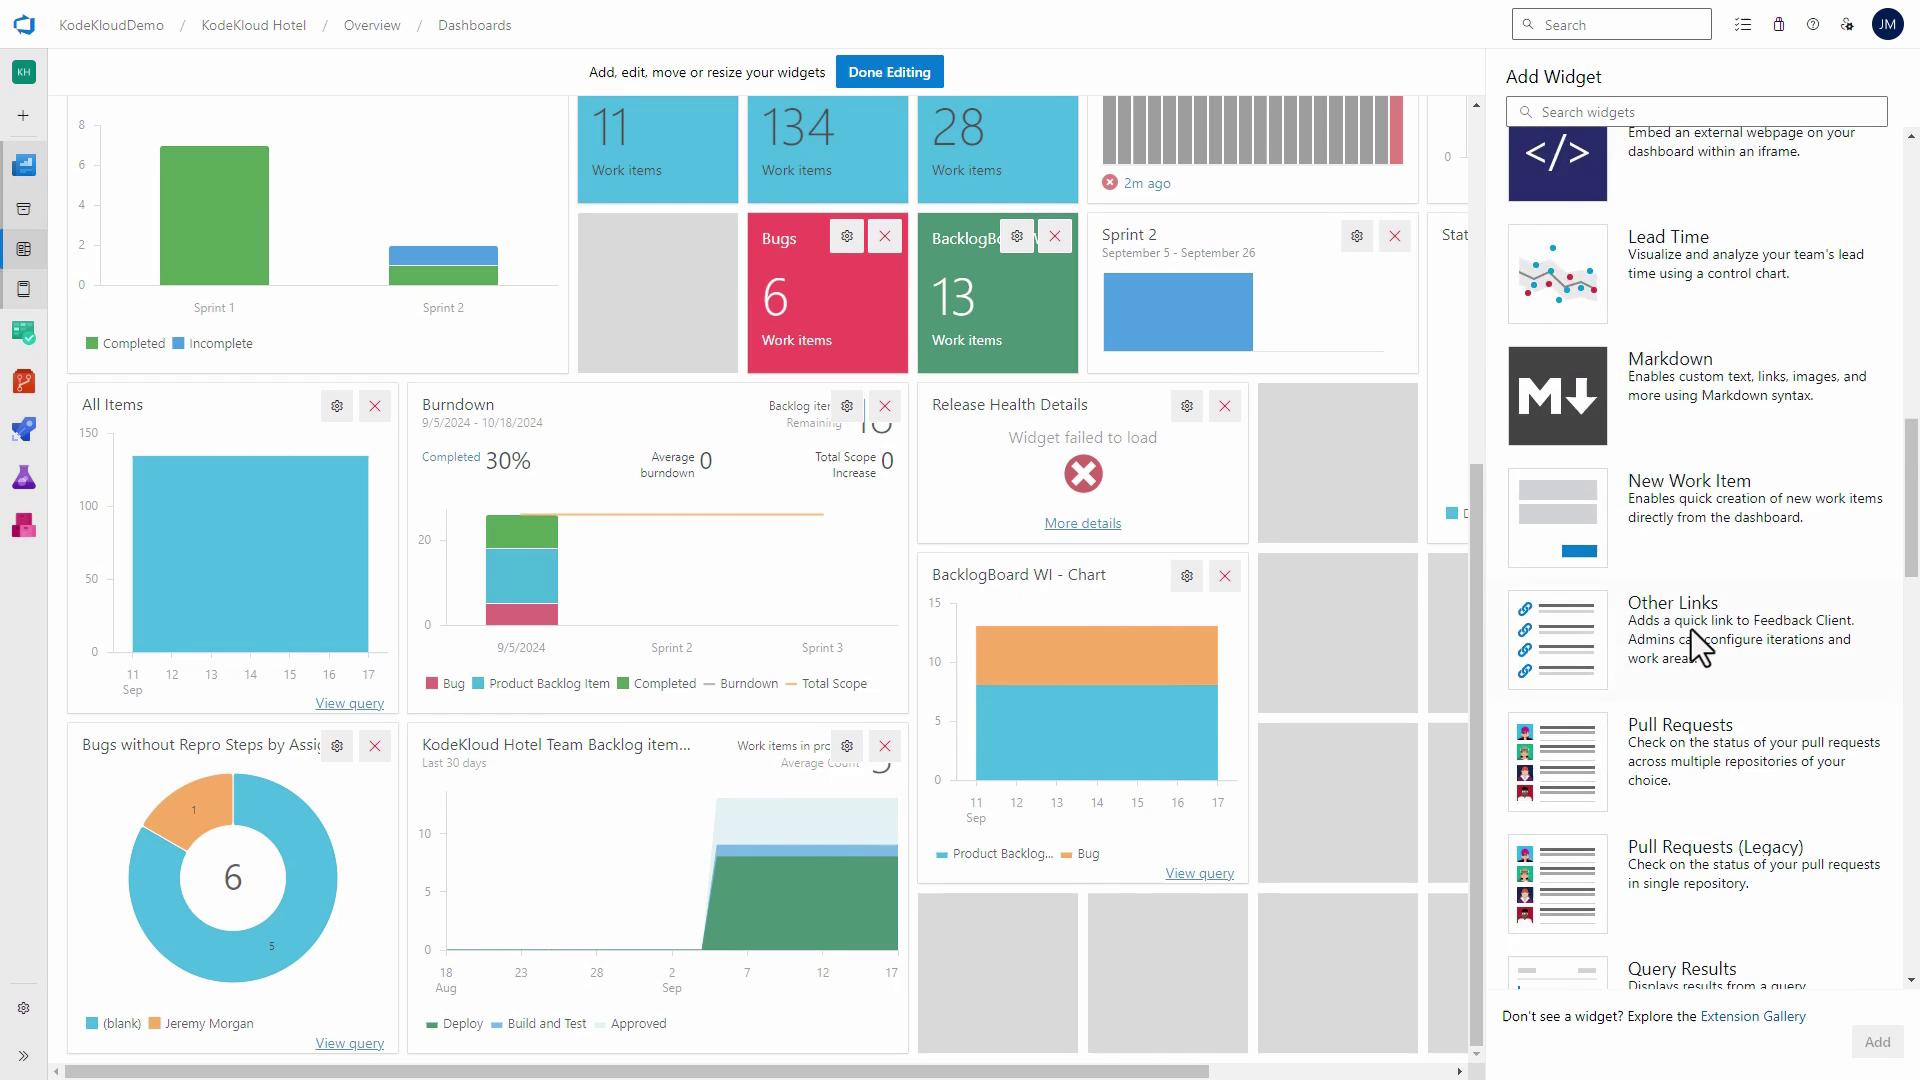
Exploring the Widget Gallery
Discover more widgets:| Category | Description |
|---|---|
| Work | Charts and lists for work items |
| Build | Pipelines health and history |
| Code | PRs, commits, and code coverage |
| Release | Release pipeline status and logs |
- Click Add Widget.
- Browse categories and click Add next to any widget.
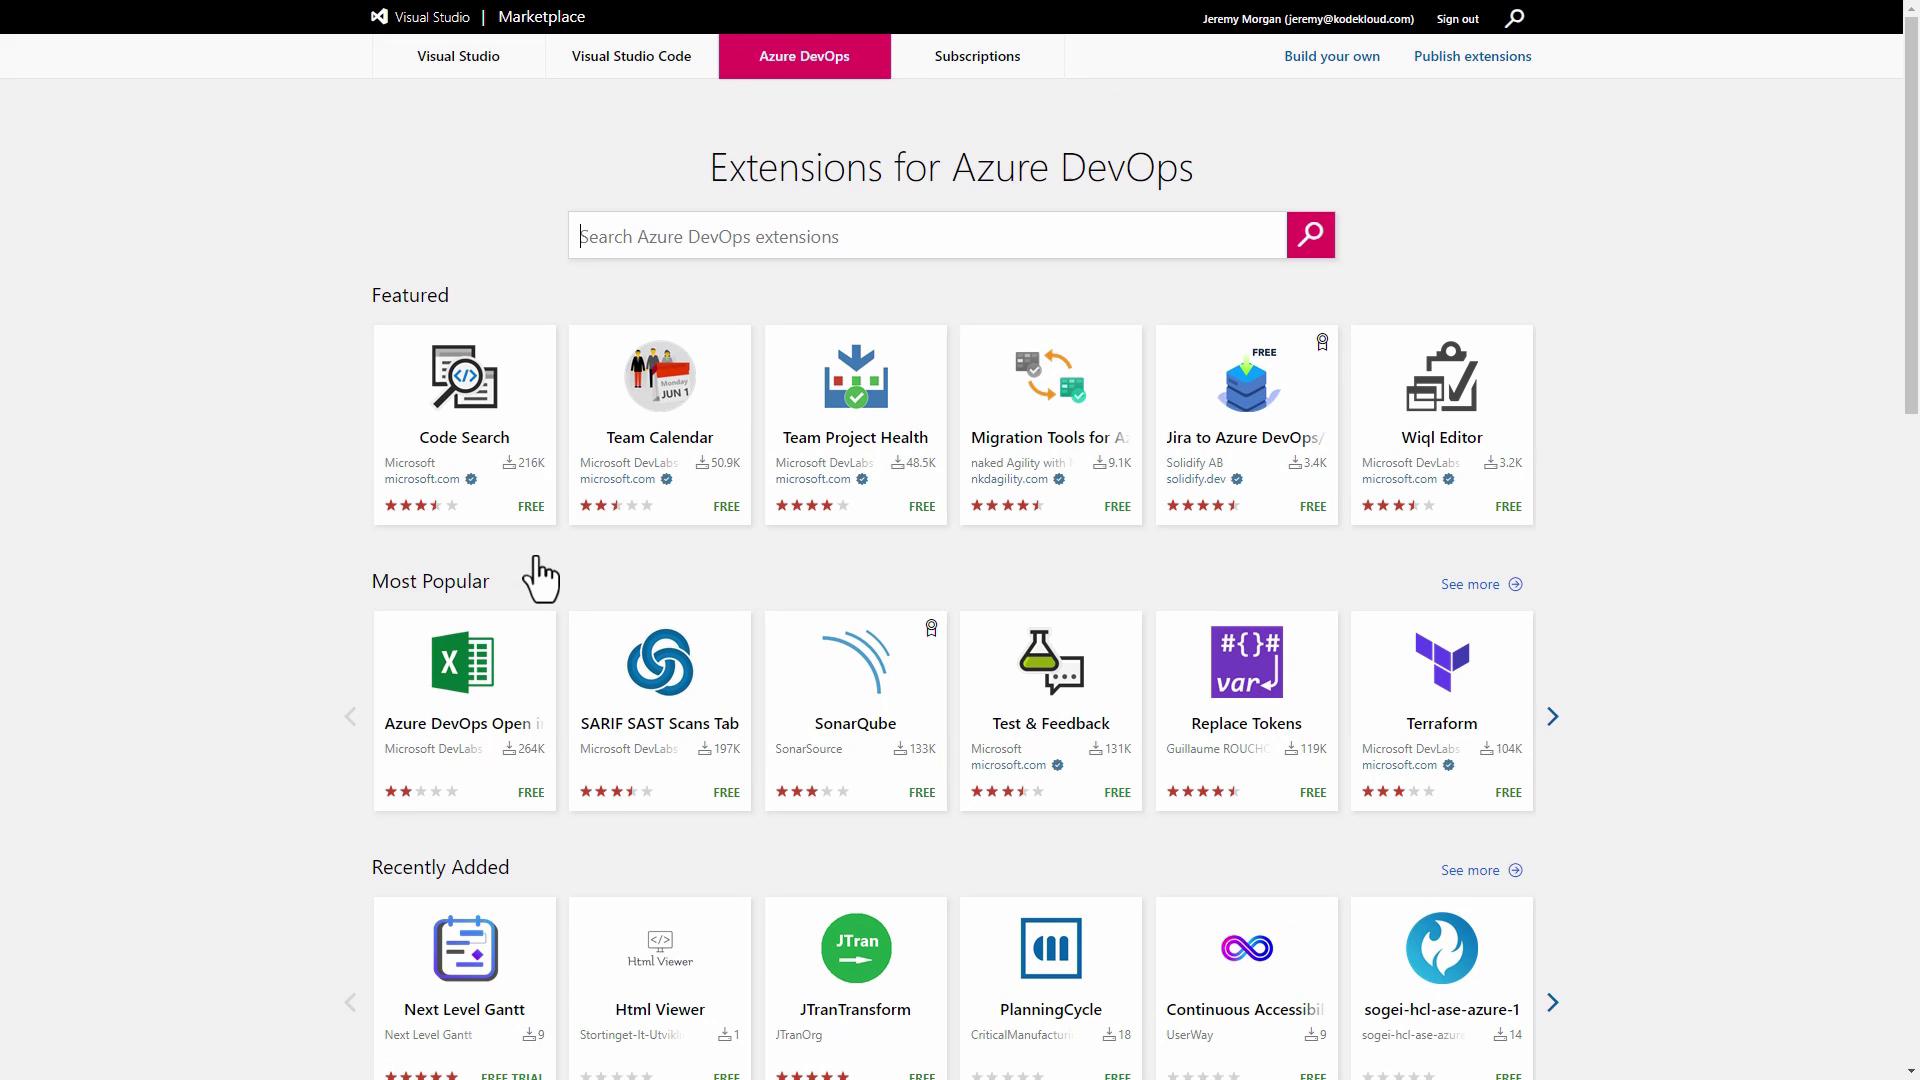
Using Extensions
For richer dashboards, explore the Visual Studio Marketplace:- Click the Marketplace icon in Azure DevOps.
- Search for “Azure DevOps” extensions.
- Install free or paid widgets (e.g., SonarCloud, Gantt charts).