Key Features
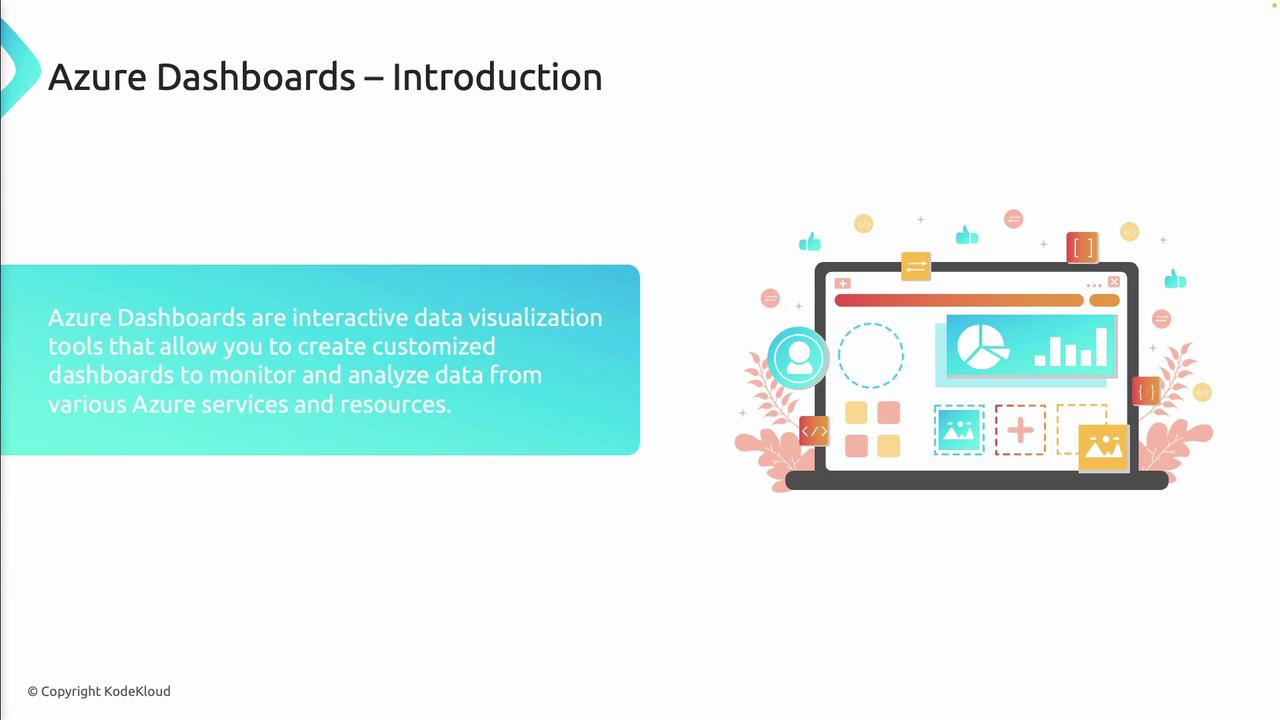
Azure dashboards can be tailored to any team’s workflow. Use drag-and-drop tiles, custom queries, and built-in or third-party charts to surface the data that matters most.
| Feature | Description |
|---|---|
| Centralized Monitoring | Aggregate metrics and logs from all subscriptions and resource groups in one view. |
| Customizable Layouts | Design dashboards with drag-and-drop tiles, grids, and theme settings. |
| Integrated Data Sources | Connect to Azure Monitor, Log Analytics, Application Insights, and external APIs. |
| Sharing and Collaboration | Grant roles or share read-only links to co-author and review dashboards. |
| Automation and Scripting | Deploy templates (ARM, Bicep) or call REST APIs to create/update dashboards at scale. |

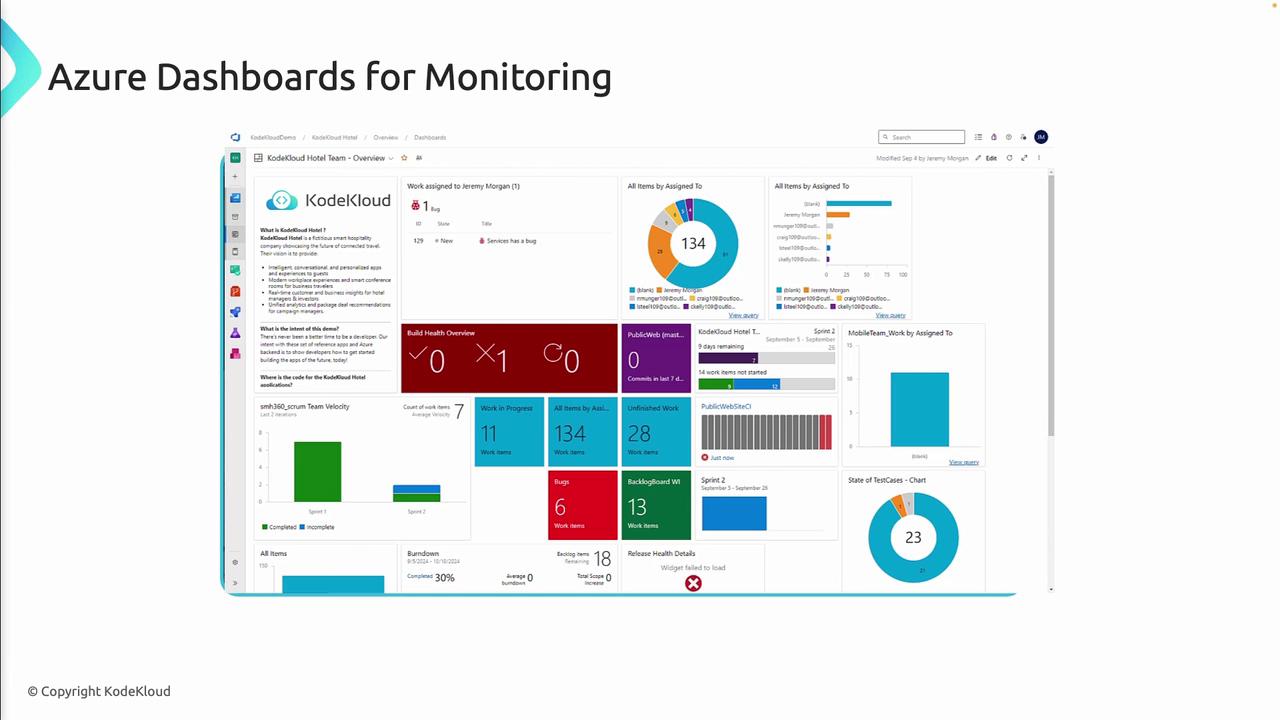
Common Use Cases
| Use Case | Description |
|---|---|
| CI/CD Pipeline Monitoring | Track build statuses, deployment stages, and failure rates across DevOps pipelines. |
| Application Performance | Visualize response times, throughput, error rates, and dependency calls in real time. |
| Infrastructure Health Tracking | Monitor VM availability, App Service metrics, database DTU usage, and storage IOPS. |
| Service-Level Reporting | Display KPIs such as deployment frequency, mean time to recovery (MTTR), and uptime percentages. |
| Stakeholder Dashboards | Share executive summaries with interactive charts and KPI tiles for business stakeholders. |
Integration with Azure Monitor and Log Analytics
Azure dashboards seamlessly integrate with Azure Monitor and Log Analytics to form a complete observability solution:- Collect metrics, activity logs, and custom telemetry across your cloud estate.
- Run Kusto Query Language (KQL) queries to filter, aggregate, and correlate log data.
- Pin chart and grid visualizations directly from Log Analytics or Application Insights.
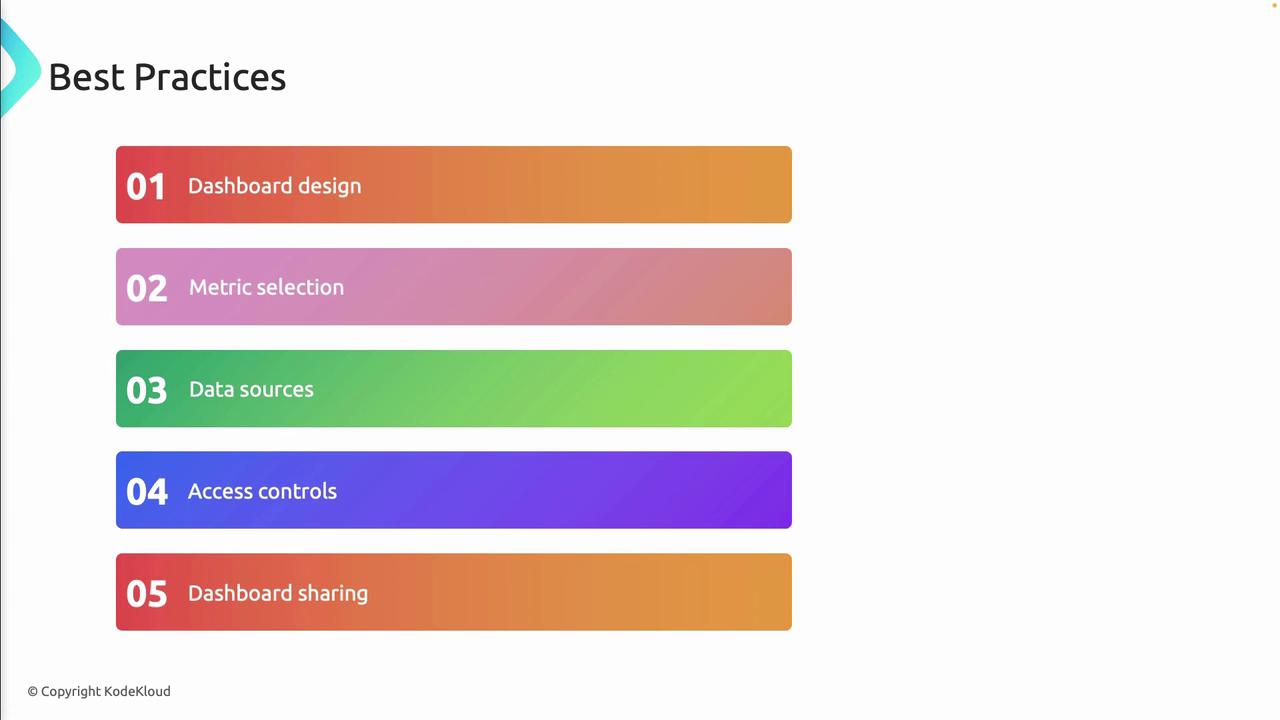
Best Practices
- Design for Clarity
Organize tiles by priority and group related metrics together. - Select Actionable Metrics
Surface only the data points that drive decisions or indicate anomalies. - Integrate Diverse Data Sources
Combine infrastructure, application, and security logs for a holistic view. - Enforce Role-Based Access Controls
Apply least-privilege permissions to protect sensitive dashboards.
Grant “Contributor” access only to trusted team members. Public dashboard links expose read-only data but should still be shared judiciously.
- Encourage Collaboration
Leverage comments, annotations, and versioned templates so that teams can iterate on dashboard designs.