

Understanding these indicators is essential for maintaining optimal performance, minimizing downtime, and preparing for the AZ-400 exam. By keeping an eye on these metrics, you’ll ensure a smooth user experience while optimizing costs.
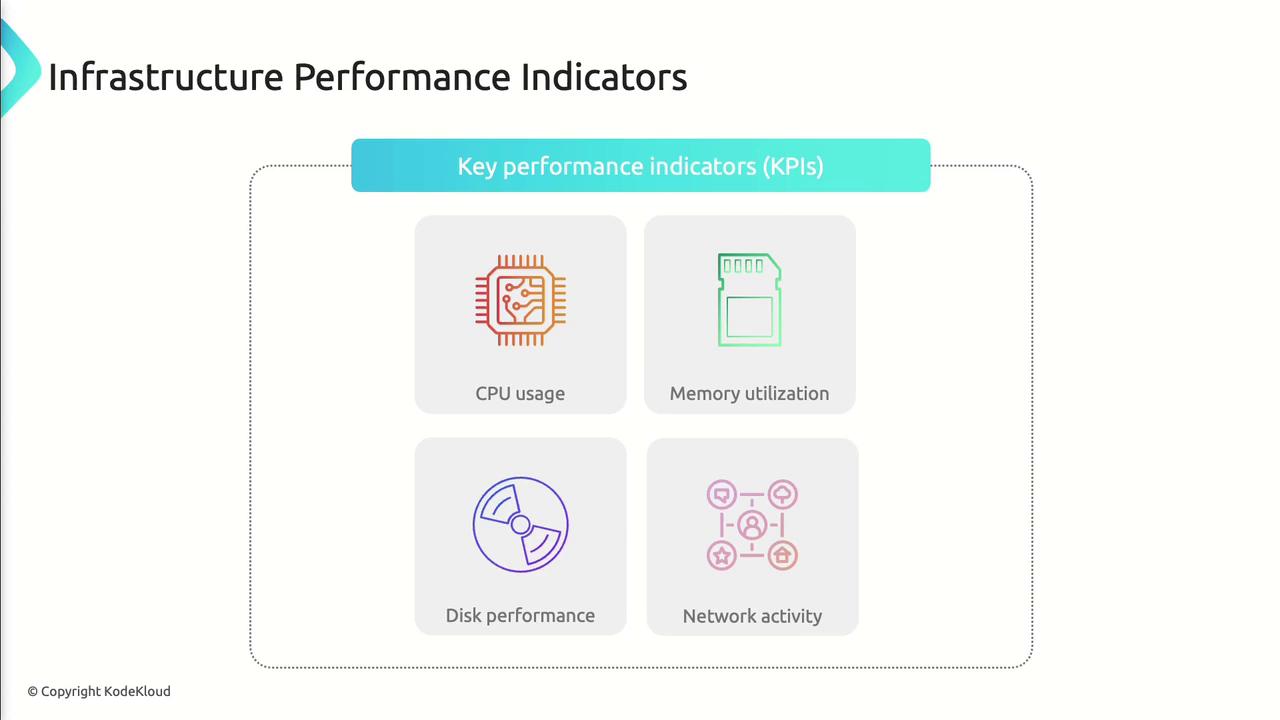
CPU Performance
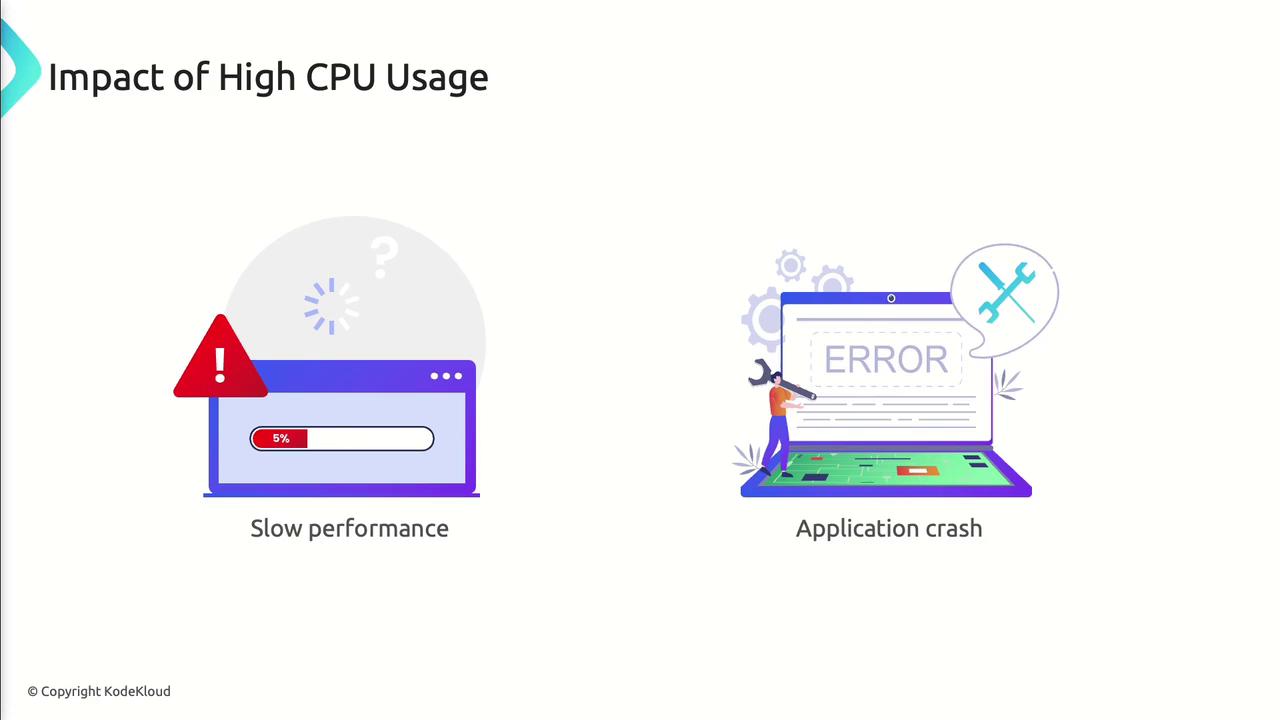
CPU performance reflects the percentage of processing capacity your workloads consume. Sustained high CPU can lead to slow response times and application failures.
- Slow response times
- Increased processing latency
- Application crashes
Practical Example: Alerting on CPU Spikes
Memory Utilization
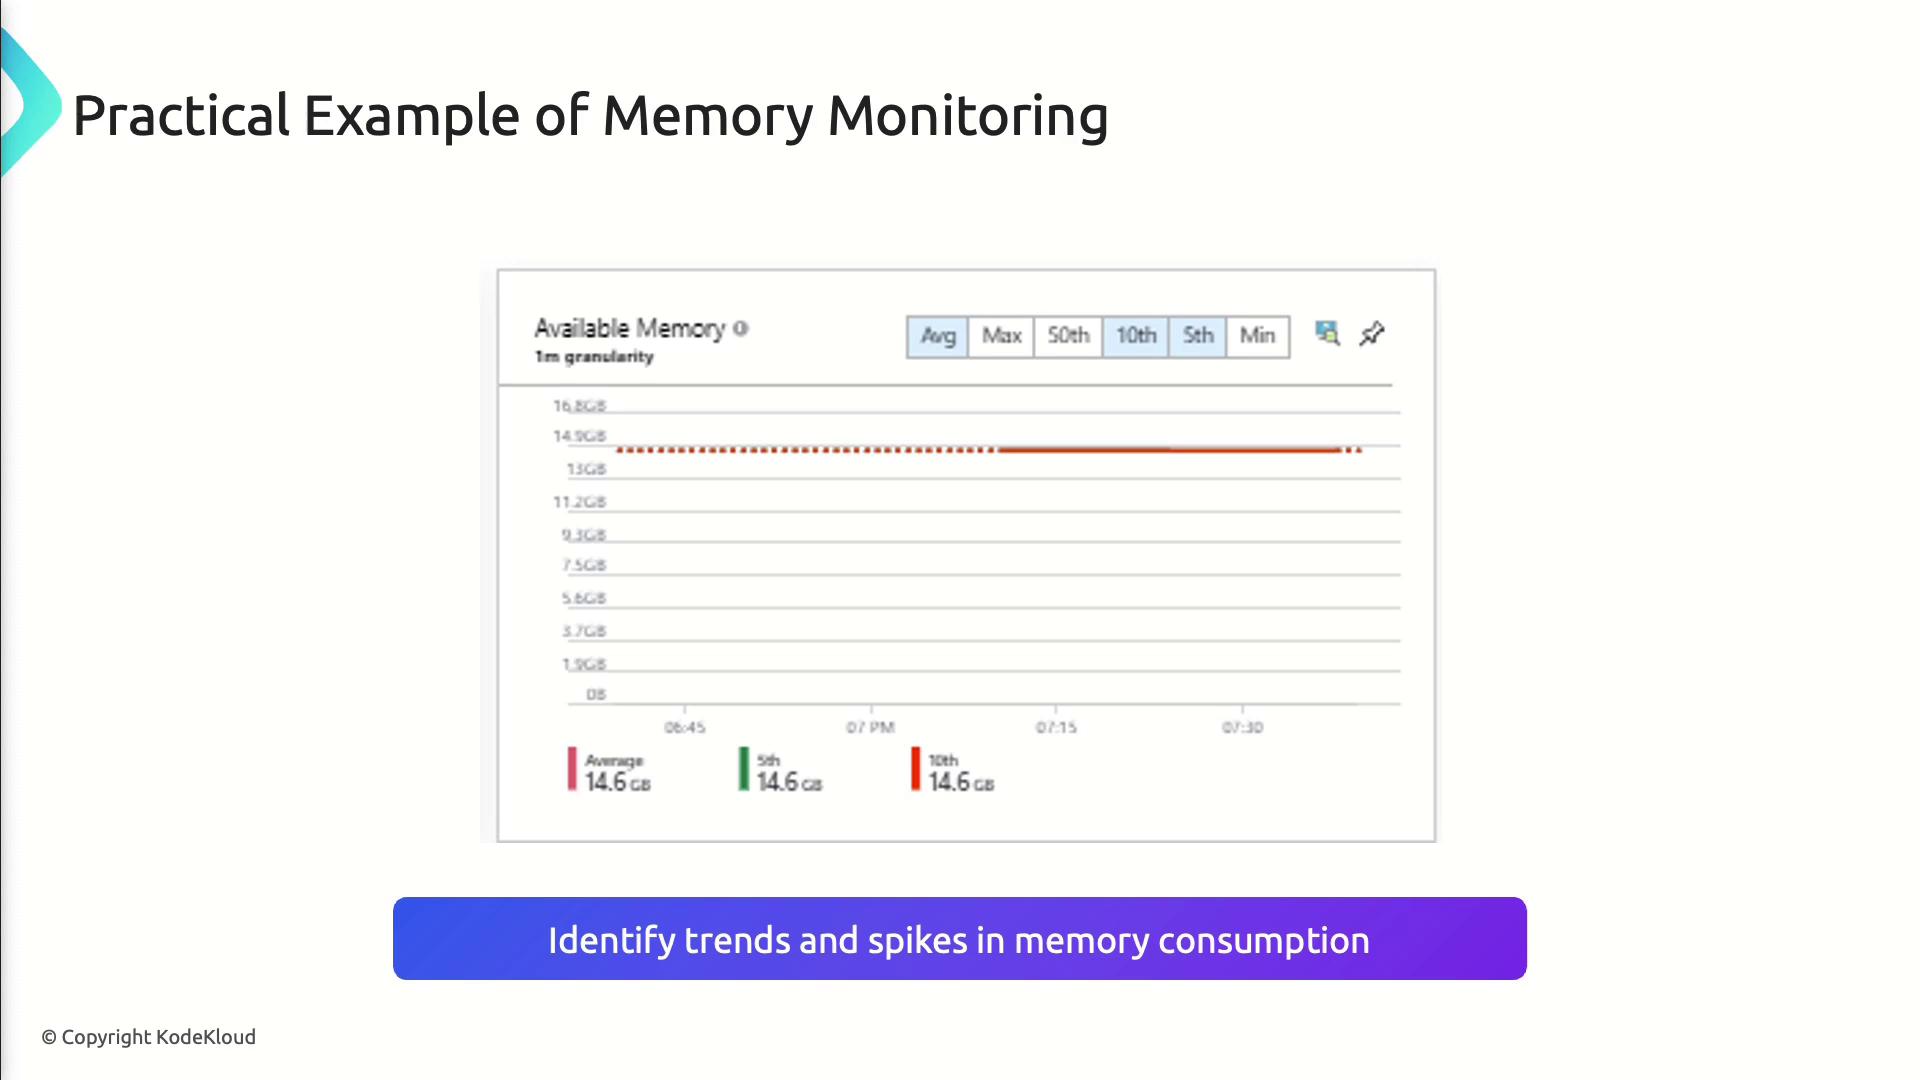
Memory utilization shows how much RAM your applications consume. Excessive memory usage can trigger slowdowns or out-of-memory errors.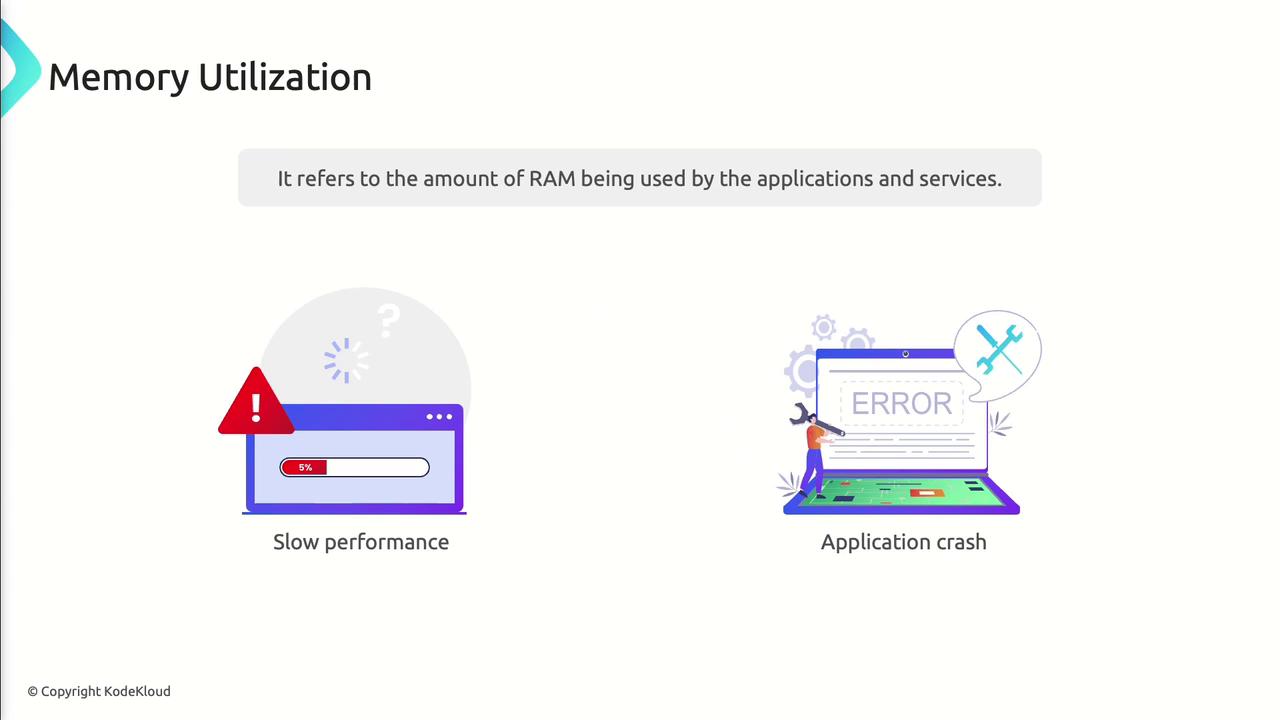
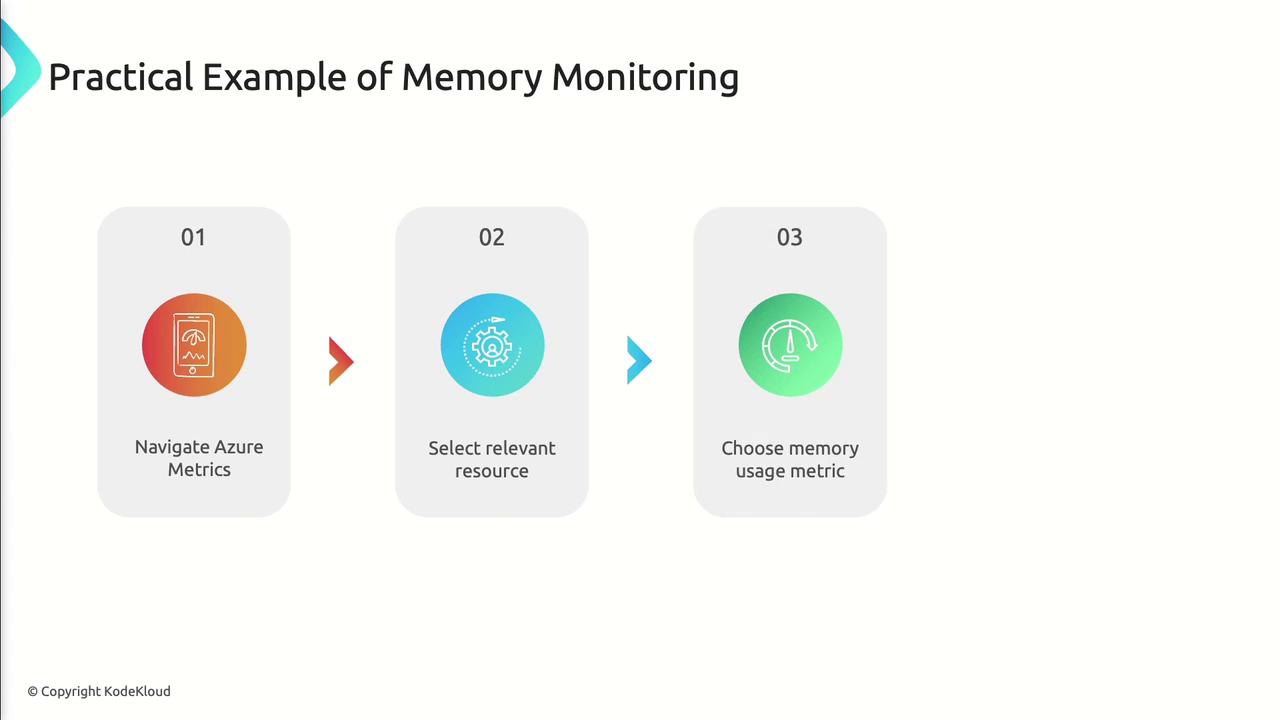
How to Monitor Memory
- In Azure Portal, navigate to Azure Metrics.
- Select your target resource (e.g., VM, Web App).
- Add the Memory Usage metric to a chart.
- Configure an alert on critical thresholds.
- Optimize code to release unused memory
- Scale up the VM or App Service plan if needed
Disk Performance
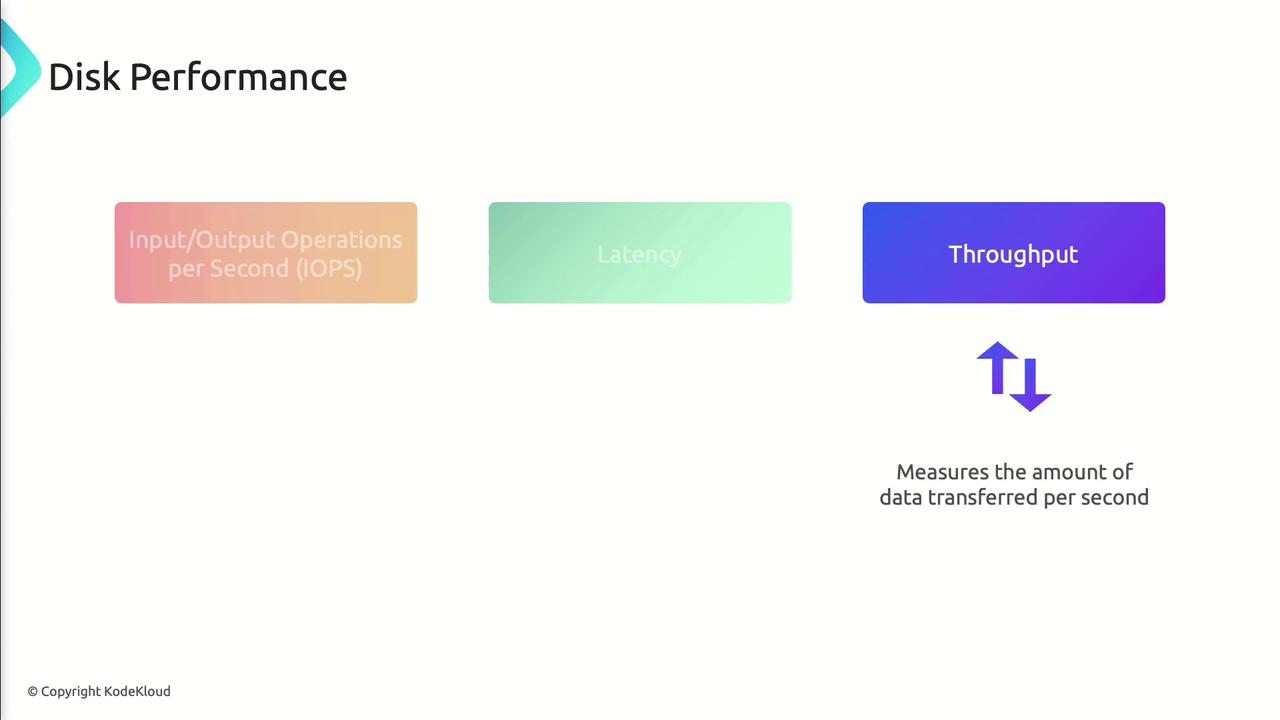
Disk performance metrics gauge how efficiently your storage layer handles read/write operations—vital for data-intensive workloads.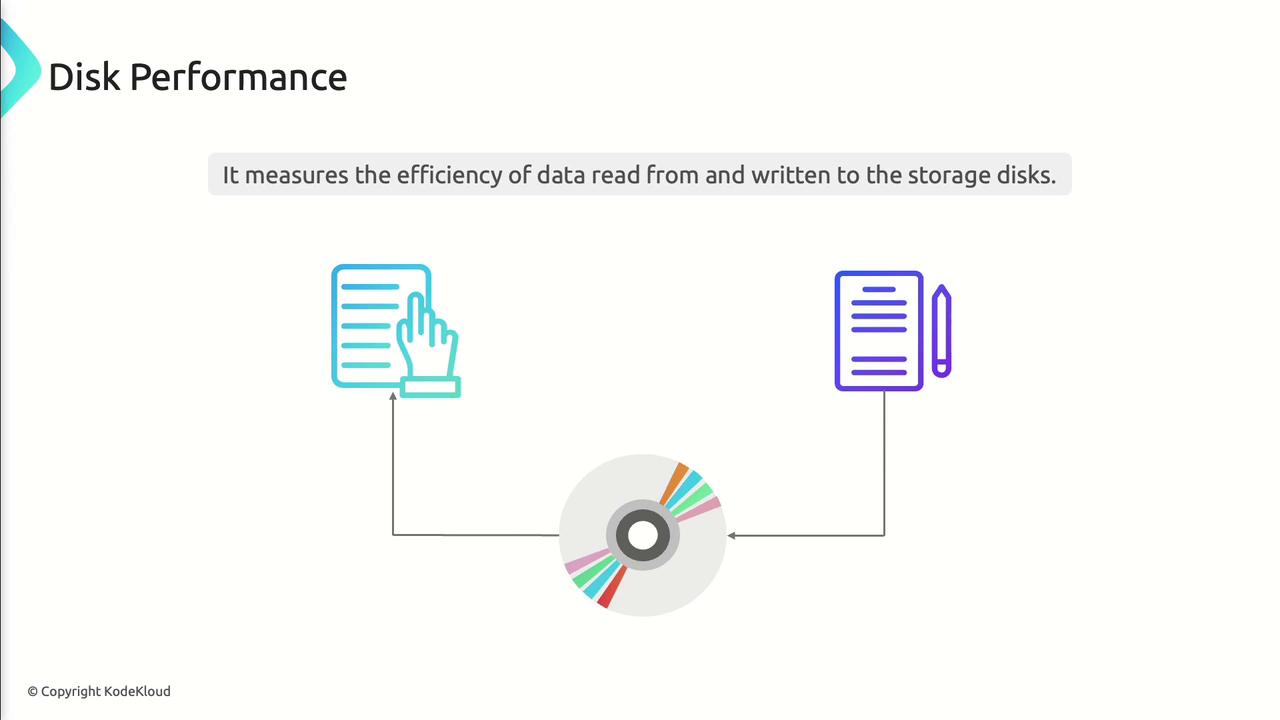
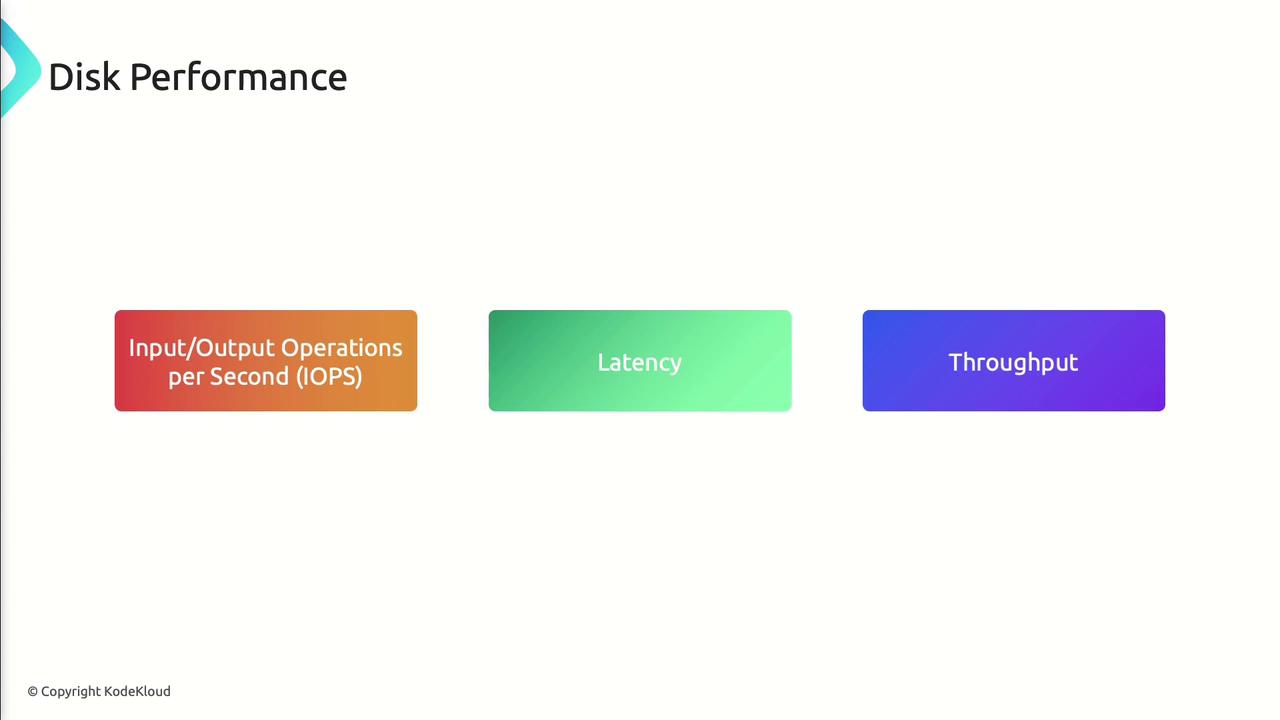
Key Disk Metrics

Monitoring Disk Performance
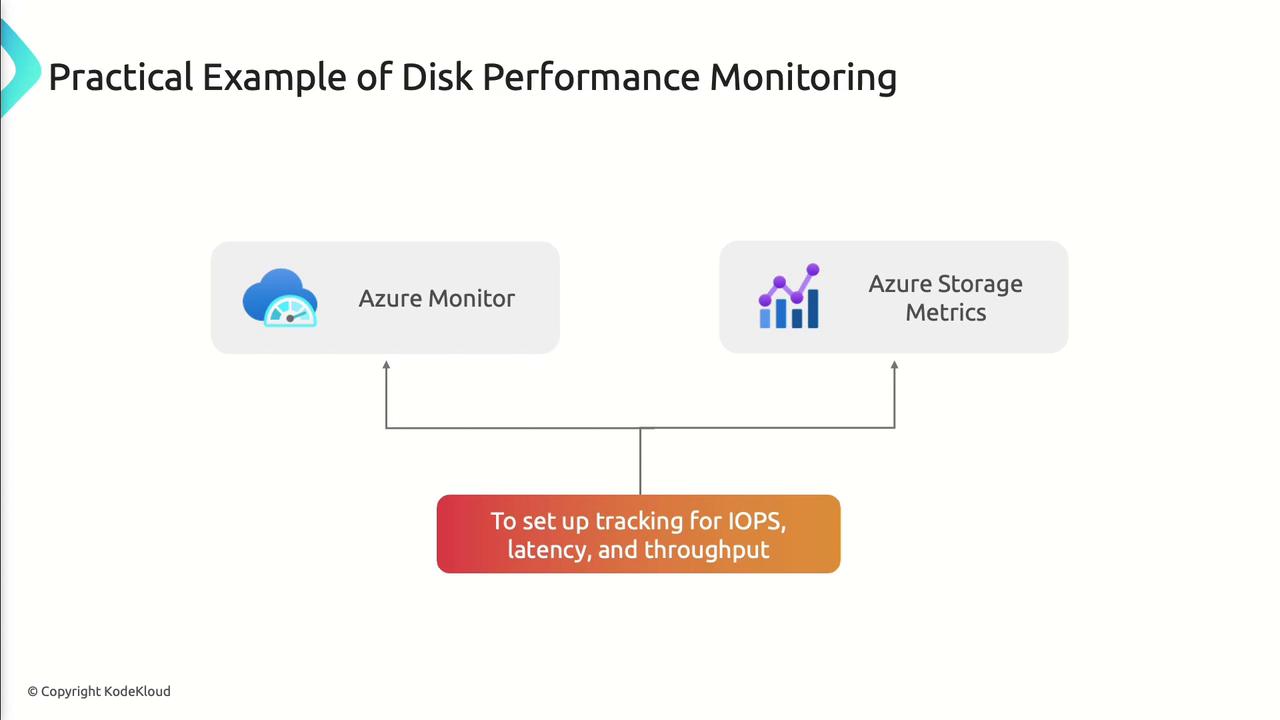
- Enable metrics for IOPS, latency, and throughput on your storage account or managed disk.
- Use Azure Monitor and Azure Storage Metrics to chart and alert.
- Set thresholds (e.g., latency > 20 ms) to trigger notifications.
- Upgrade to Premium or Ultra disks
- Use striping and caching for high-throughput scenarios
- Implement an in-memory or CDN cache for hot data
Network Performance
Network performance determines how swiftly and reliably data travels across your Azure resources and to end users. Key metrics:- Bandwidth: Maximum data transfer rate
- Latency: Round-trip time between endpoints
- Packet Loss: Percentage of dropped packets
Monitoring with Azure Network Watcher
- Enable Network Watcher in your subscription.
- Use Connection Monitor to assess latency and packet loss.
- Review bandwidth usage on each virtual NIC.


- Optimize routing, peering, and gateway configurations
- Increase bandwidth allocation for high-traffic workloads
- Apply QoS policies to prioritize mission-critical packets
Benefits and Common Challenges
Proactive monitoring helps you:- Detect issues before they impact users
- Optimize resource allocation and reduce costs
- Maintain consistent performance under load
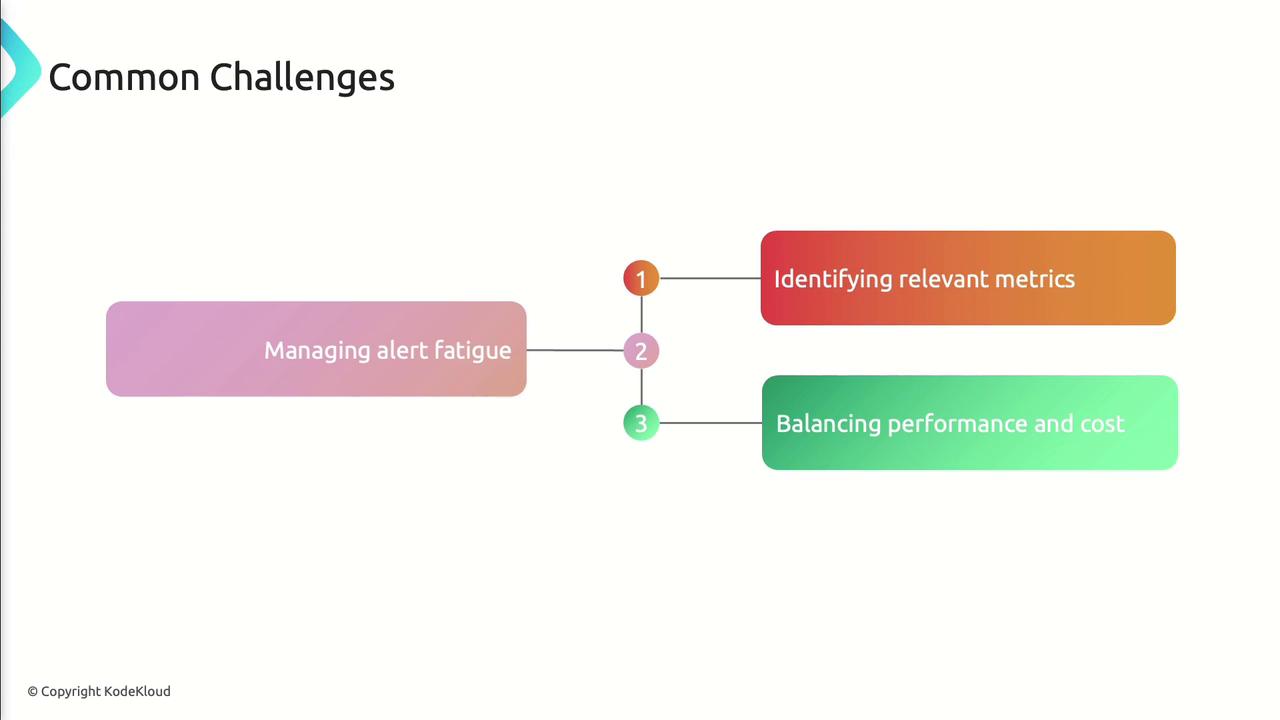
- Alert fatigue from too many notifications
- Difficulty selecting the most relevant metrics
- Balancing performance improvements with budget constraints
References
- Azure Monitor documentation
- Azure Metrics in Azure Portal
- Azure Network Watcher overview
- AZ-400 Exam Guide