

Table of Contents
- Key Features
- Enable Application Insights in Azure Portal
- Add the Application Insights SDK
- Configure the Instrumentation Key
- Explore Telemetry in Application Insights
- Configure Alerts
- Diagnostic Settings & Log Analytics
- References
Key Features
Enable Application Insights in Azure Portal
- In the Azure Portal, create or select your Web App (e.g., KodeKloud Support).
- Under Deployment > Networking, configure required networking options.
- Navigate to Monitor and Secure, toggle Application Insights to Yes.
- Choose an existing resource or create a new one for KodeKloud Support.
- (Optional) Enable Defender for additional security monitoring.
- Click Review + create to finalize.
Ensure your Azure role has
Monitoring Contributor permissions before enabling Application Insights on the resource.Add the Application Insights SDK
Open your project in Visual Studio and update your front‐end page if needed. For example, your Index.cshtml might look like this:Configure the Instrumentation Key
- In the Azure Portal, go to Monitor > Application Insights > KodeKloud Support.
- Under Instrument your application, select .NET and the Recommended Basic level.
- Enable the Profiler and click Apply.
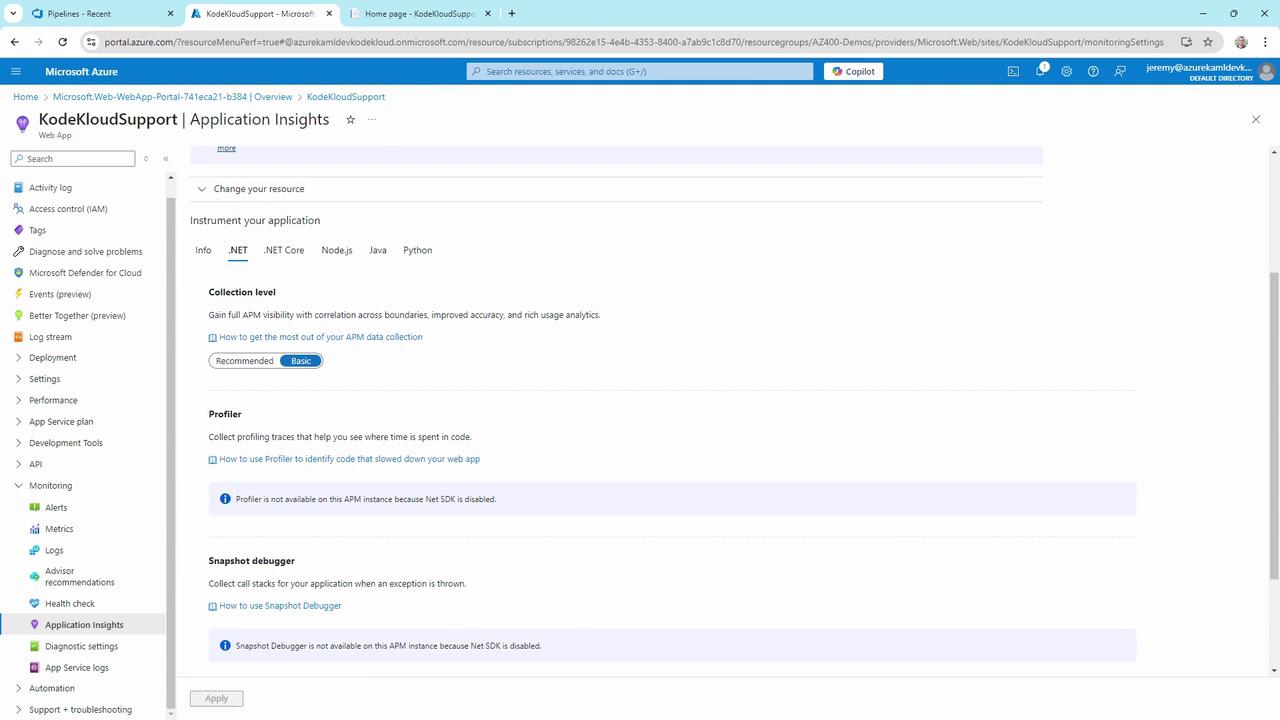
- Copy the Instrumentation Key, then add it to appsettings.json:
- Update your application startup (
Program.csorStartup.cs):
Do not commit your Instrumentation Key to public repositories. Store secrets securely using Azure Key Vault or environment variables.
Explore Telemetry in Application Insights
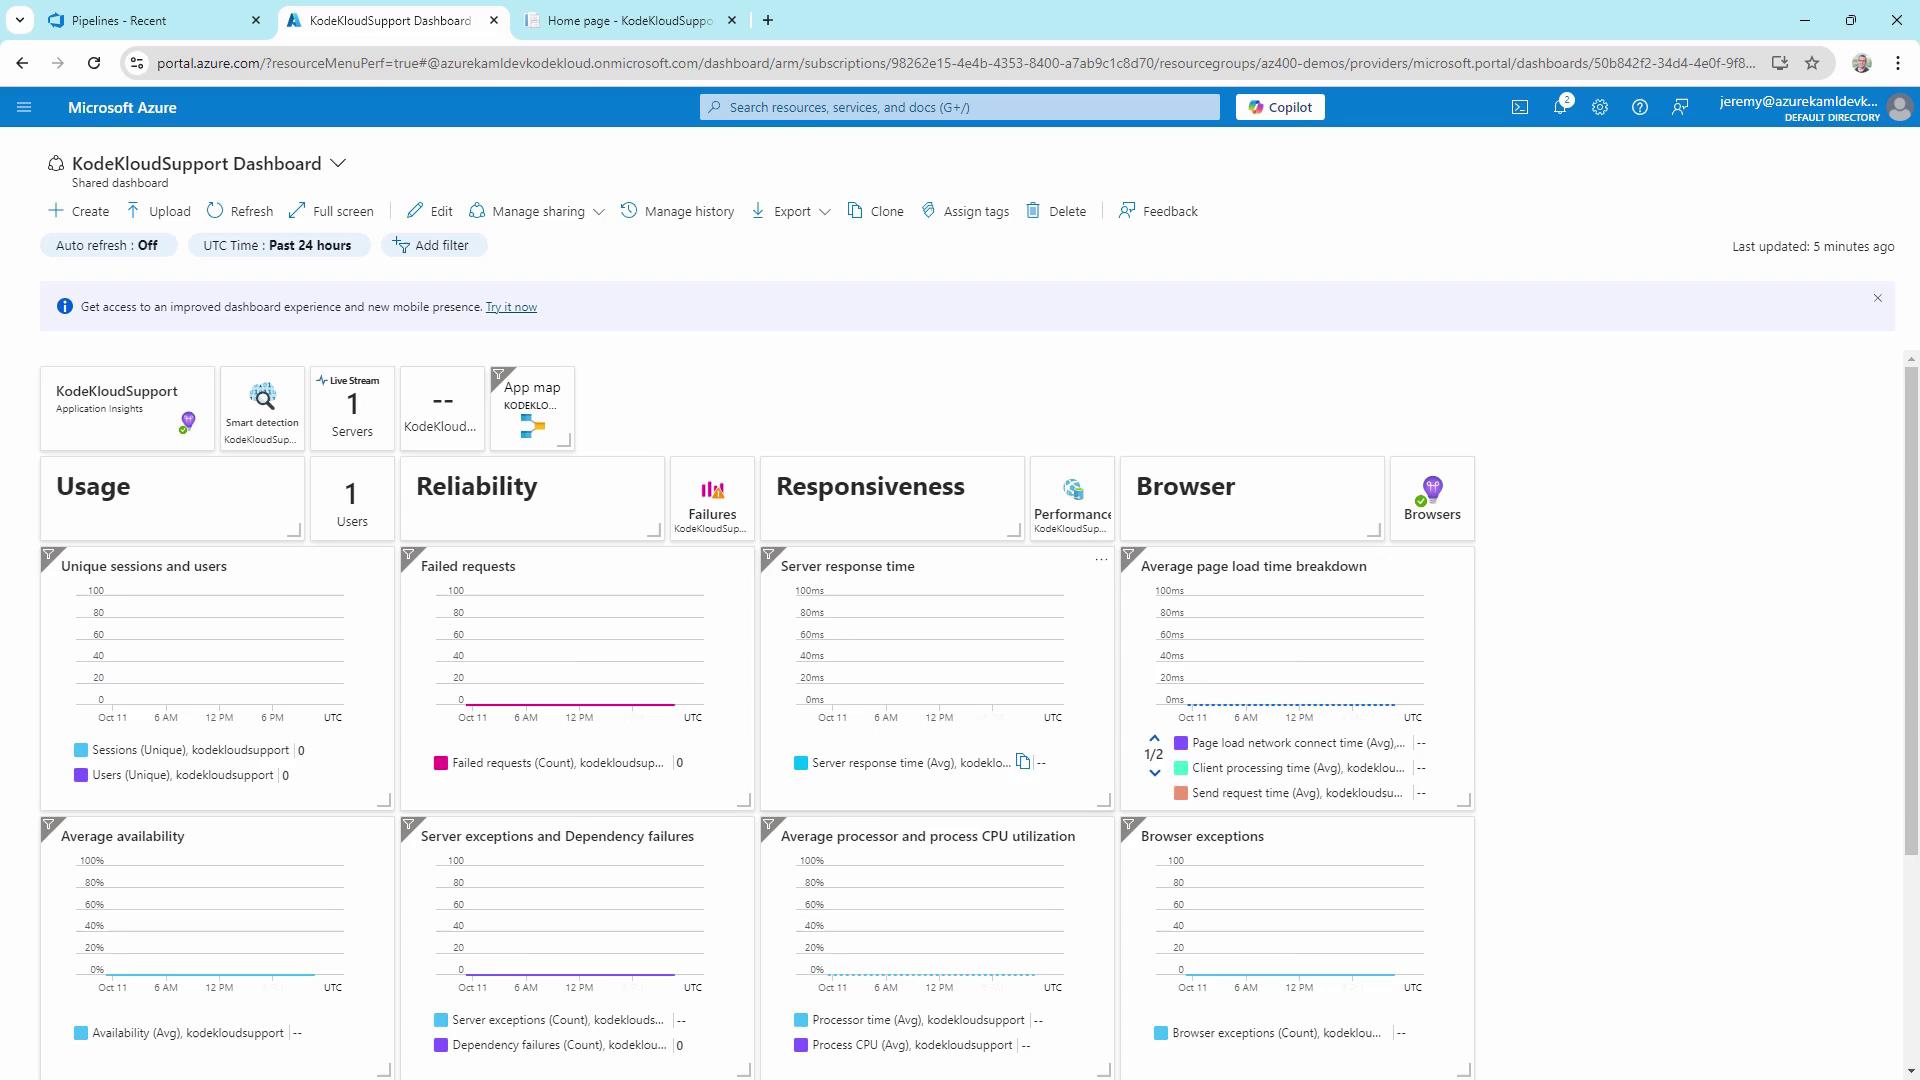
After deployment, navigate to Monitor > Application Insights > KodeKloud Support.Overview Dashboard
The Overview dashboard presents high-level metrics:- Failed requests
- Server response time
- Server requests
- Availability
Live Metrics Stream
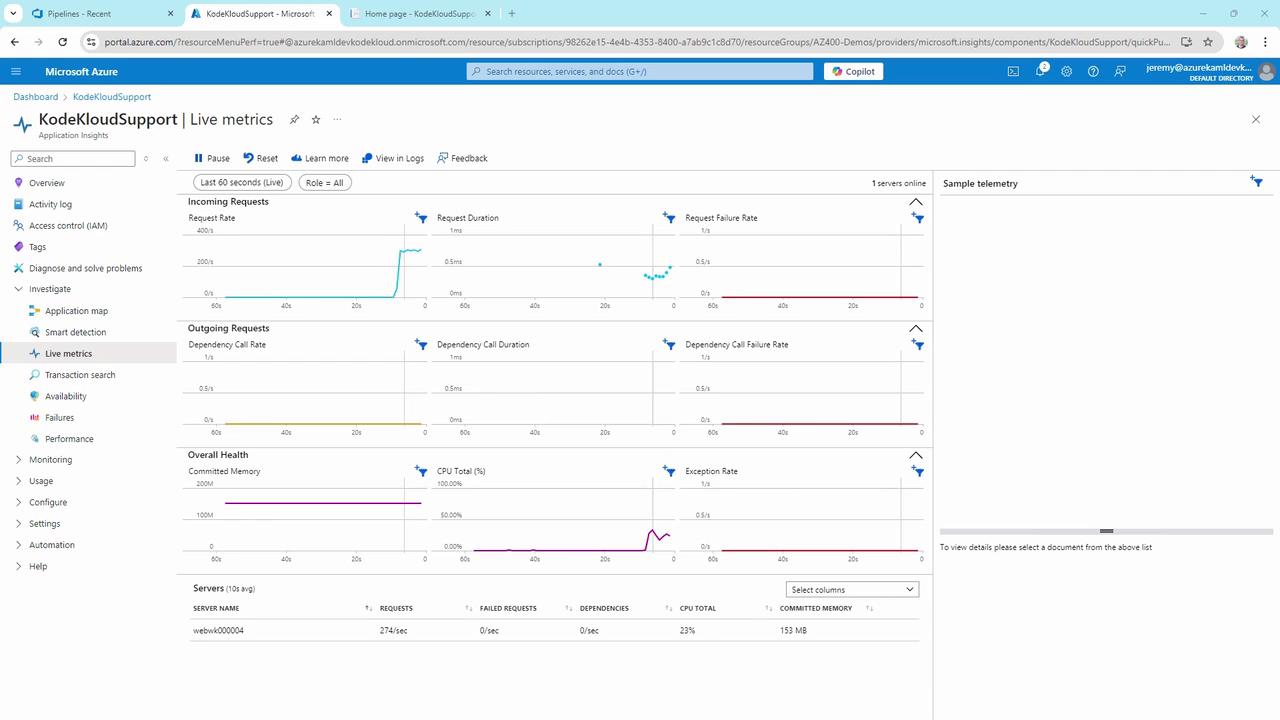
- Go to Live Metrics and reset the view.
- Generate traffic to monitor request rate, duration, CPU usage, and memory in real time.
Application Map
The Application Map visualizes components, dependencies, instance counts, and response times. It also highlights top failures and slowest requests.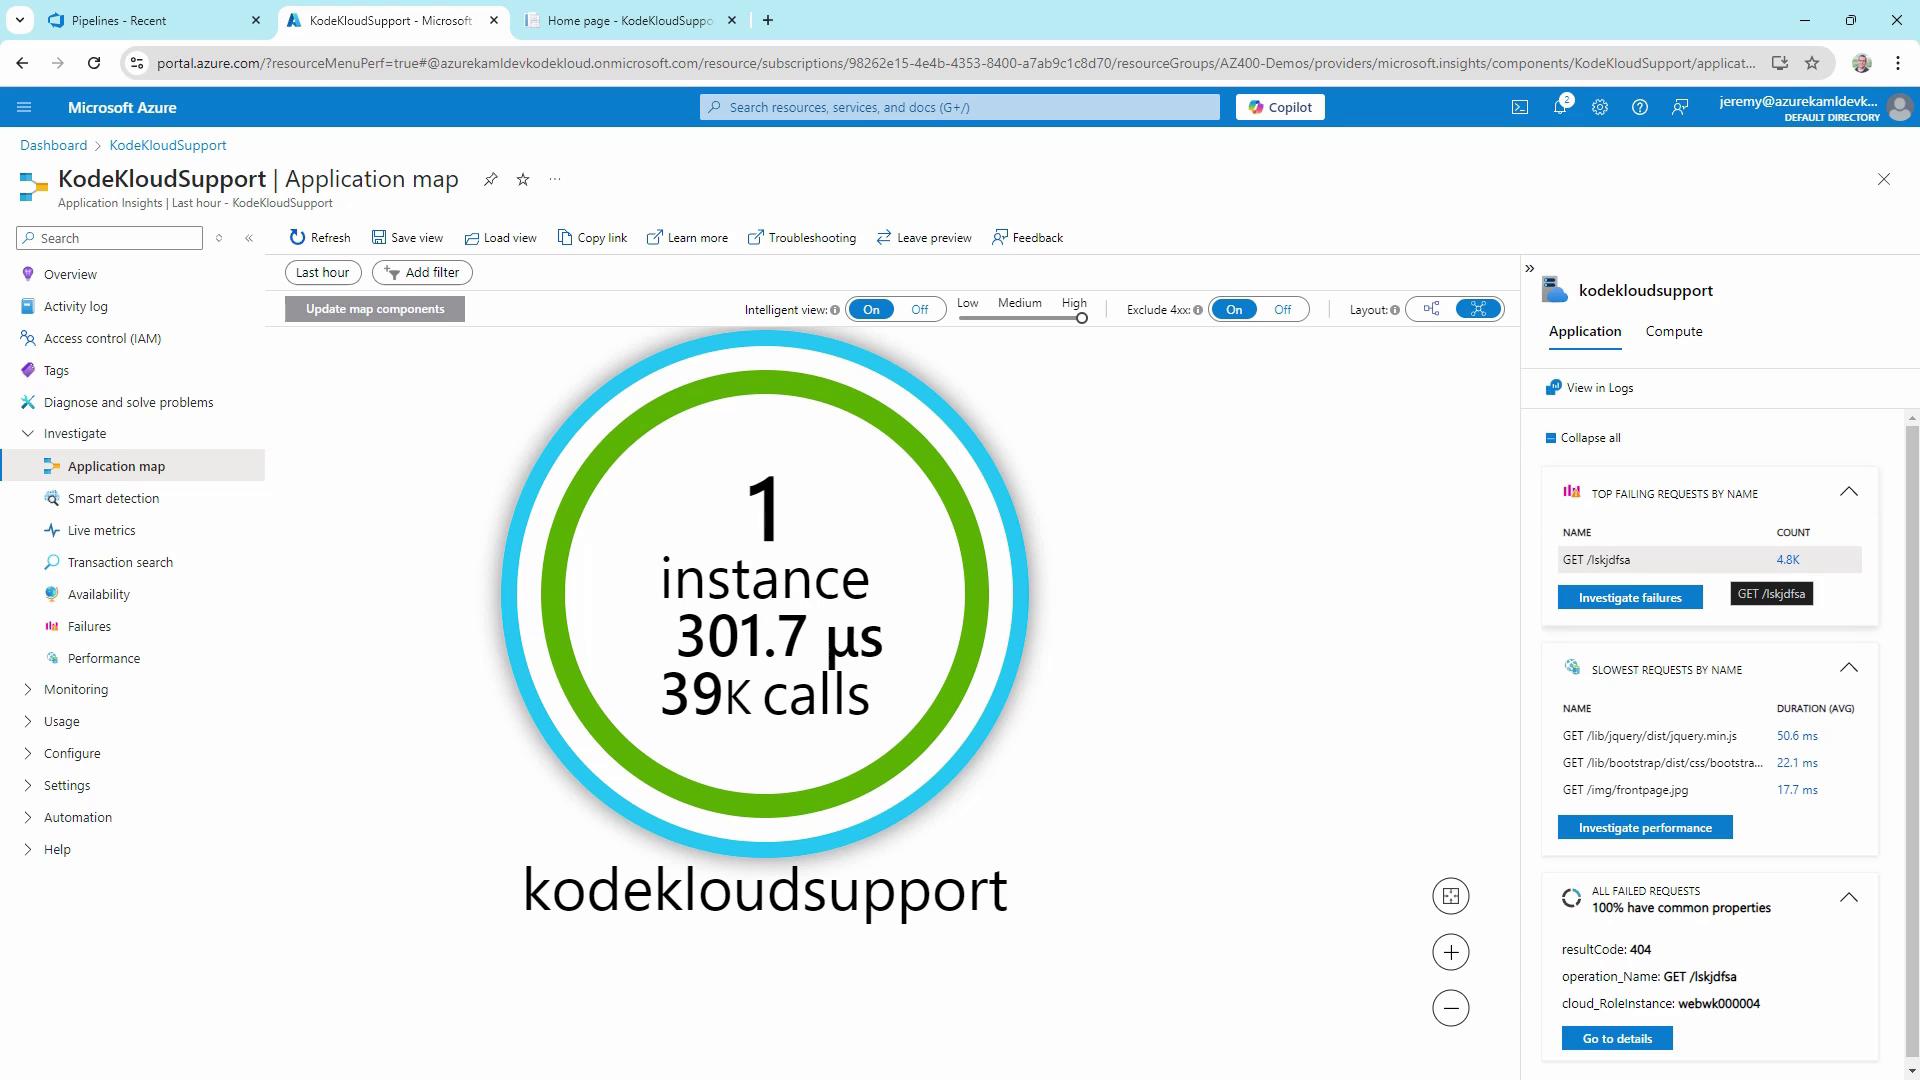
Performance
Review operations by response time to identify slow dependencies or endpoints.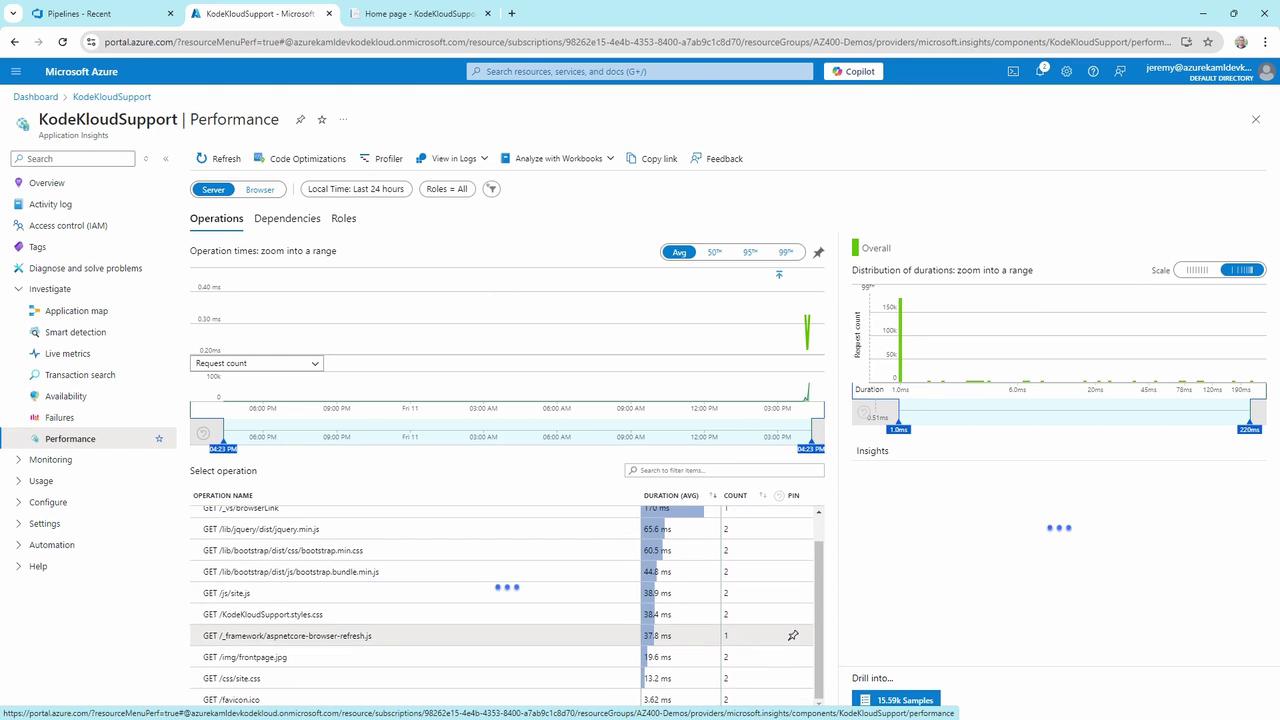
Failures
Inspect error types and counts. In this demo, we intentionally generated 4,800 HTTP 404 errors.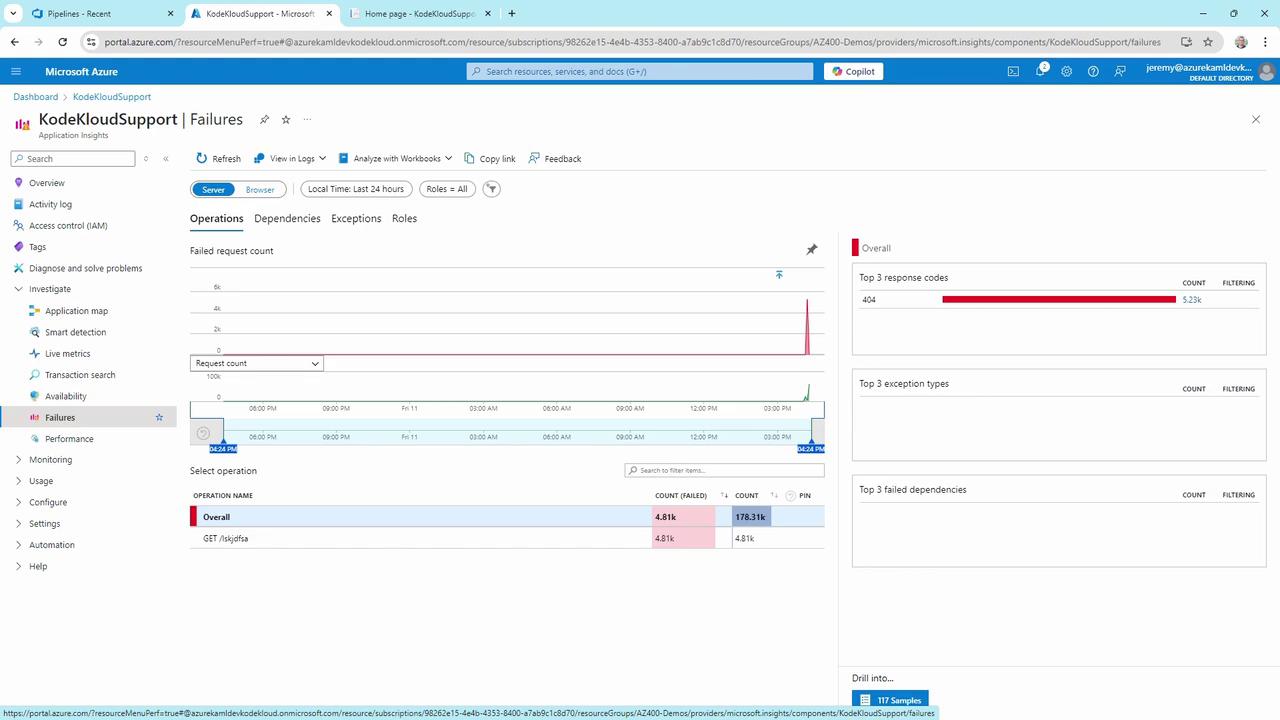
Availability
Track uptime and response trends over time to assess reliability.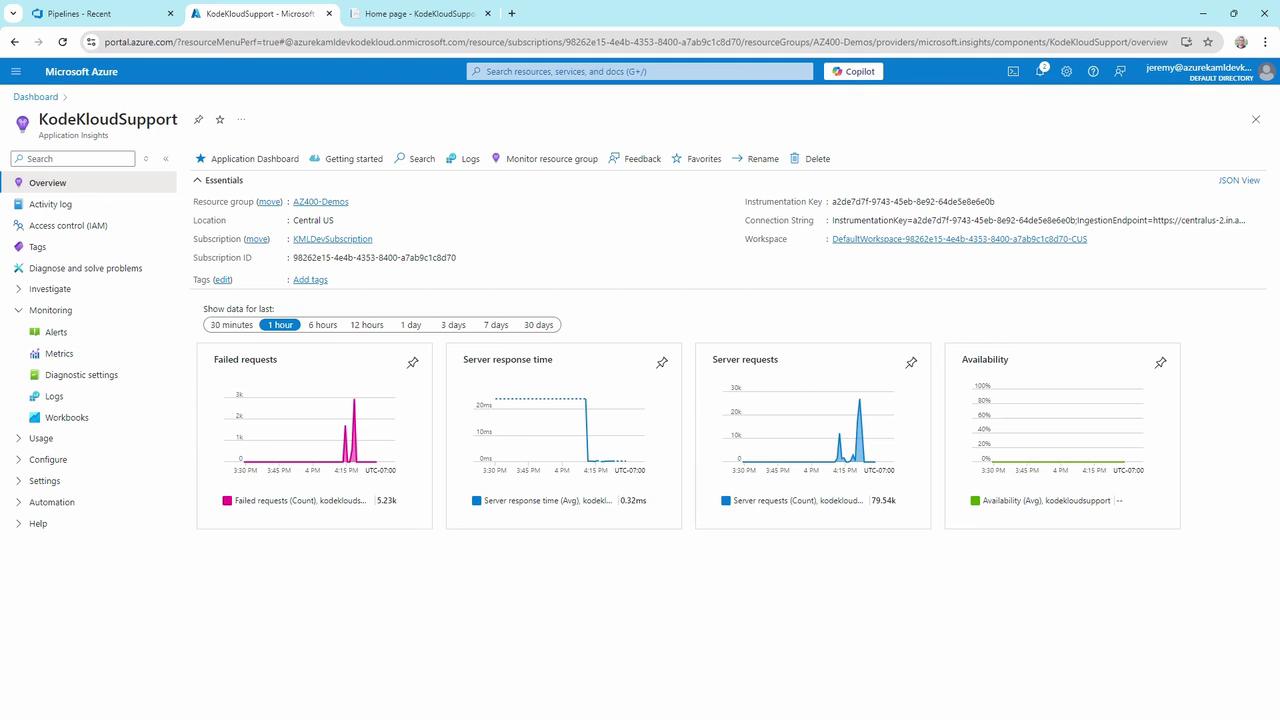
Configure Alerts
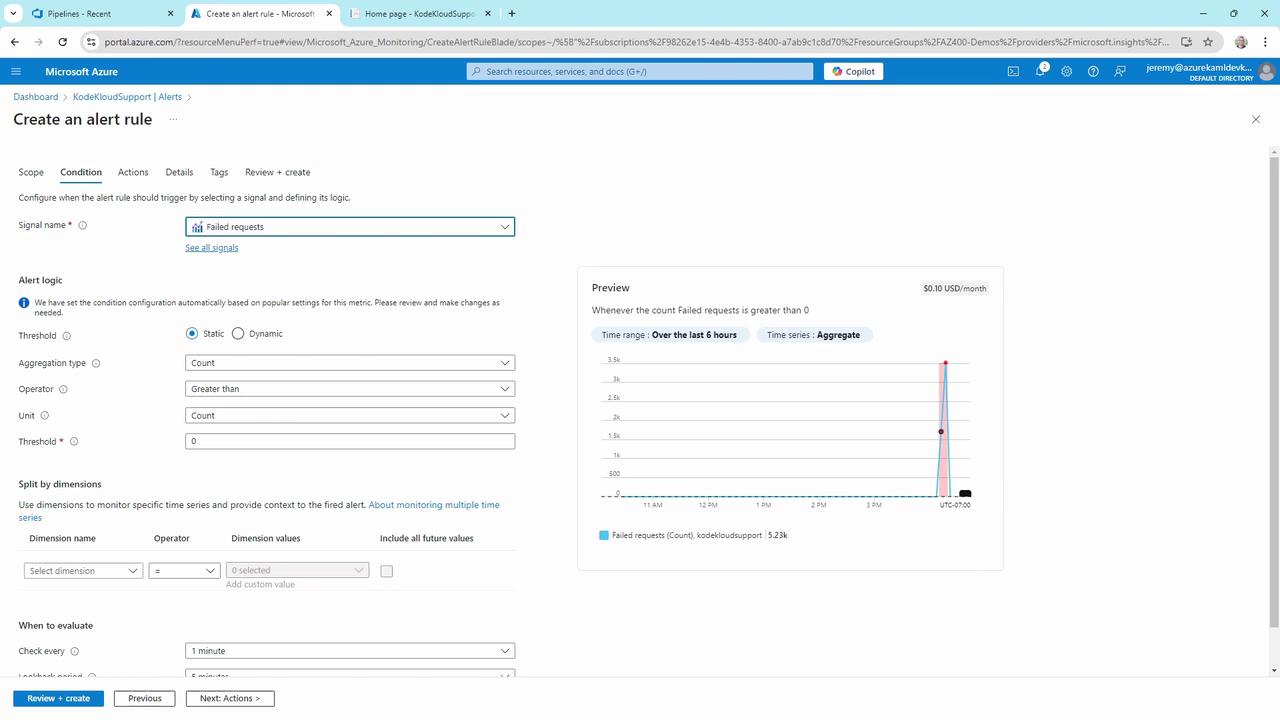
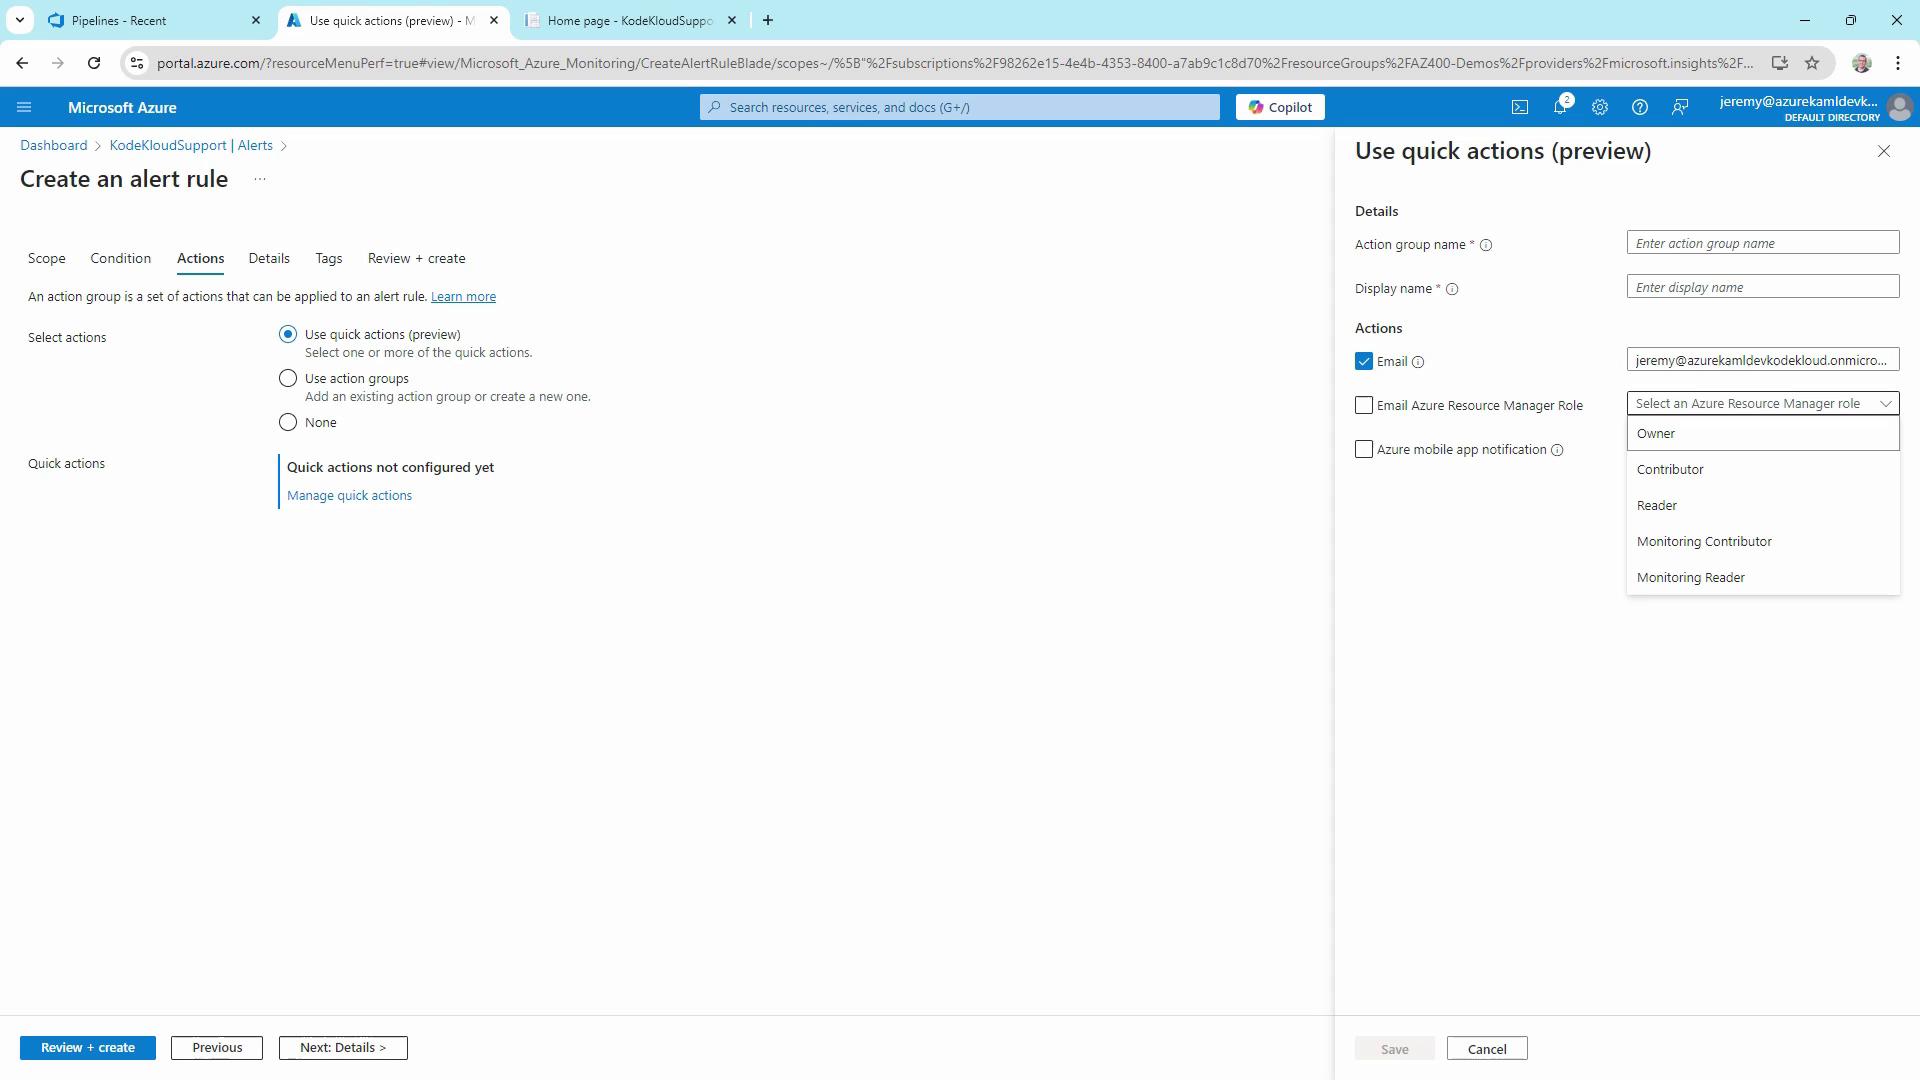
Define alert rules to get notified when metrics cross thresholds.- In the portal, choose Alerts > New alert rule.
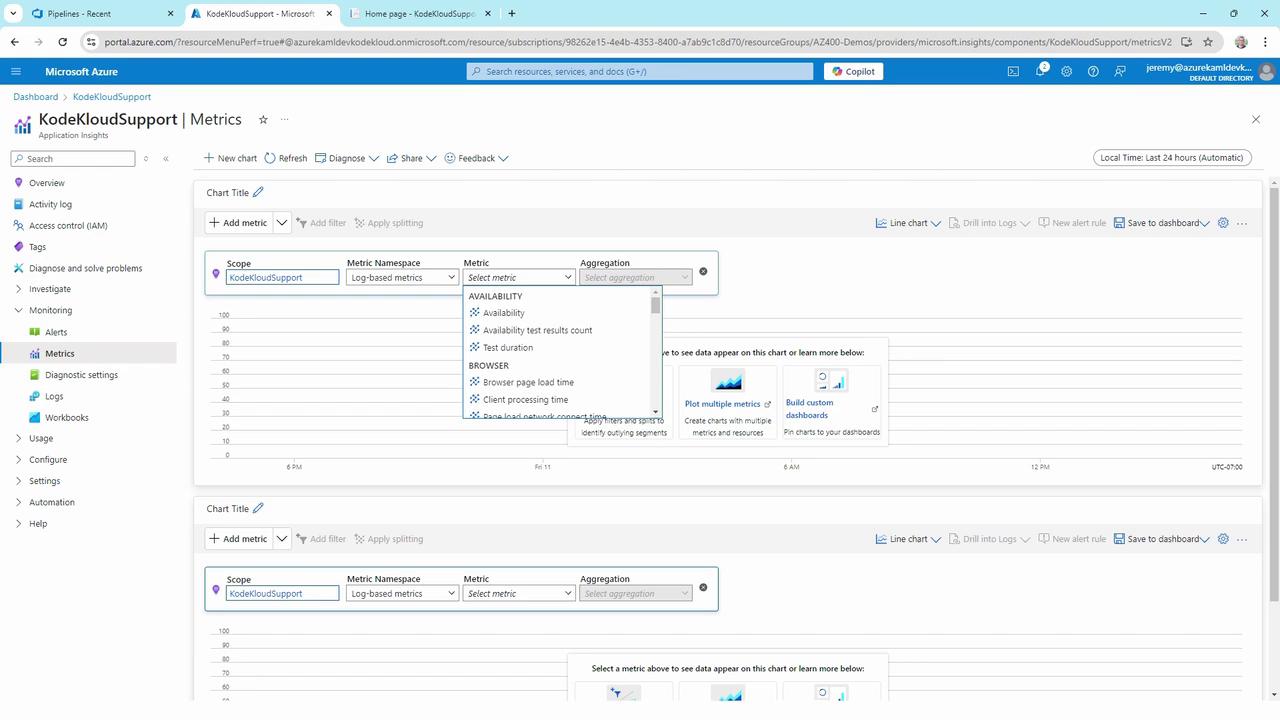
- Select the target resource and signal type (e.g., Failed requests).
- Set the condition logic and threshold.
- On Actions, choose or create an action group to send email, SMS, or webhook notifications.
Diagnostic Settings & Log Analytics
- Under Diagnostic settings, configure streaming export of logs and metrics to storage, Event Hubs, or Log Analytics.
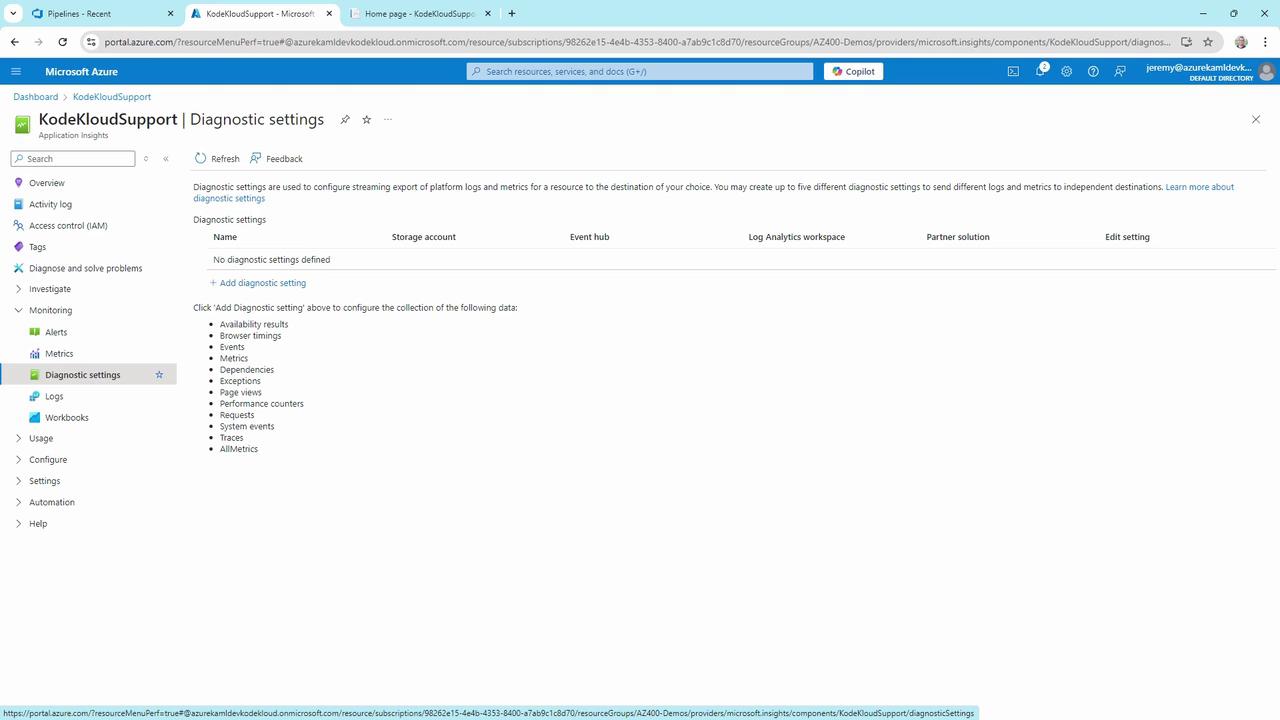
- Use Log Analytics to run Kusto queries on your telemetry and logs for advanced diagnostics.
Leverage Log Analytics workspaces to correlate Application Insights data with other Azure monitor logs.
References
- Azure Monitor Application Insights
- Kusto Query Language (KQL)
- Secure your secrets with Azure Key Vault