

What Is Telemetry in Azure?
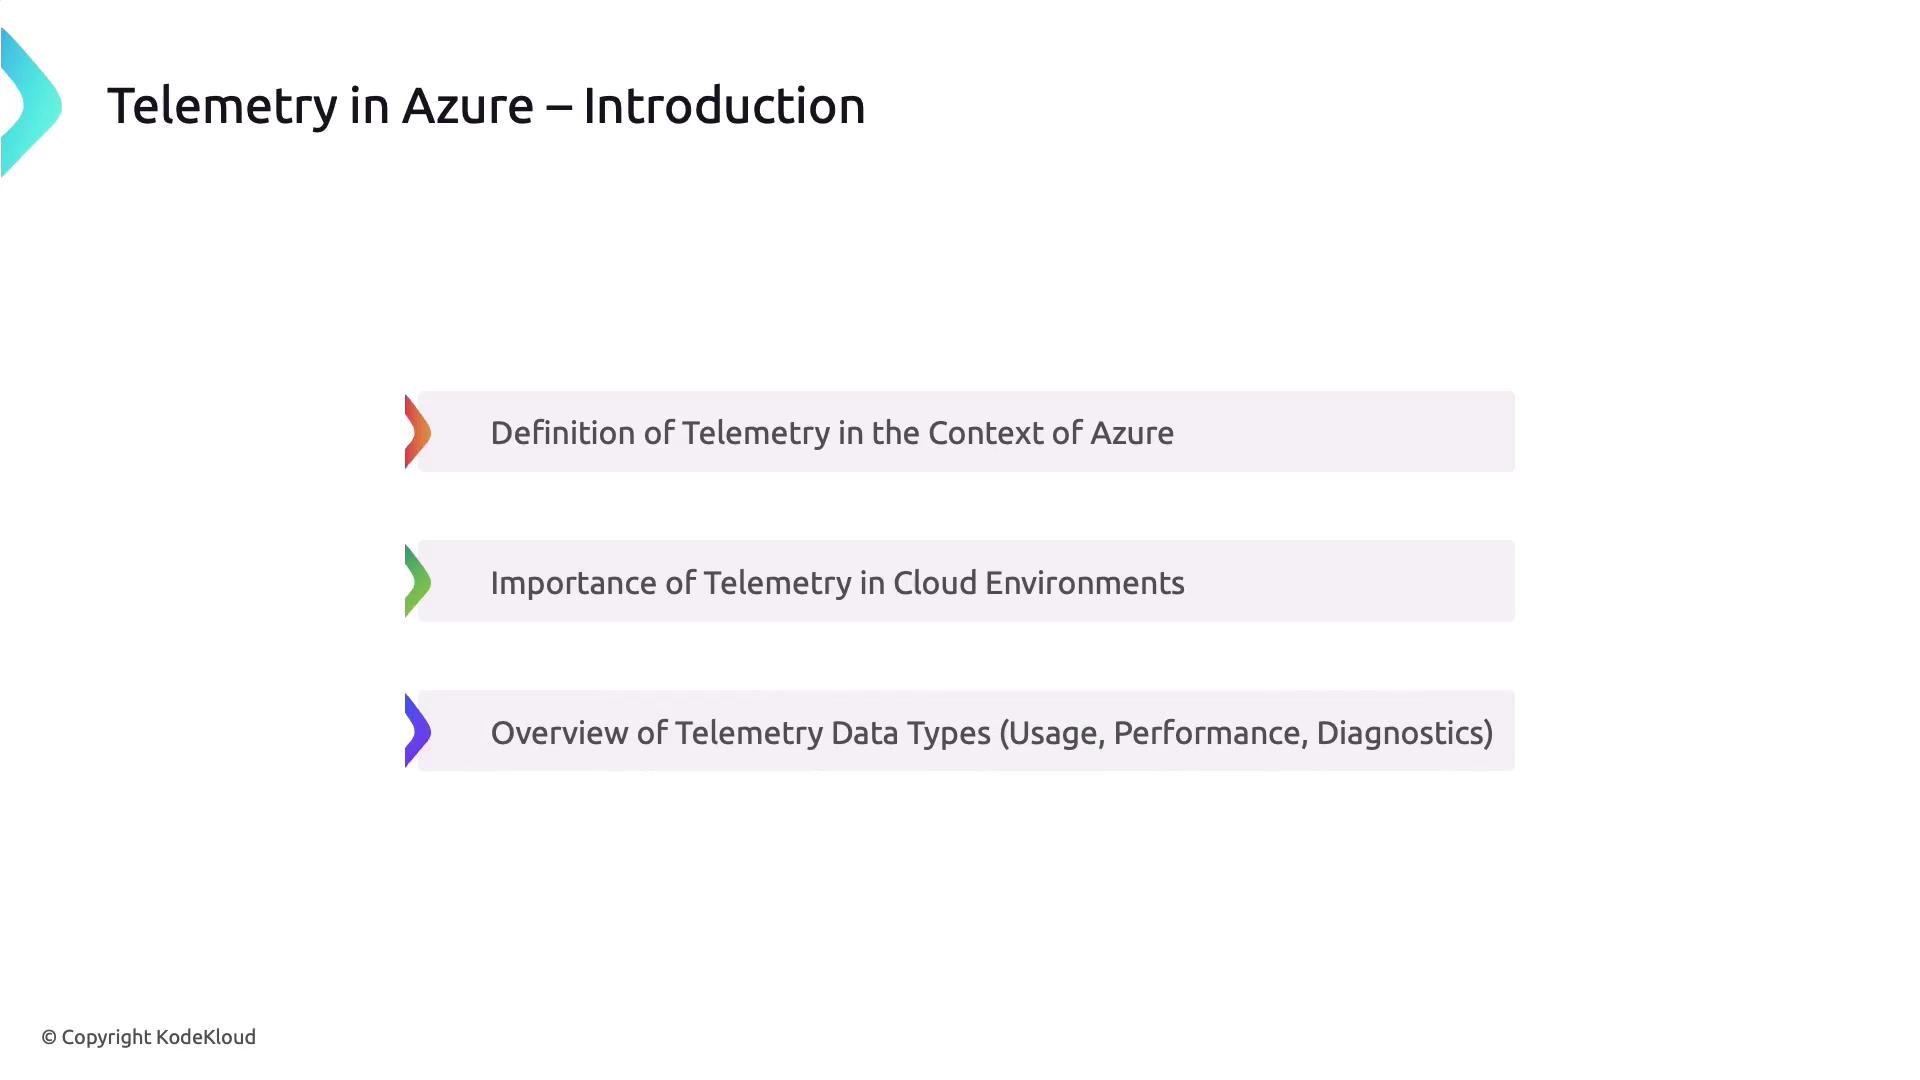
Telemetry in Azure is the automated gathering and centralized reporting of your application and infrastructure data. By streaming usage counts, response times, error logs, and more into a unified platform, you can:- Detect issues before they impact users
- Track performance trends over time
- Maintain visibility across distributed services
Why Telemetry Matters
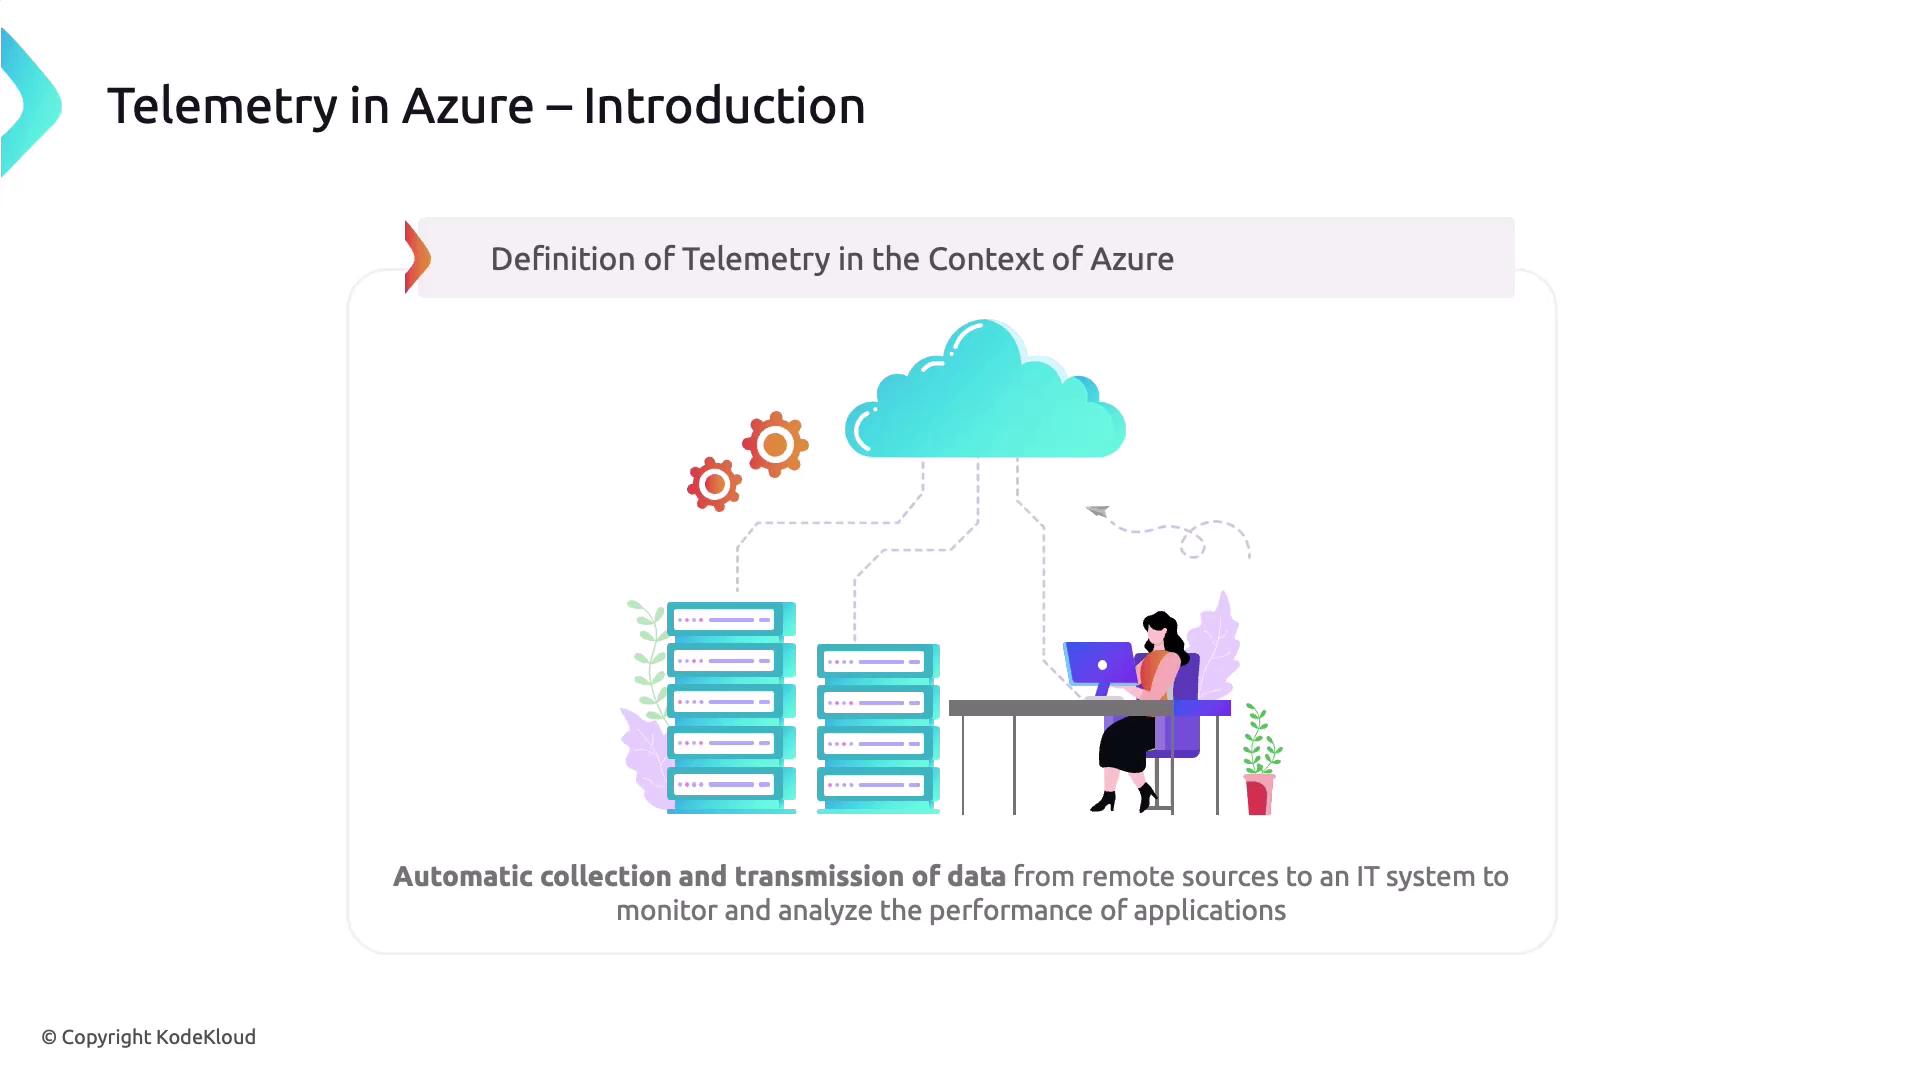
Implementing comprehensive telemetry in a cloud environment helps you:- Maintain real-time visibility and avoid “flying blind”
- Proactively surface and resolve anomalies
- Optimize resource utilization and control costs
Types of Telemetry Data
Azure captures three primary telemetry categories:
Key Azure Services for Telemetry
Azure provides three core services to collect and analyze telemetry: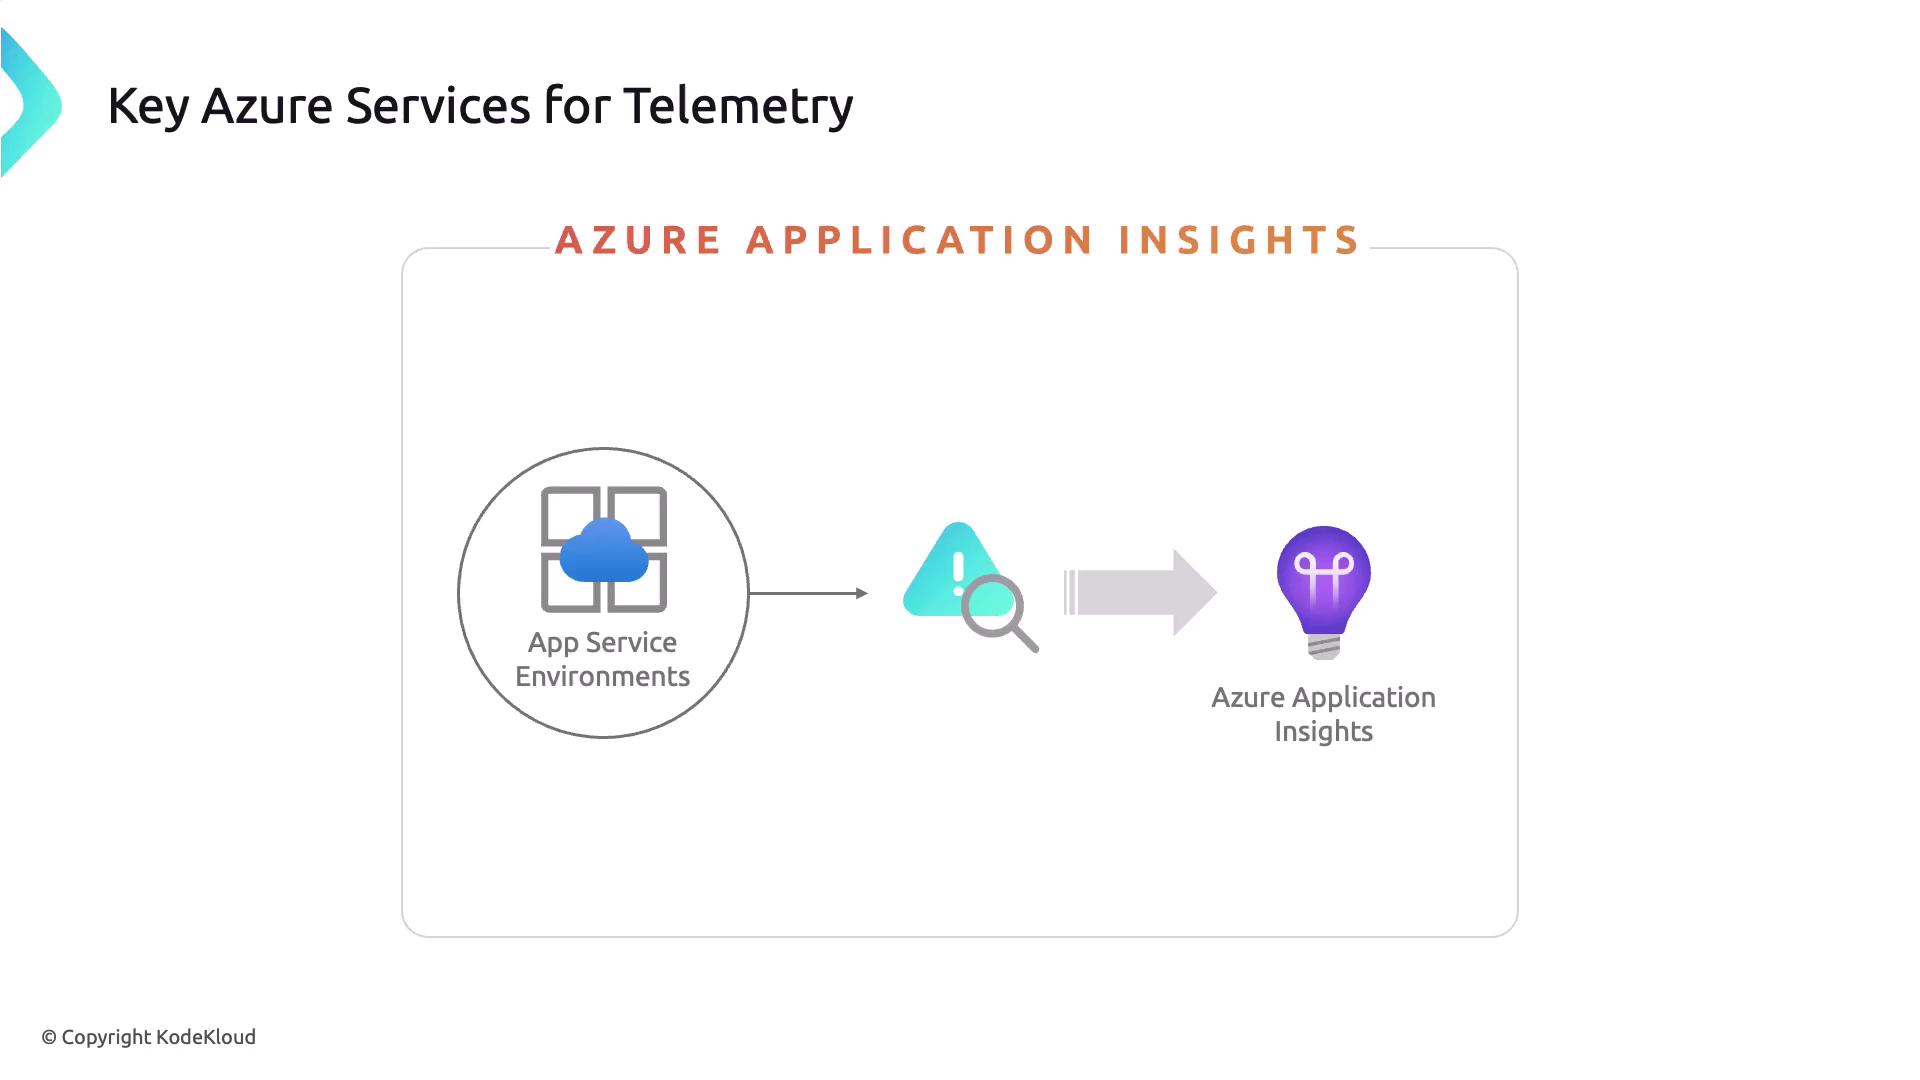
Setting Up Azure Monitor
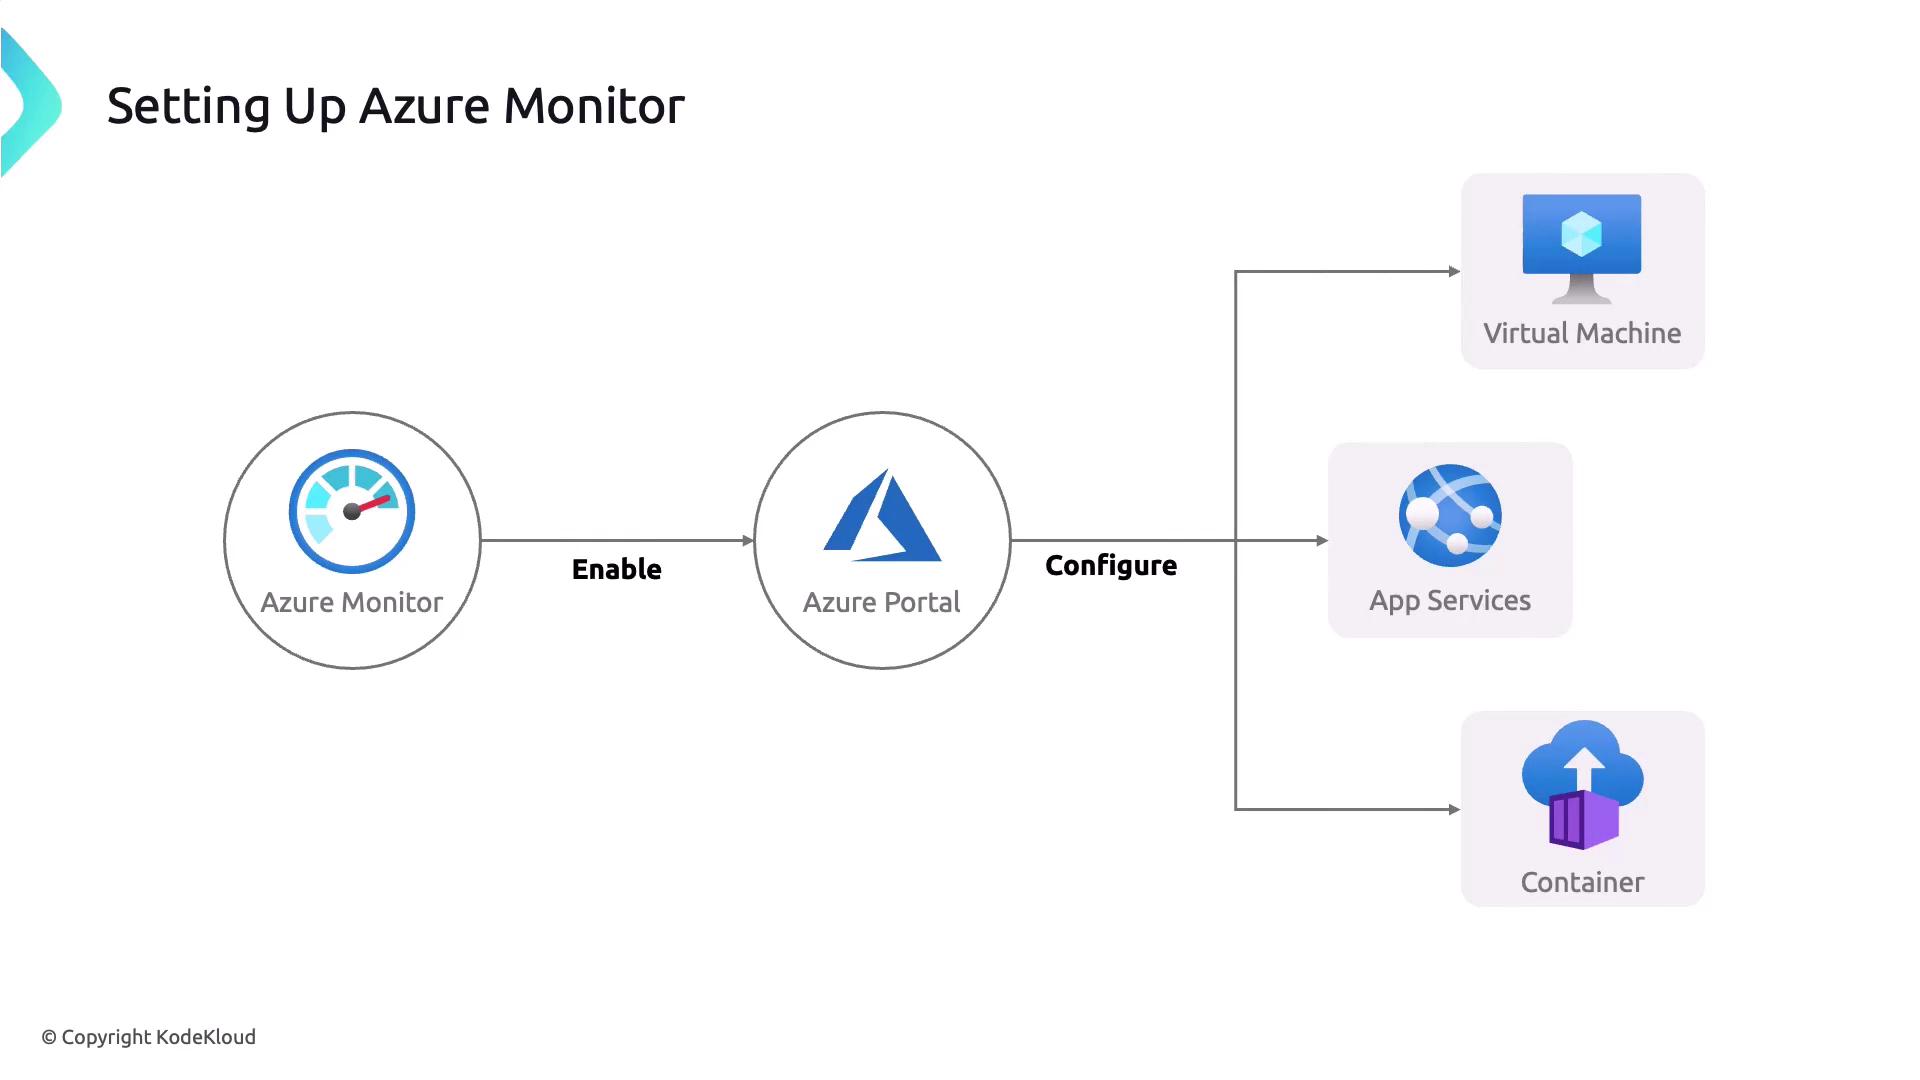
Follow these steps to onboard resources into Azure Monitor:- Enable Azure Monitor in the Azure Portal under Monitor > Overview.
- Add data sources such as Virtual Machines, App Services, and Containers.
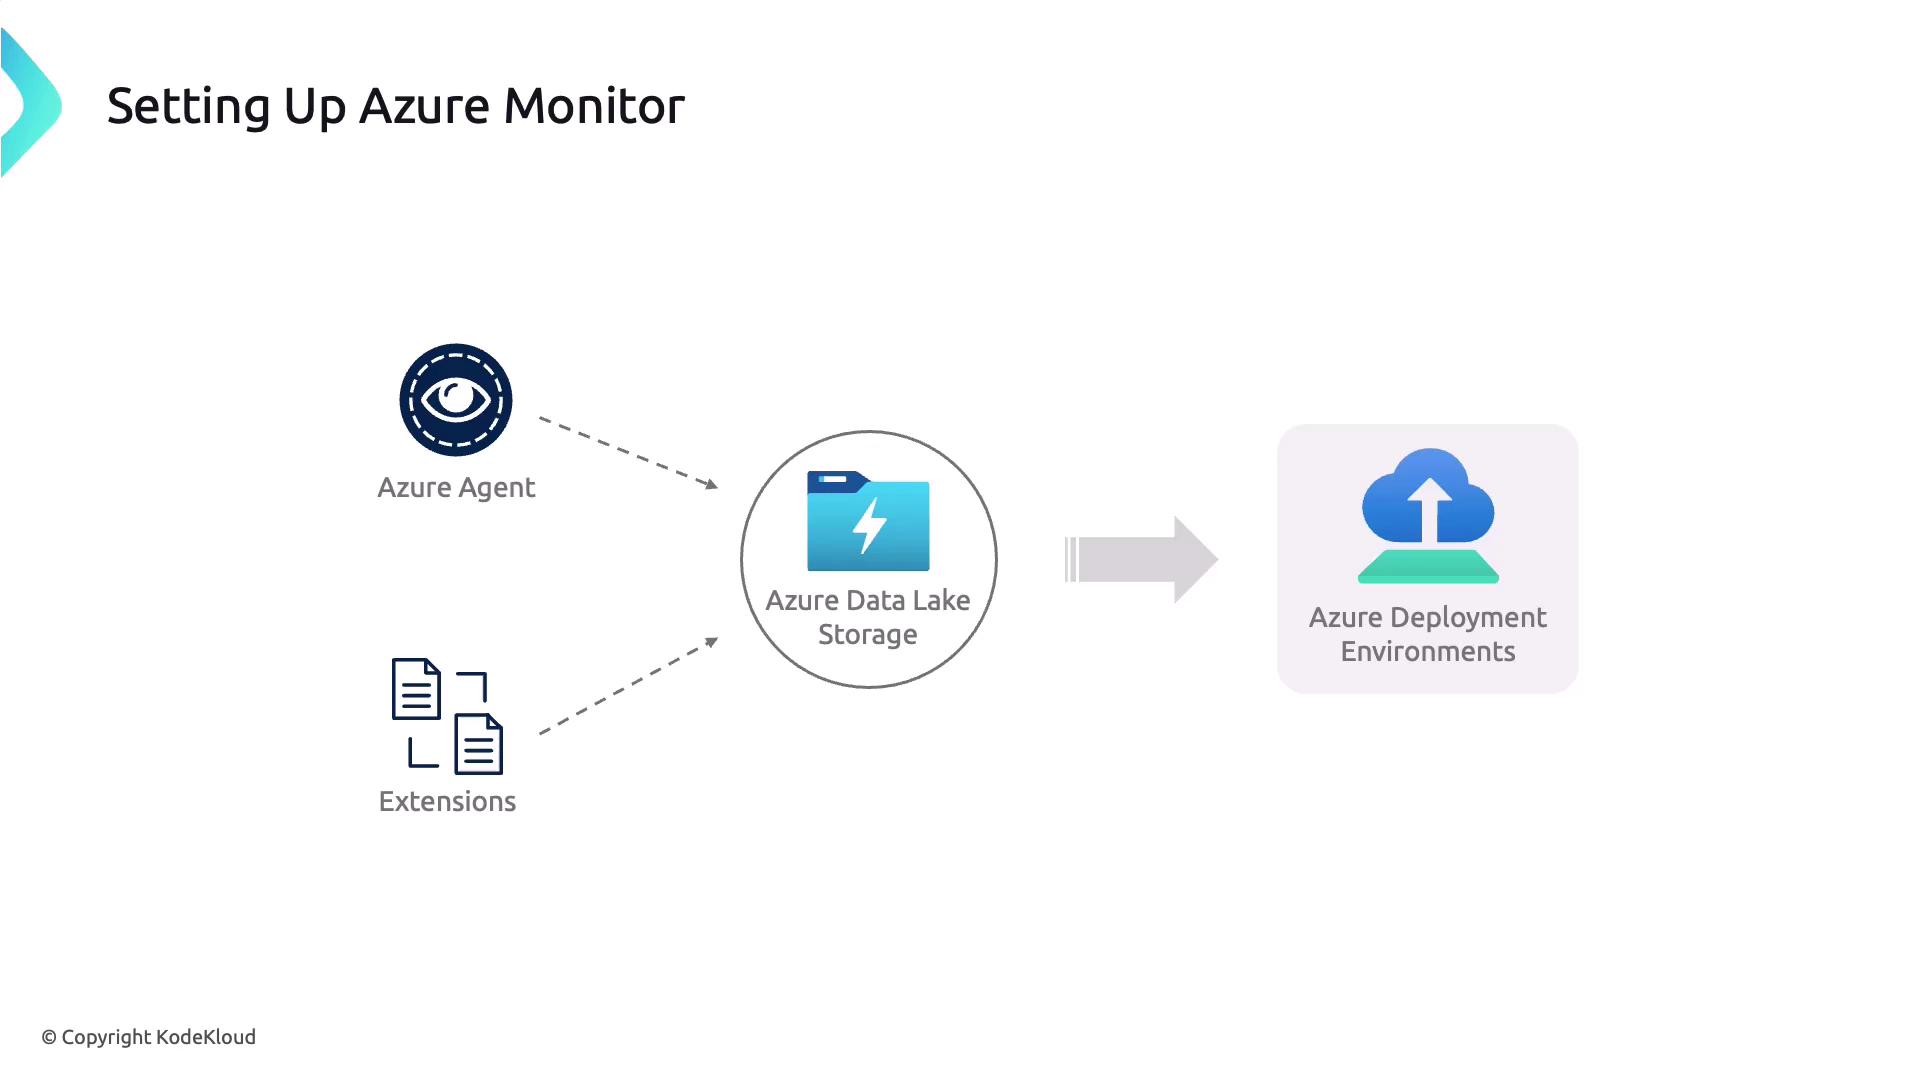
- Install agents and extensions on VMs or AKS clusters to stream logs and metrics.
- Route data to Log Analytics workspaces, Storage accounts, or Event Hubs.
You need Owner or Contributor permissions on the target resource to deploy monitoring agents.
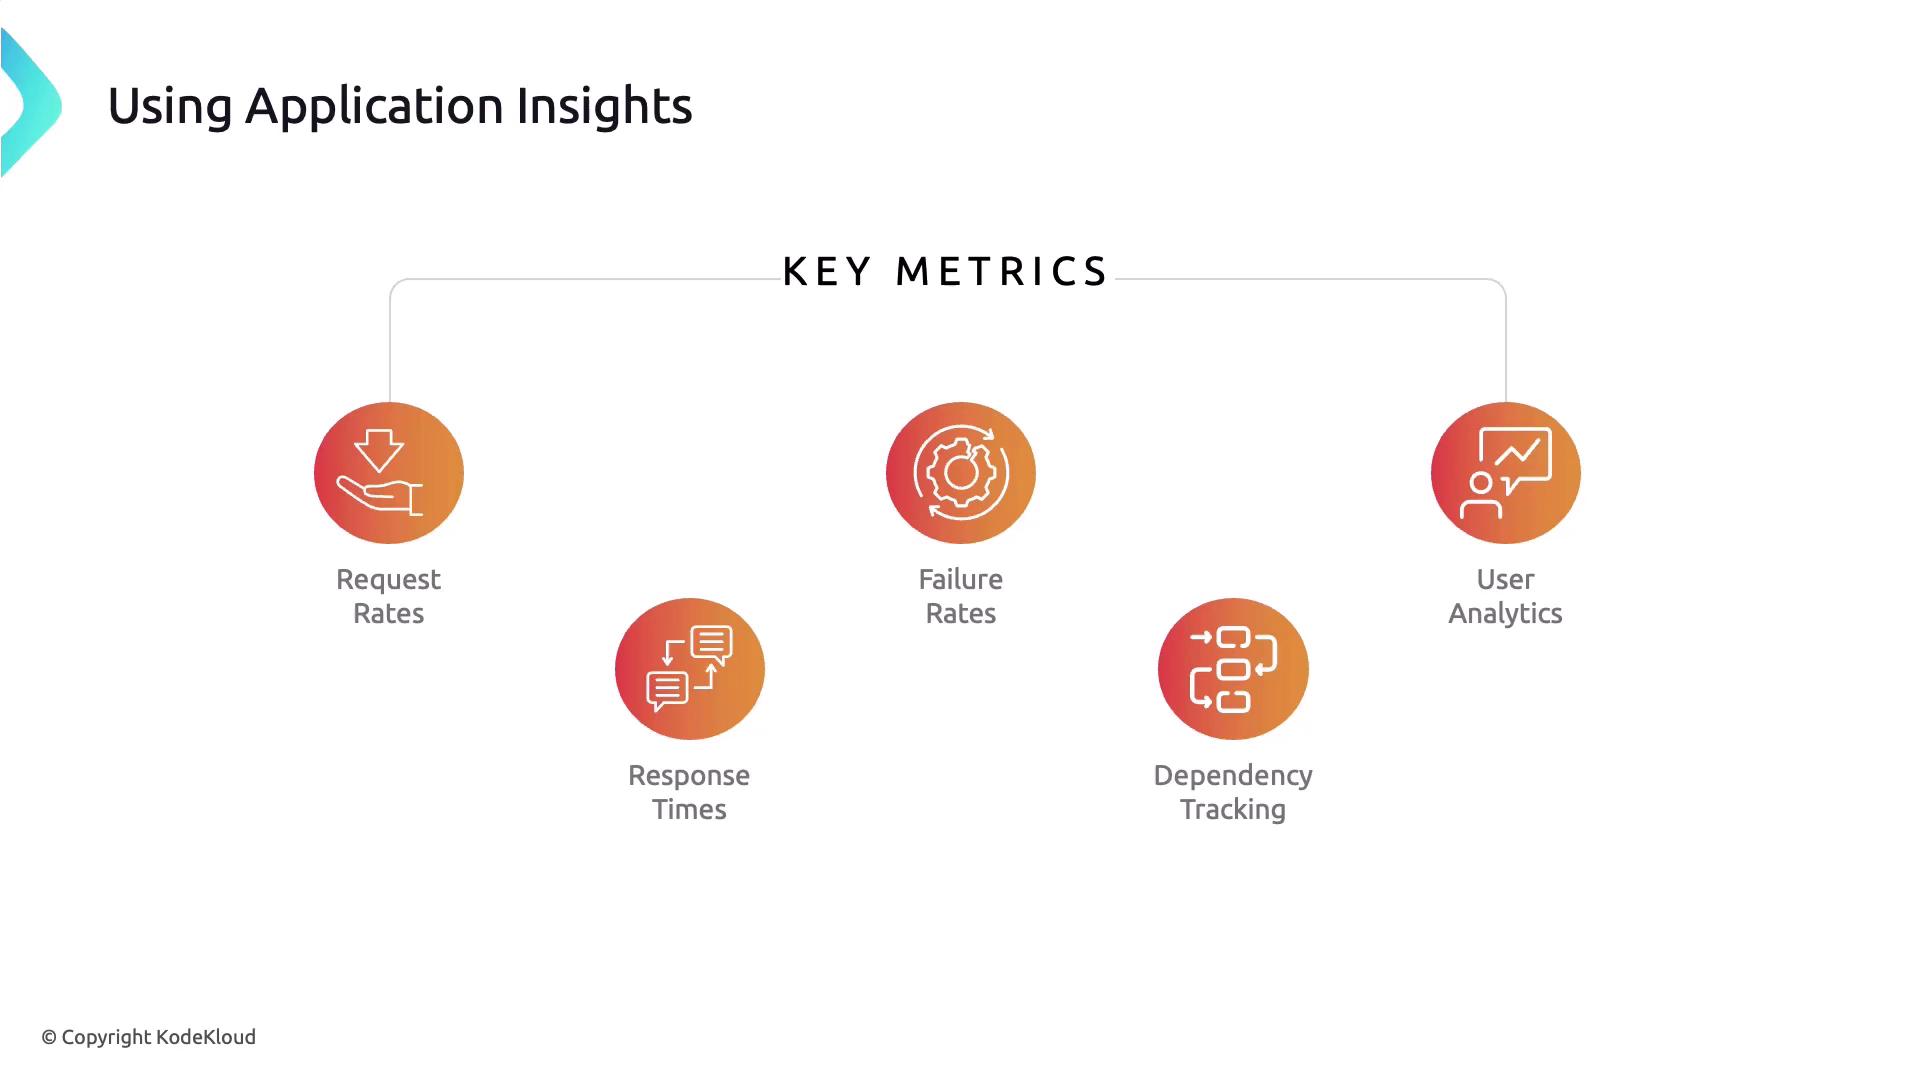
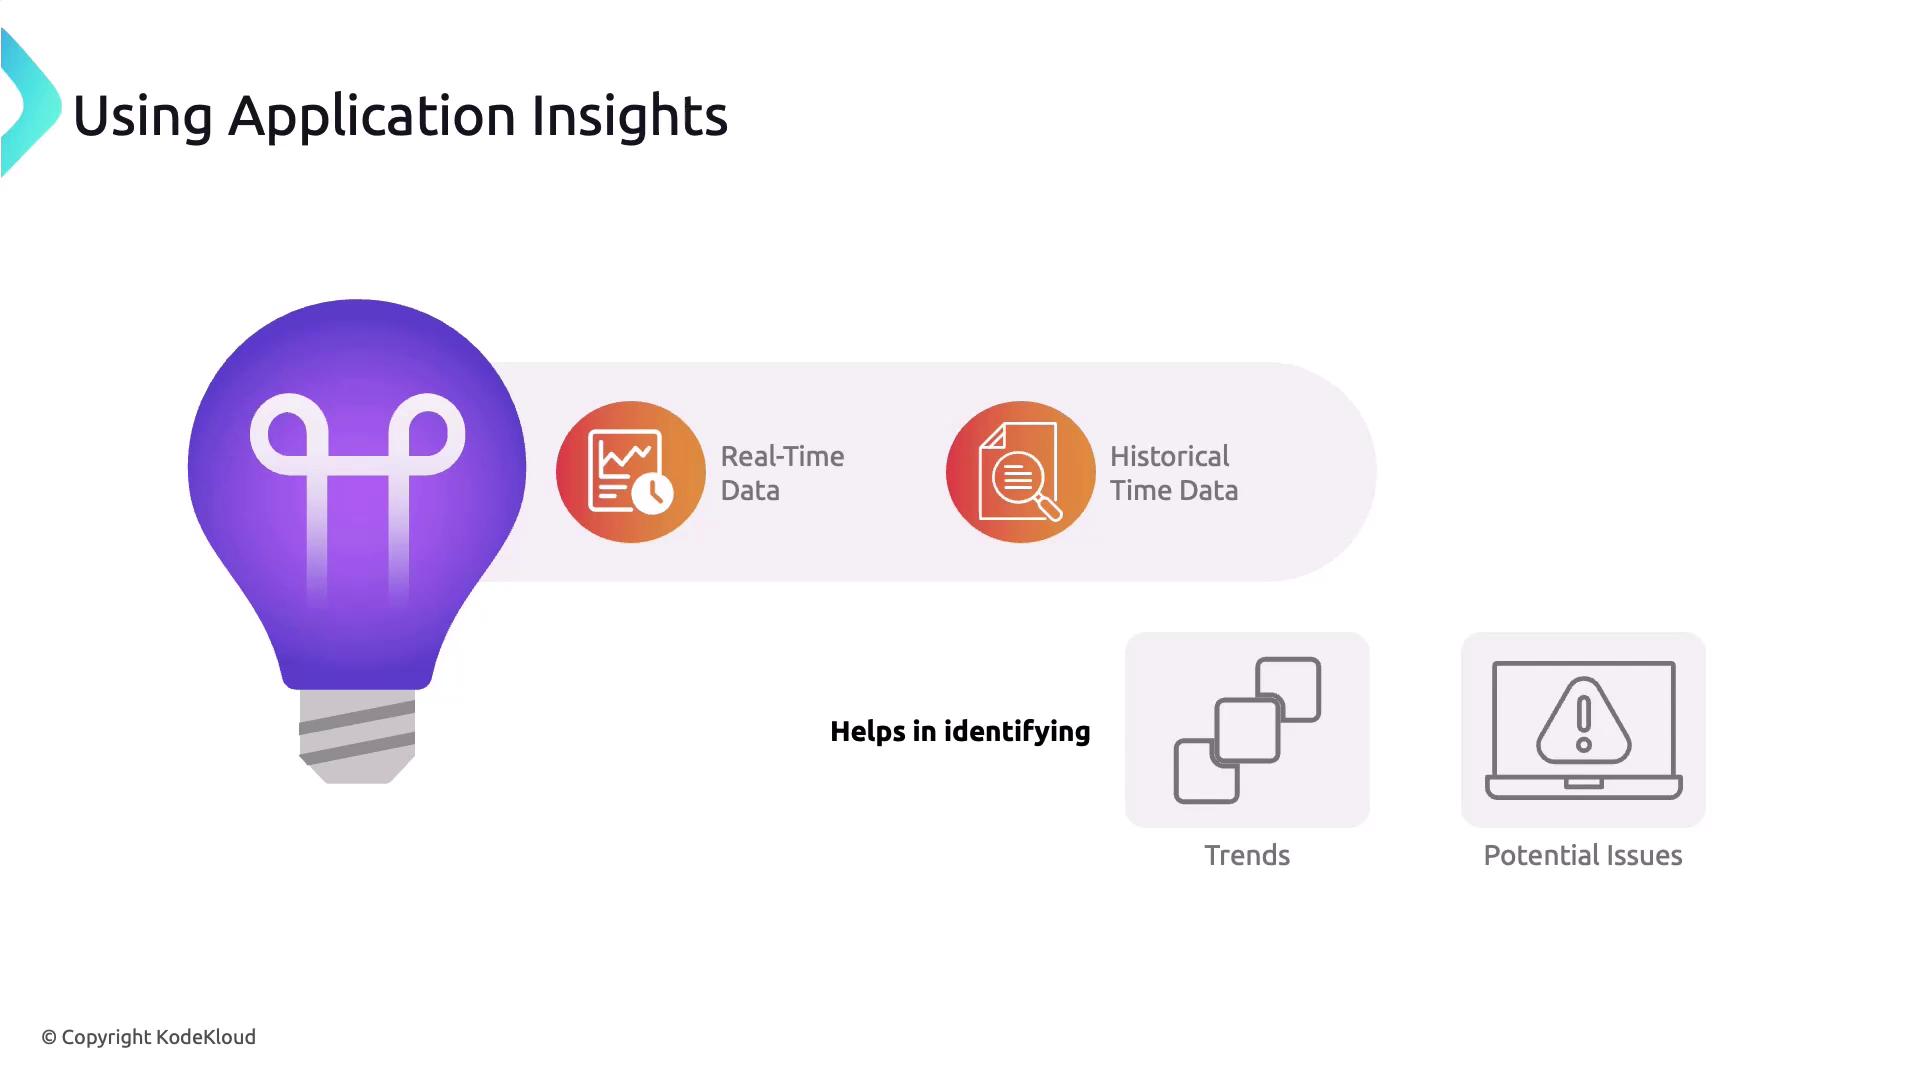
Integrating Azure Application Insights
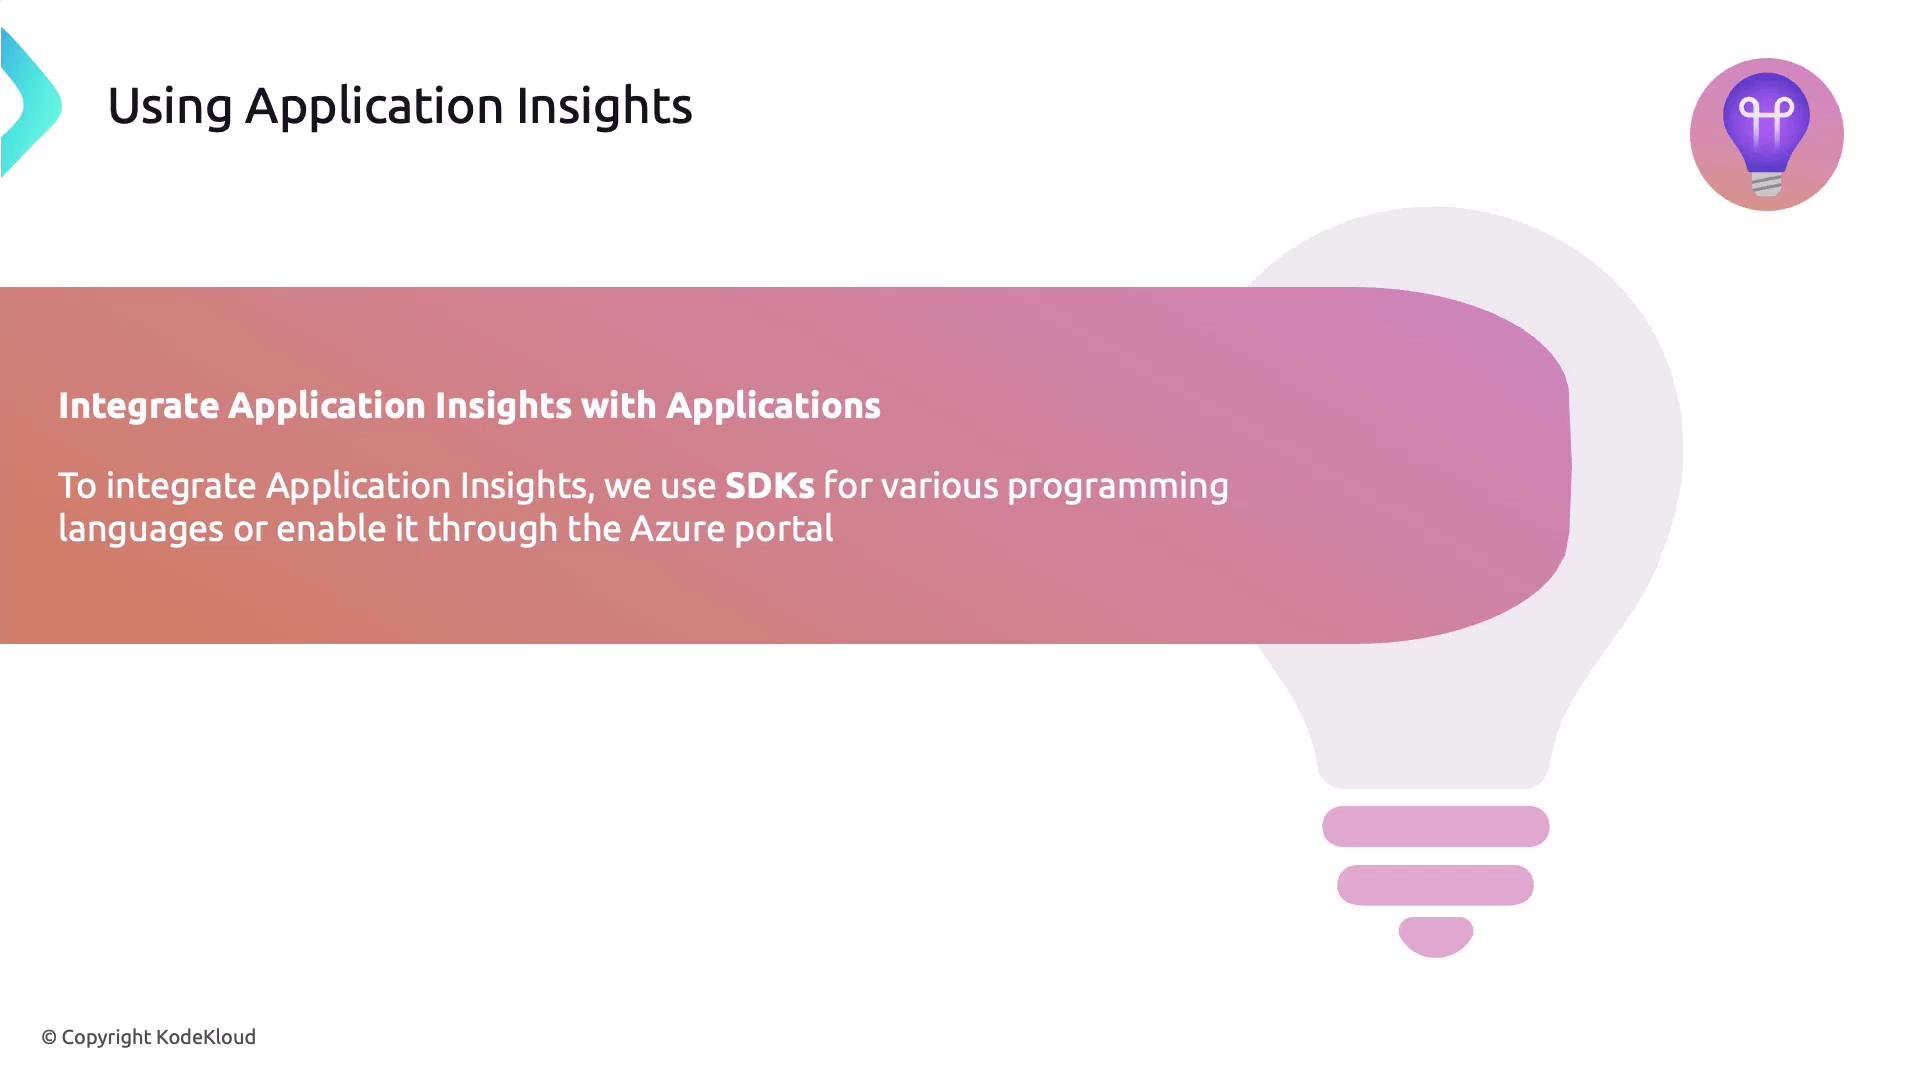
Add Application Insights to web apps and services via SDKs or the Azure Portal:- Install the language-specific SDK (e.g., .NET, Java, Node.js).
- Configure instrumentation keys or connection strings.
- Enable auto-collection for HTTP requests, dependencies, and exceptions.
Working with Azure Log Analytics
A Log Analytics workspace centralizes log data from Azure services, on-premises systems, and custom apps. Use the Kusto Query Language (KQL) to filter, aggregate, and visualize logs.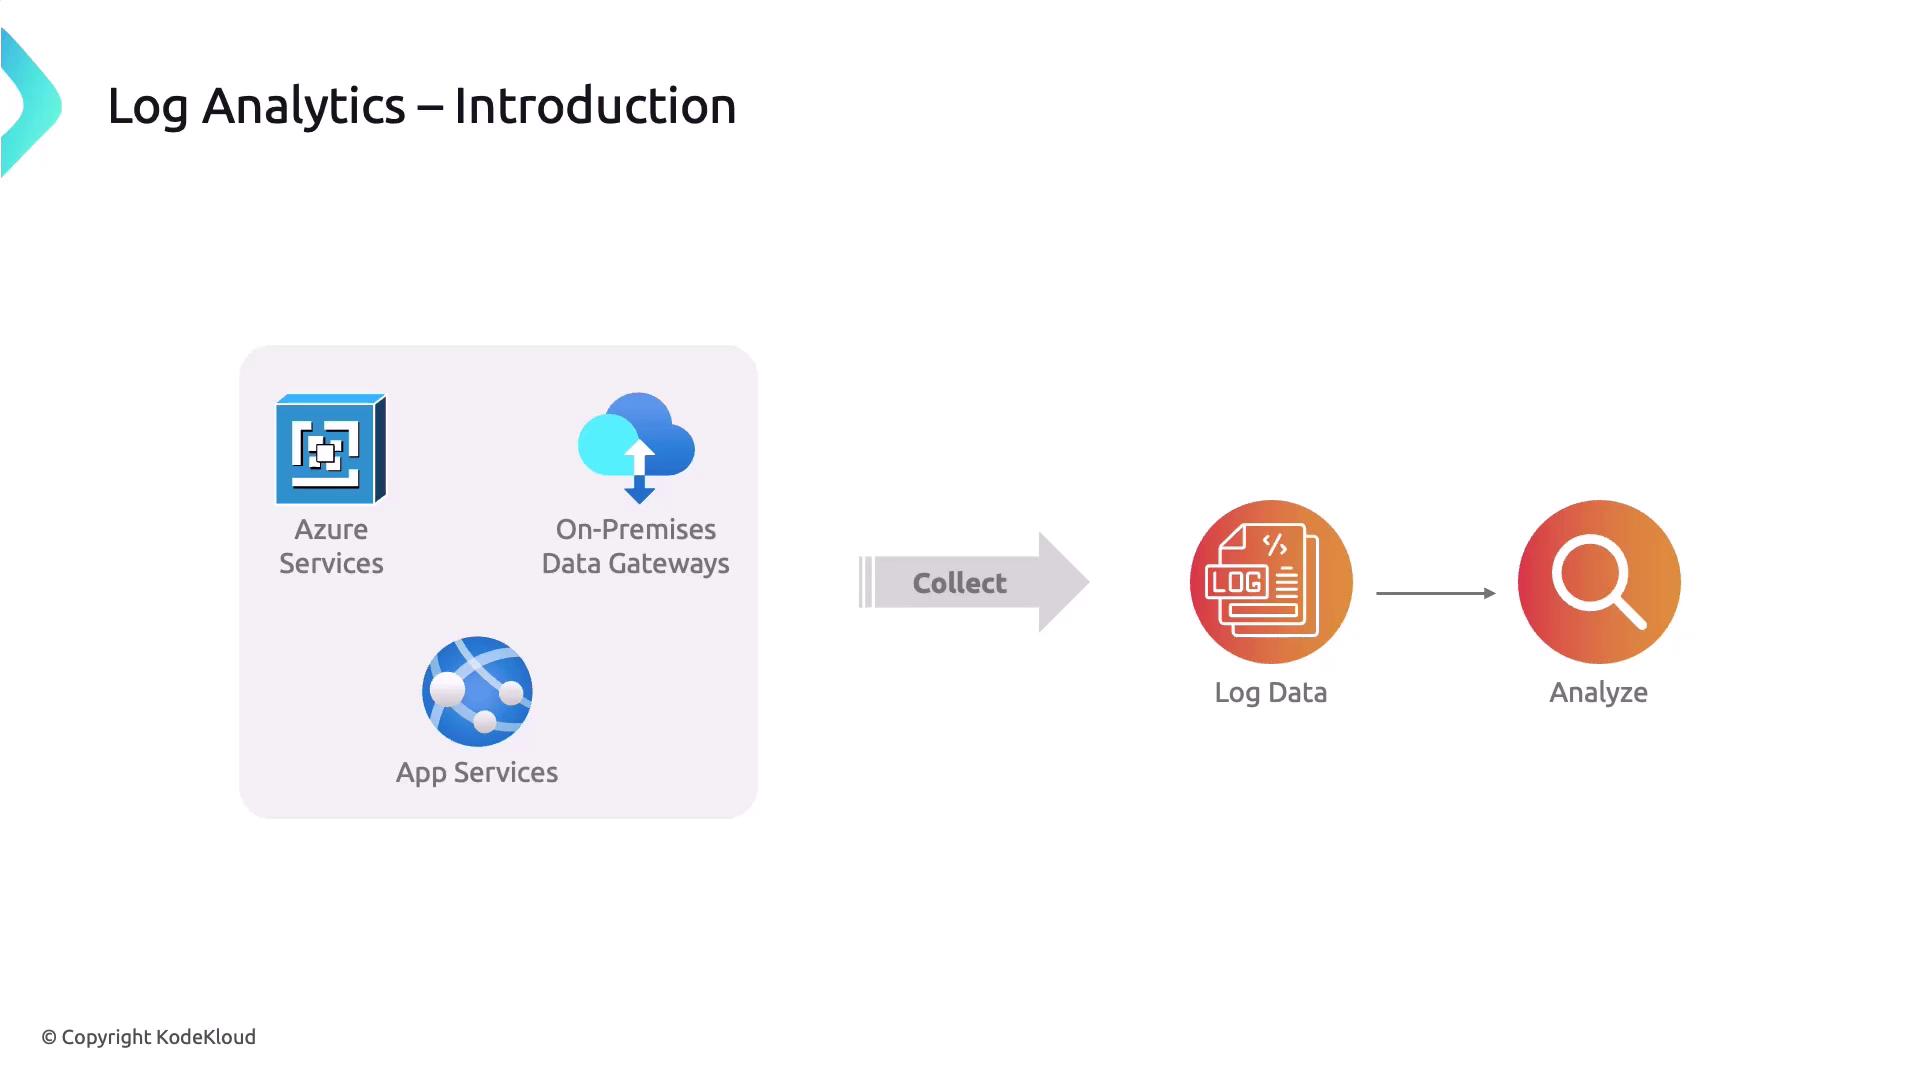
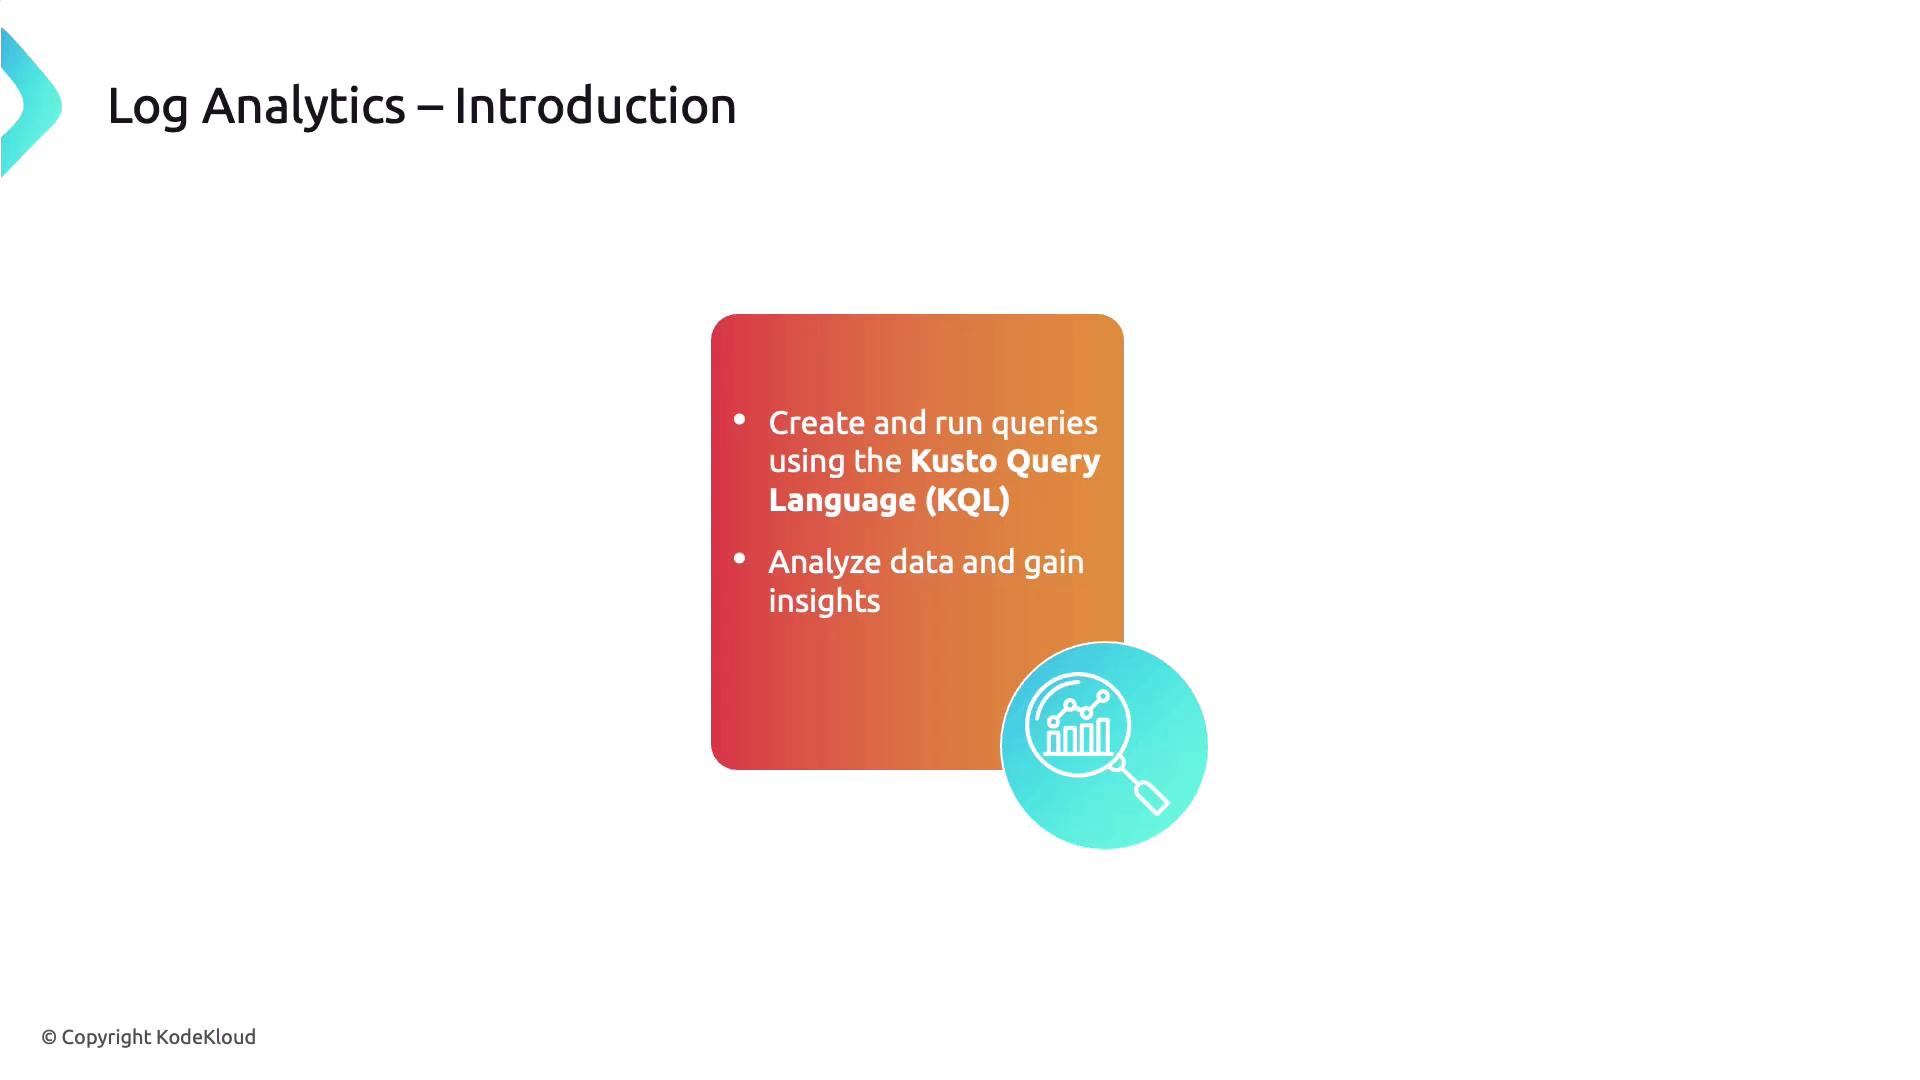
KQL supports time-series analysis, joins, and machine learning plugins for advanced insights.
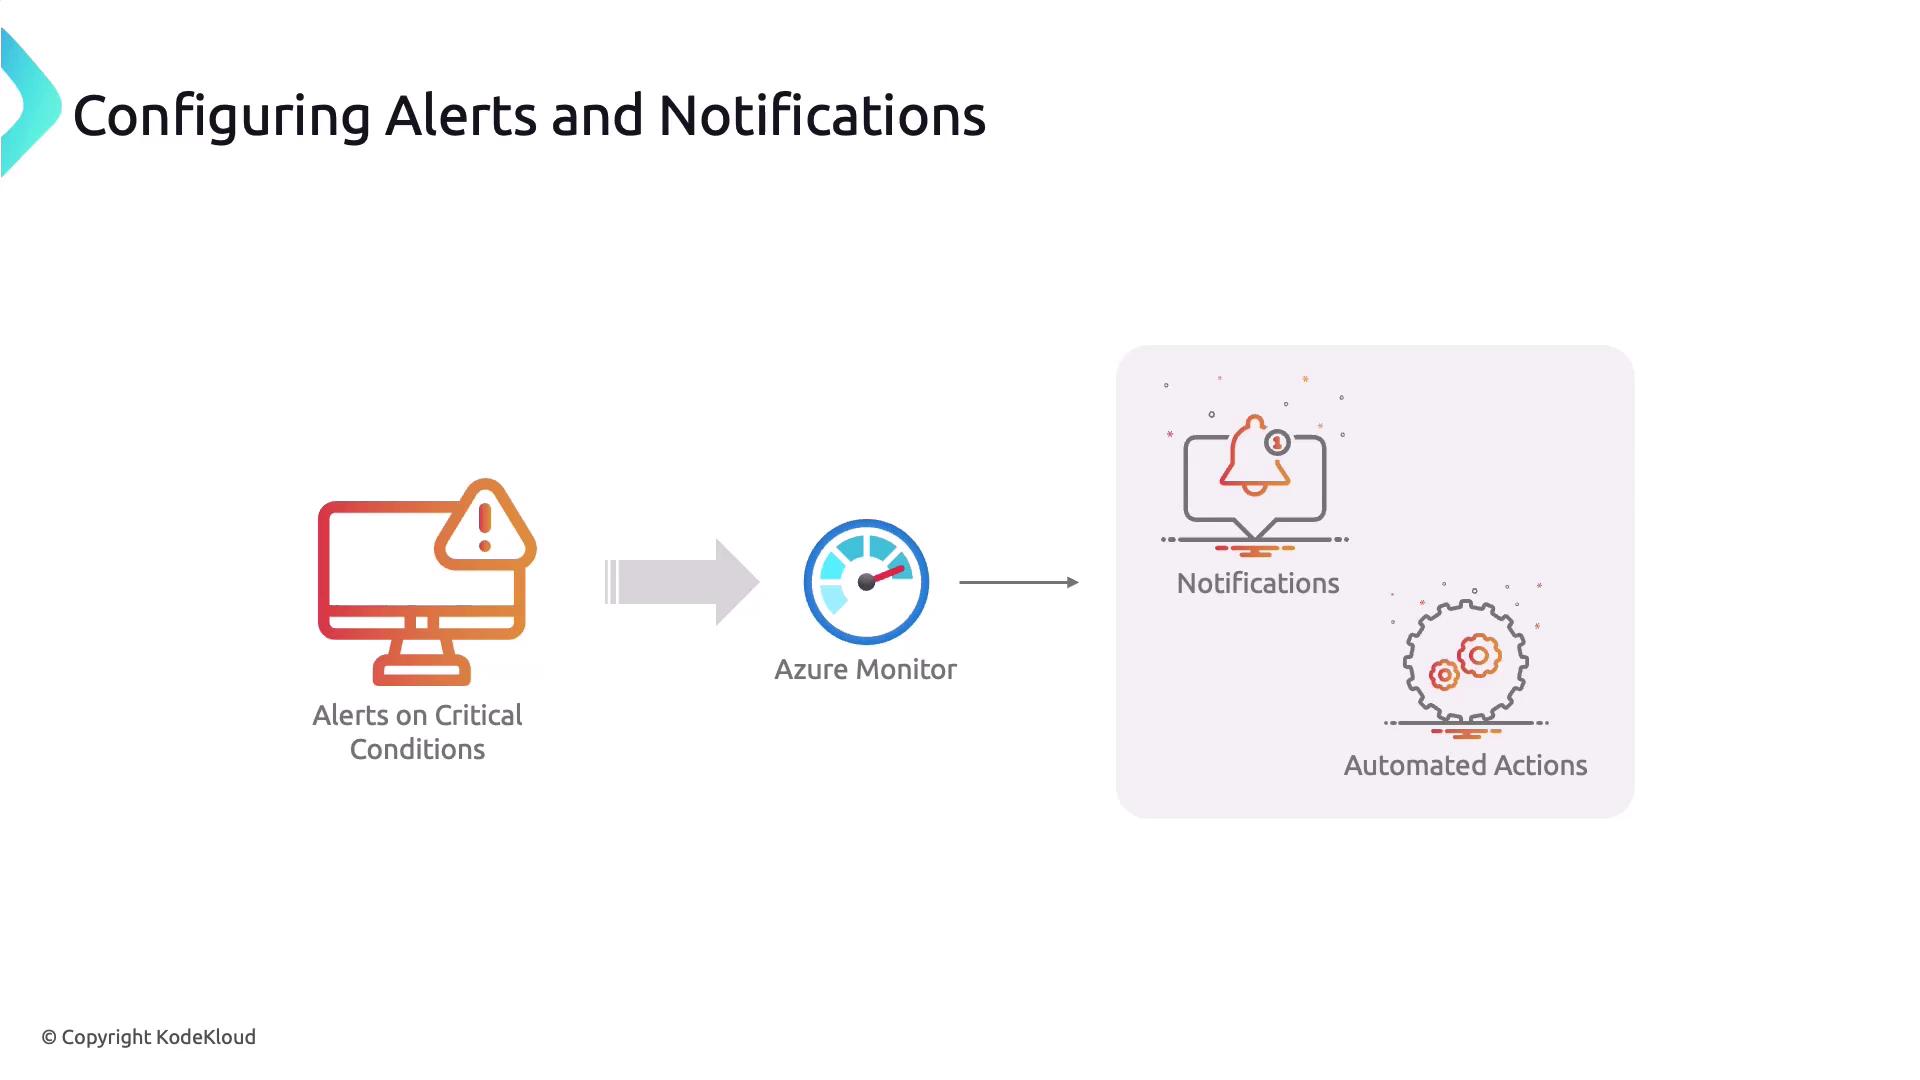
Configuring Alerts and Notifications
Set up alert rules to act on critical conditions:- Action Groups define recipients and channels (email, SMS, Teams, webhooks).
- Alert Suppression prevents noisy notifications.
- Tune thresholds based on historical baselines for accuracy.

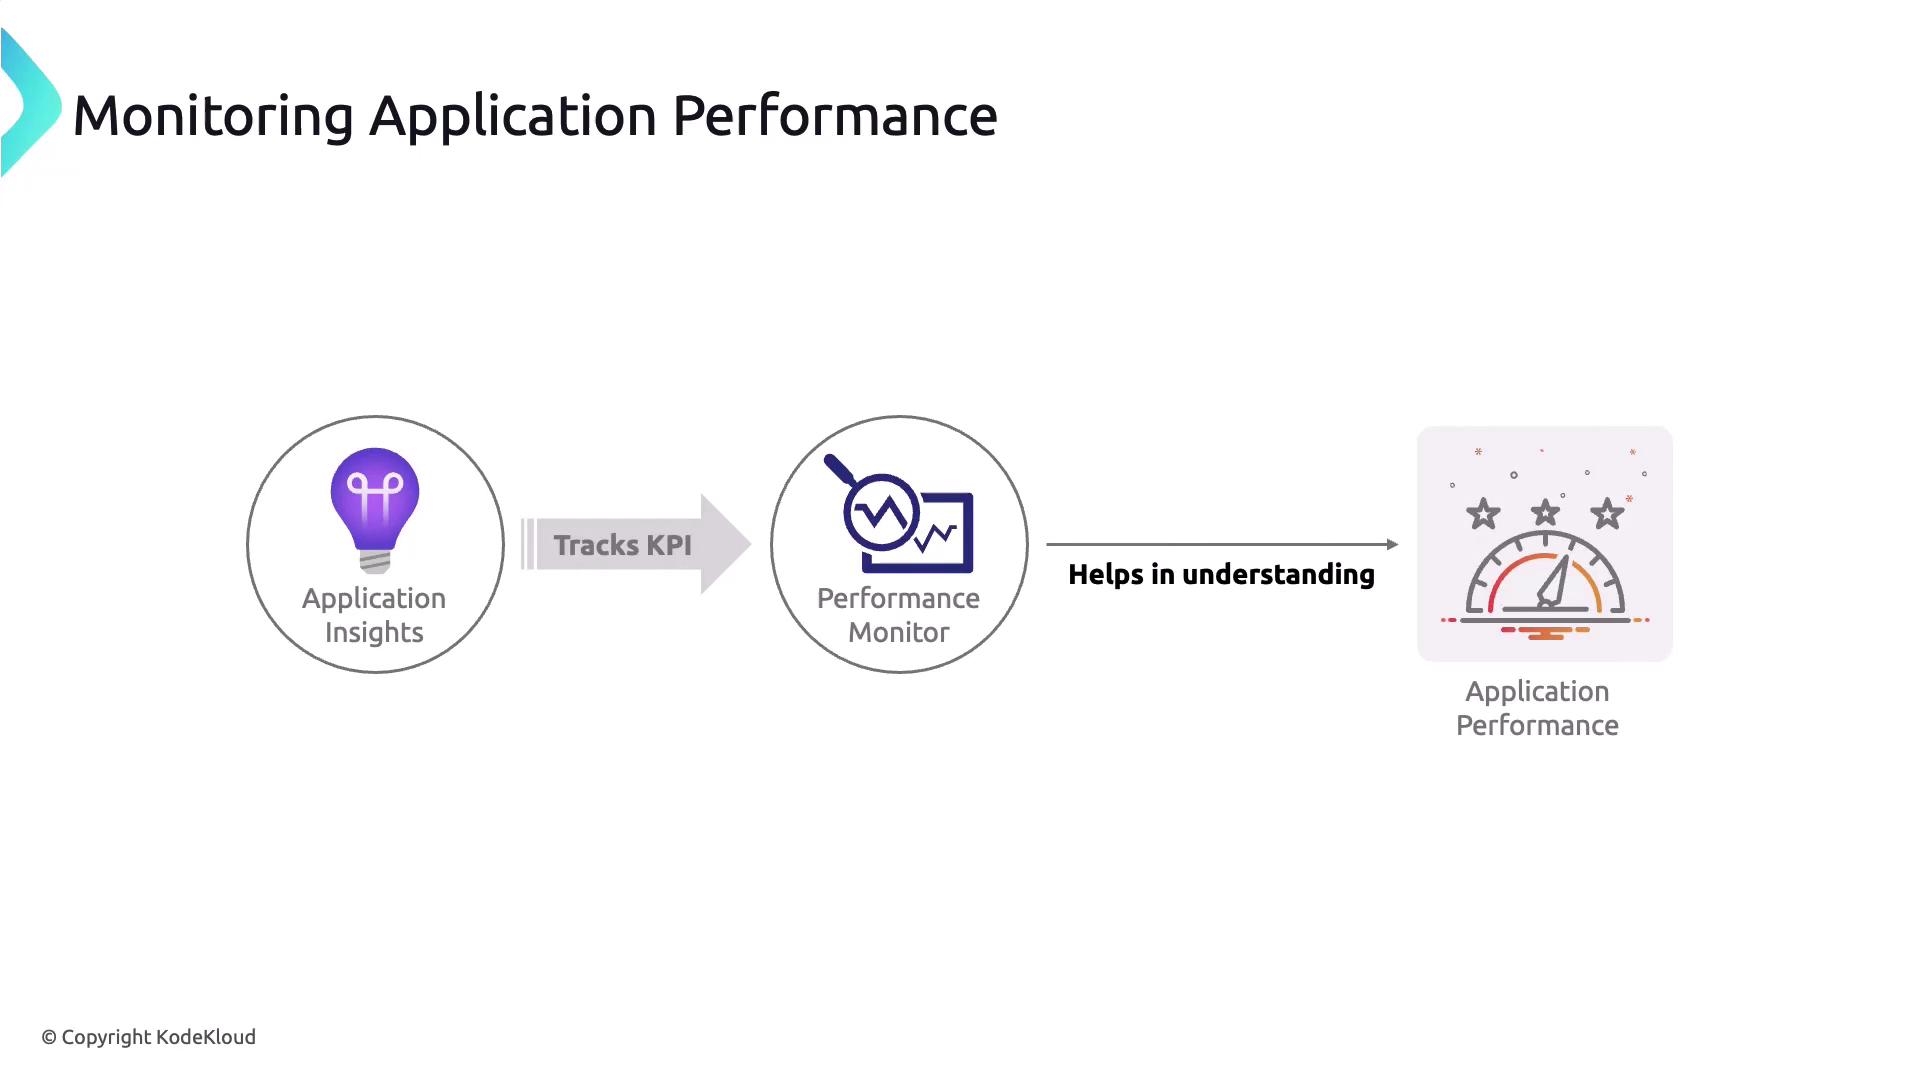
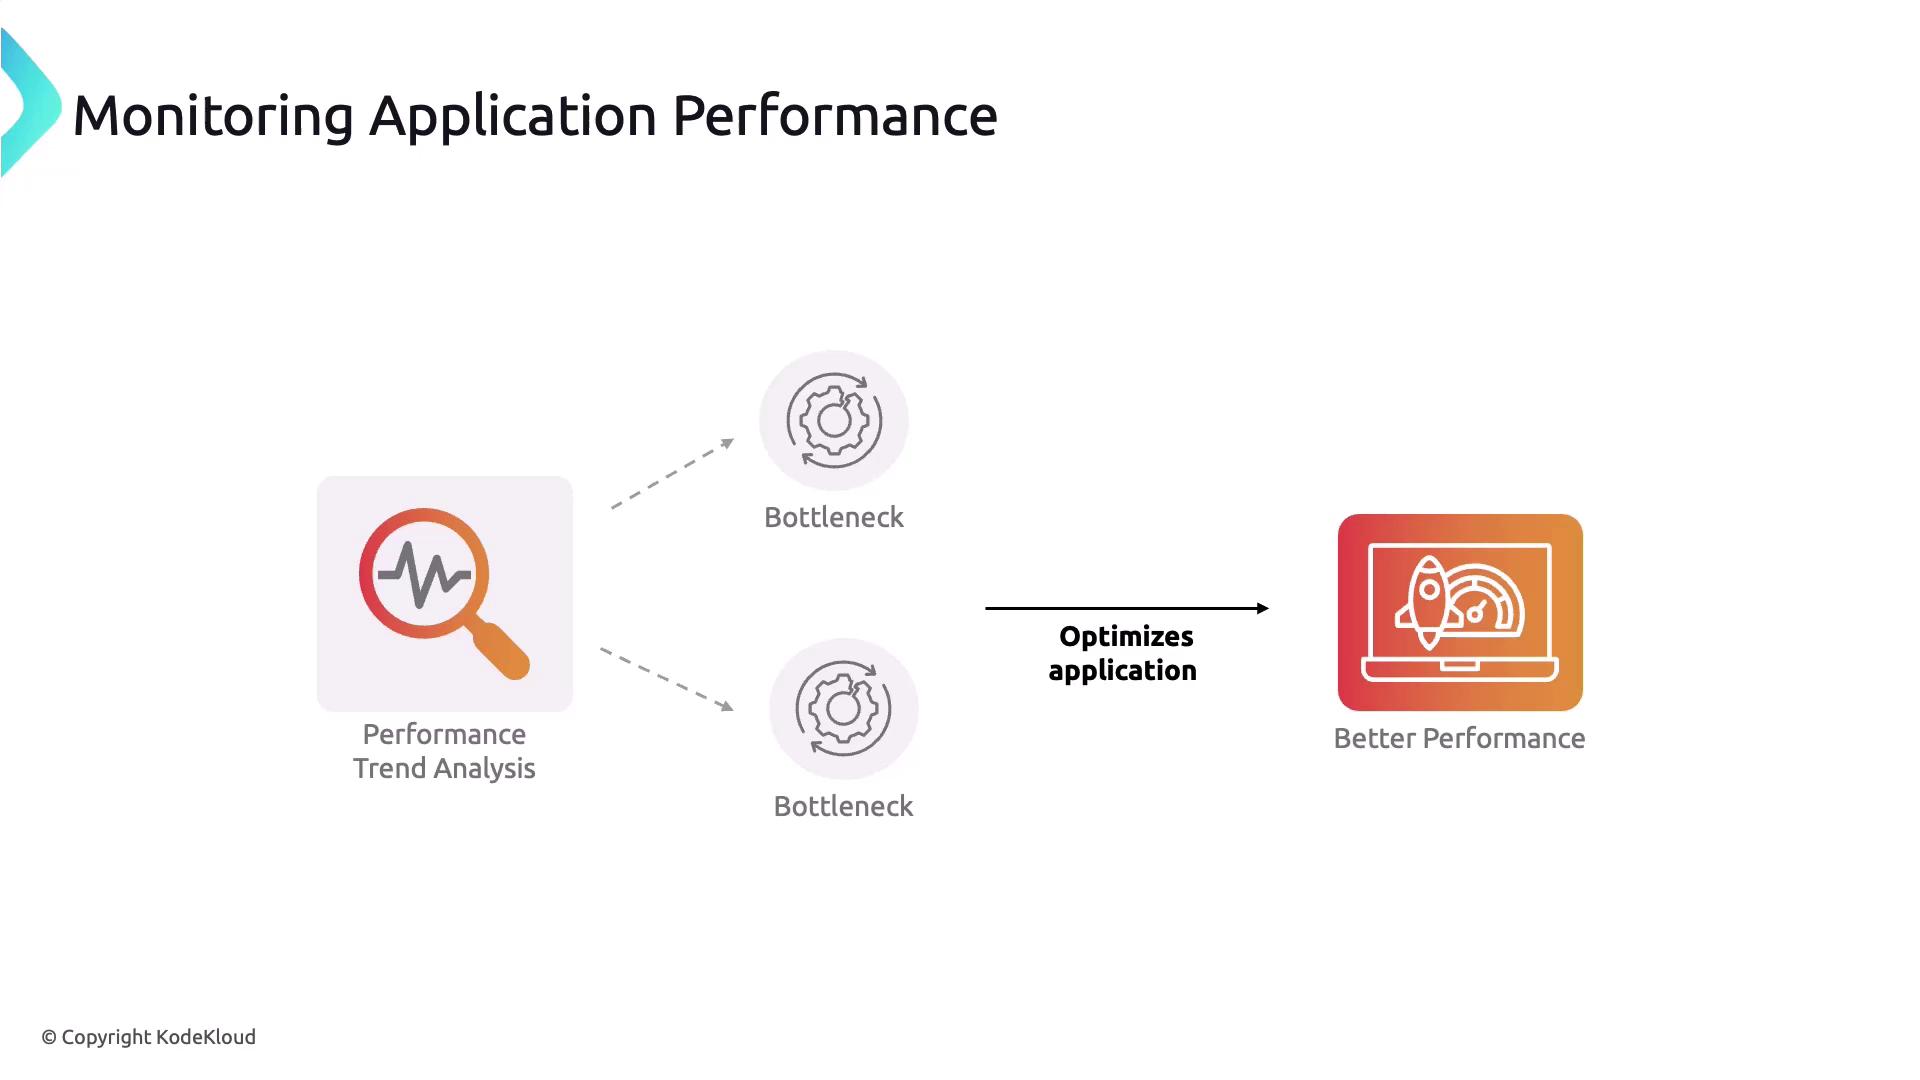
Monitoring Application Performance
Track these KPIs to ensure your app meets SLAs:- Response Time: Average and percentile latencies
- Error Rate: Failed requests per thousand
- Resource Utilization: CPU, memory, disk I/O
- Throughput: Requests per second
Analyzing Usage Metrics
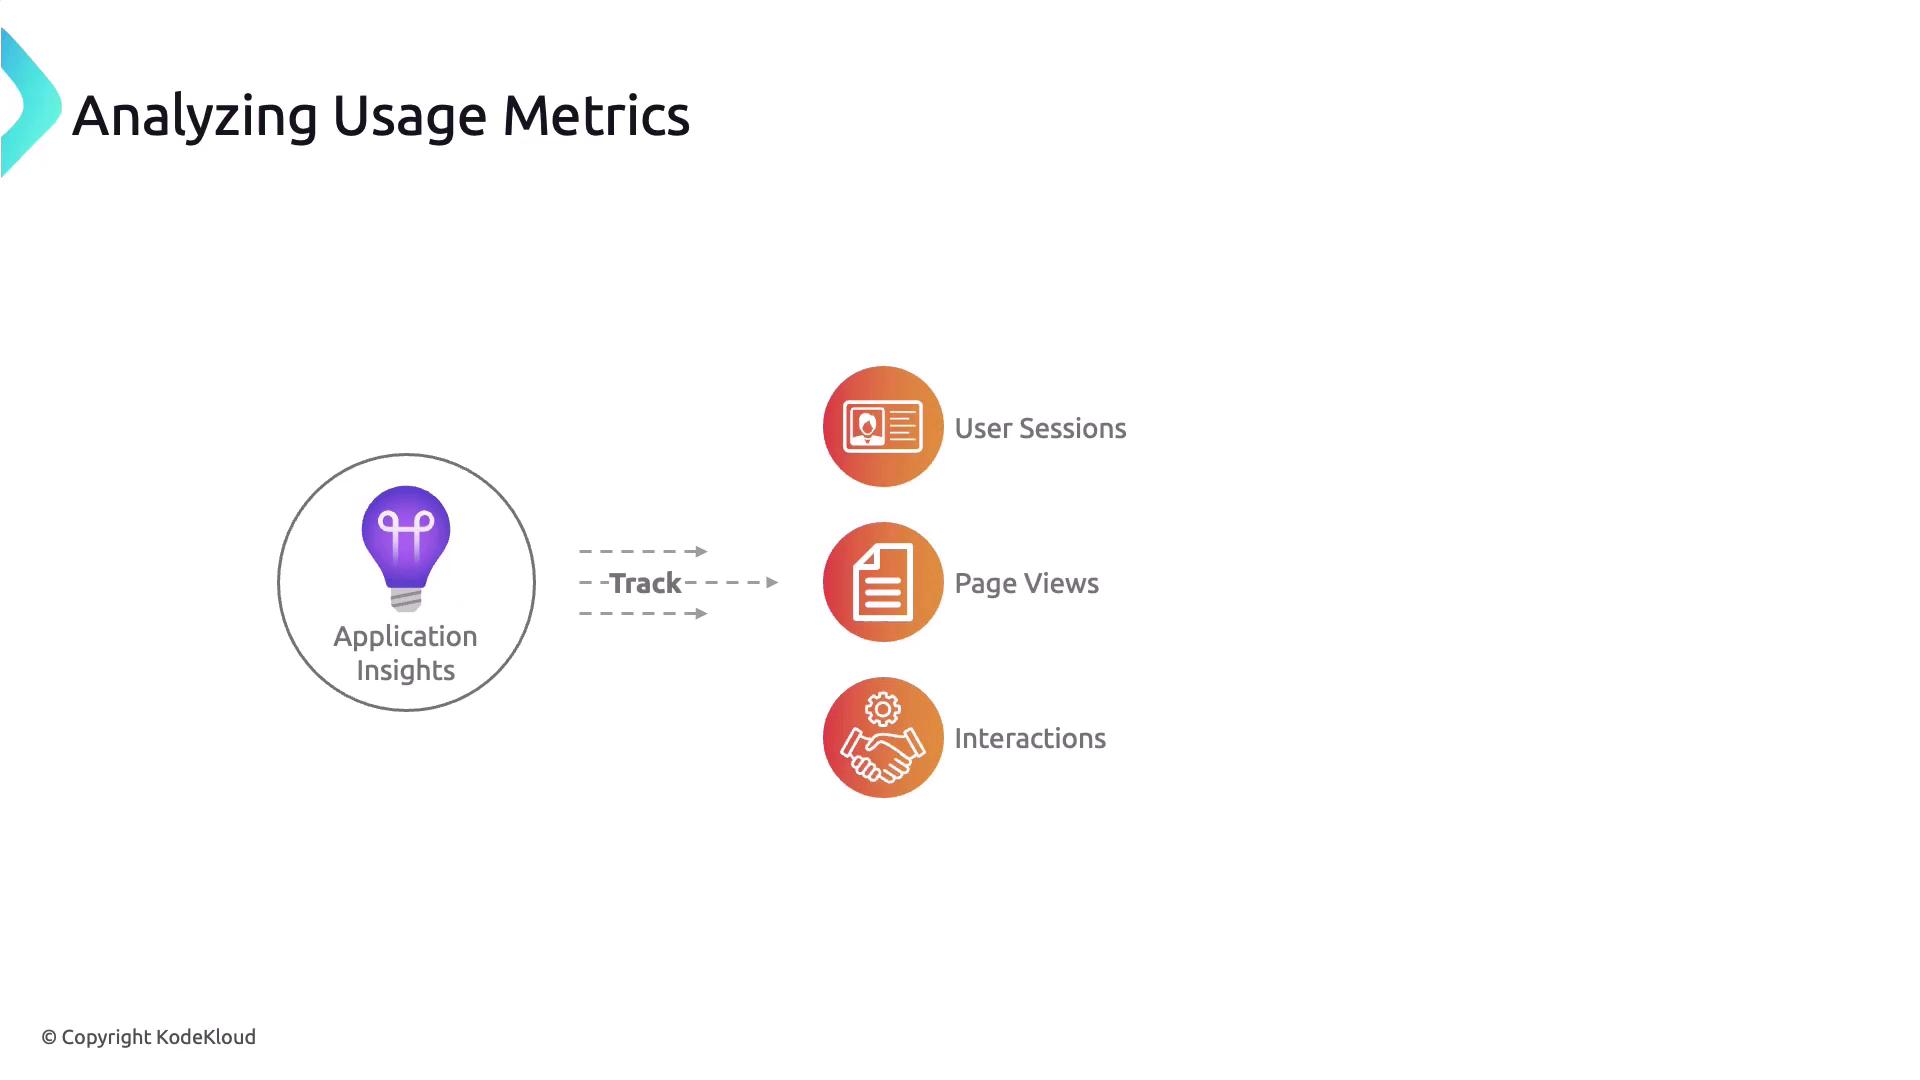
Usage telemetry helps you understand user engagement:- Sessions: Active users over time
- Page Views: Feature popularity
- Events: Customized tracking for critical workflows
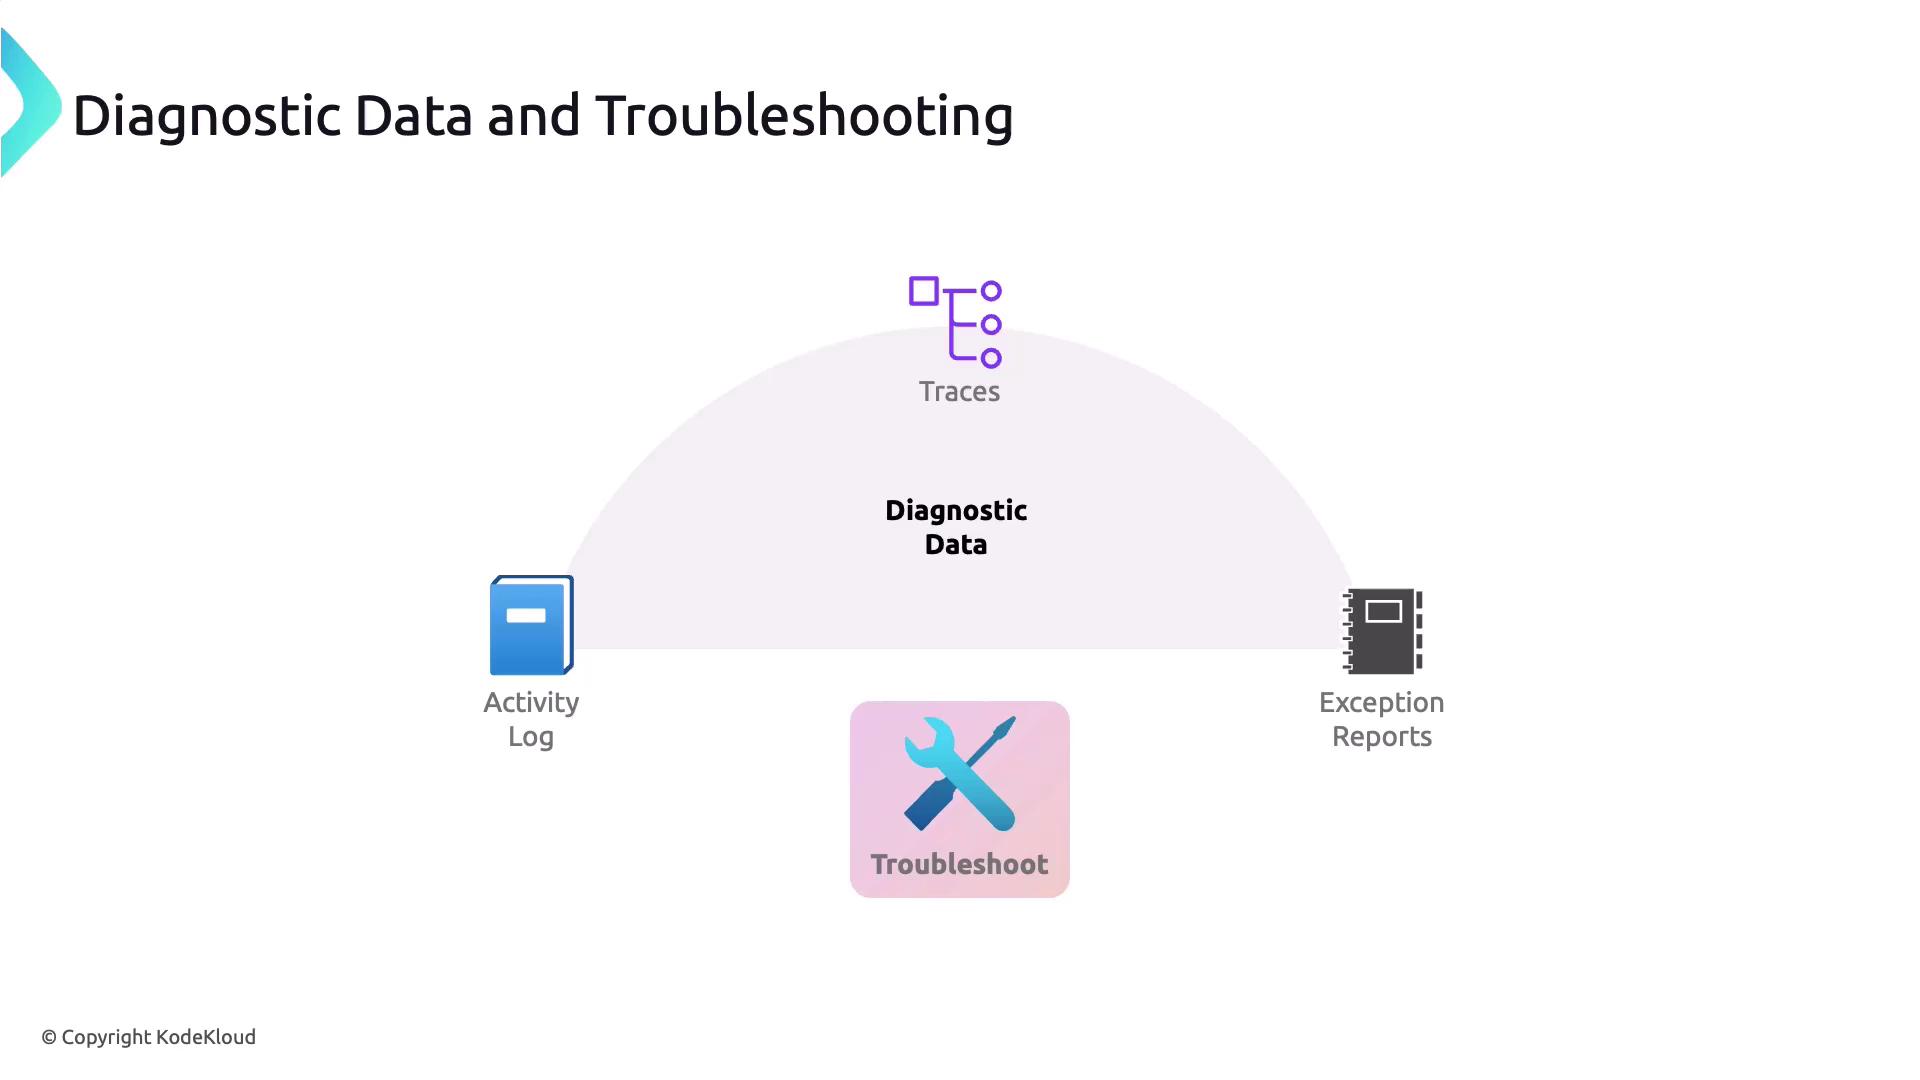
Diagnostic Data and Troubleshooting
Collect detailed traces, activity logs, and exception reports to perform root-cause analysis:- Correlation IDs to tie together distributed requests
- Trace logs for step-by-step execution flows
- Exception details for stack traces and error codes
Insufficient logging can slow down troubleshooting. Ensure critical paths emit structured logs and correlation IDs.
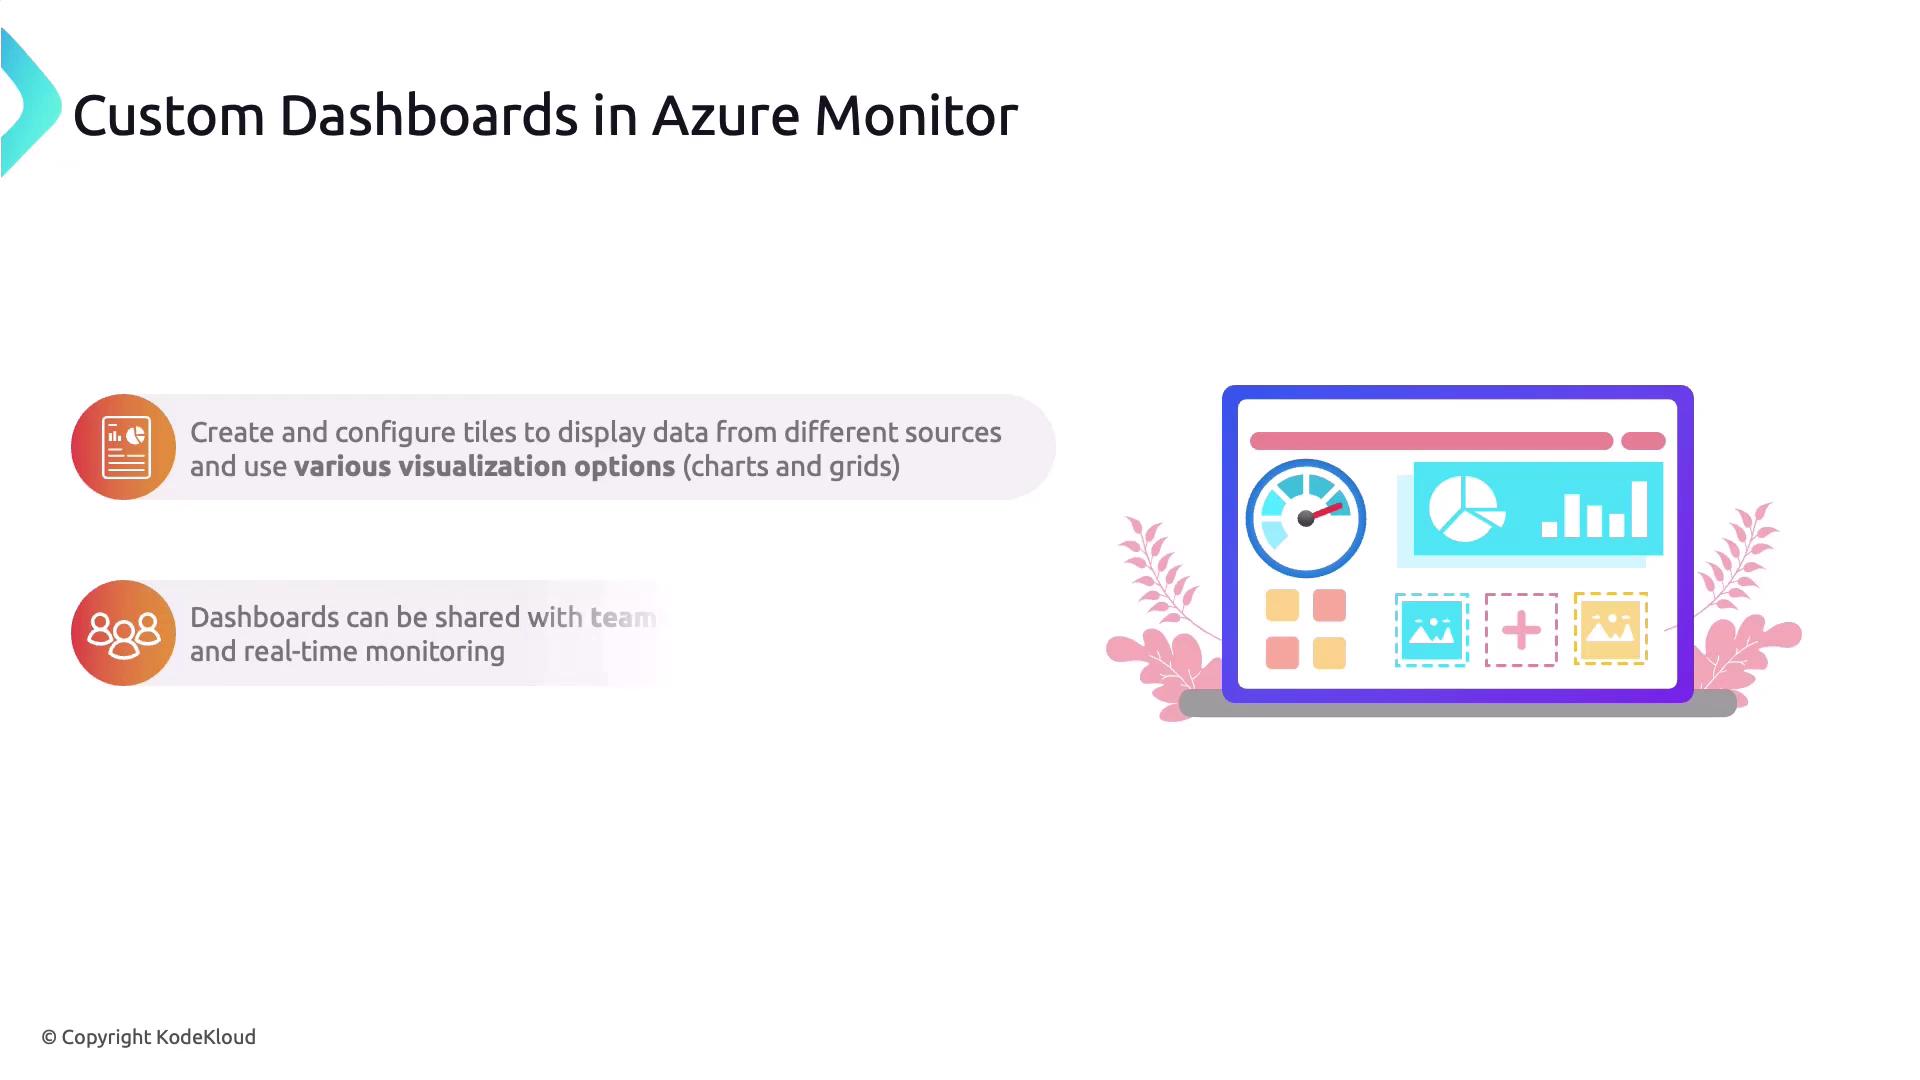
Creating Custom Dashboards
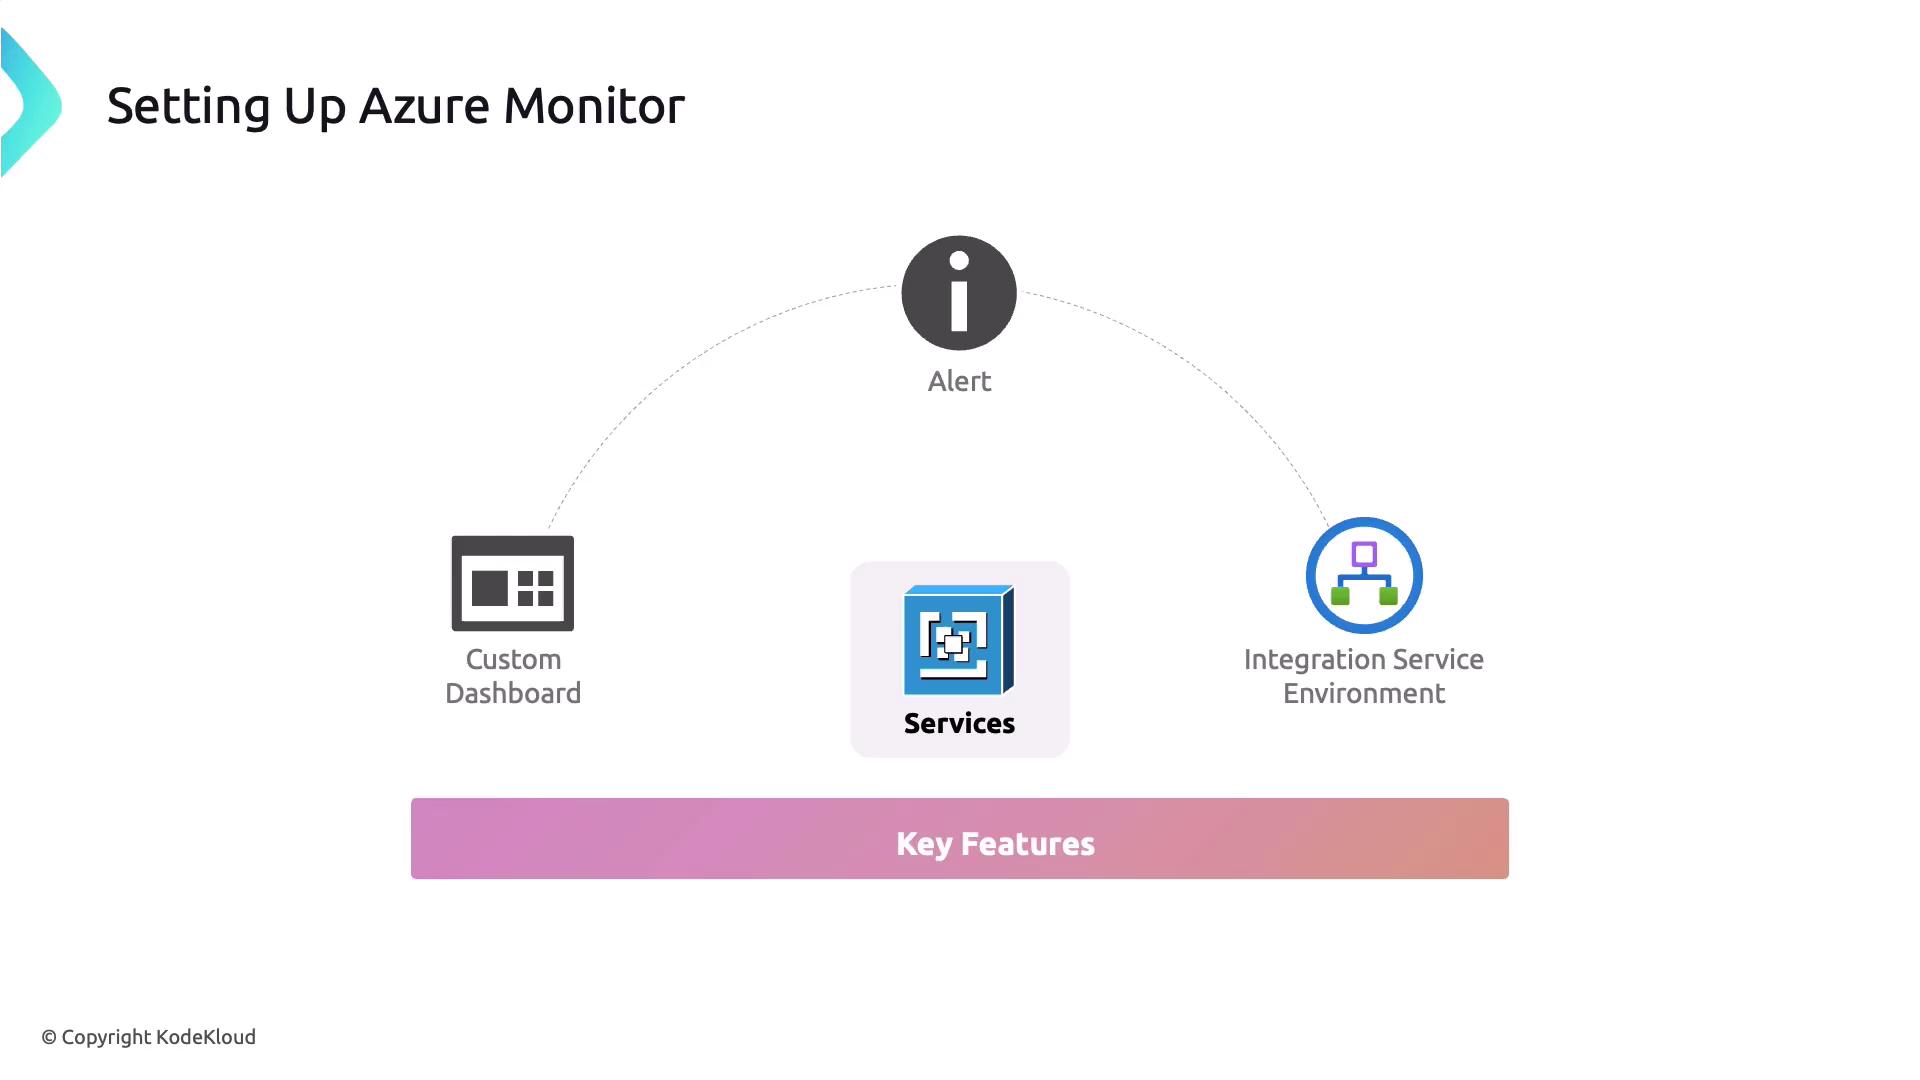
Build real-time, shareable dashboards in Azure Monitor:- Add tiles for metrics, logs, and charts.
- Pin Workbooks visualizations from Application Insights.
- Share with teams or embed in SharePoint.
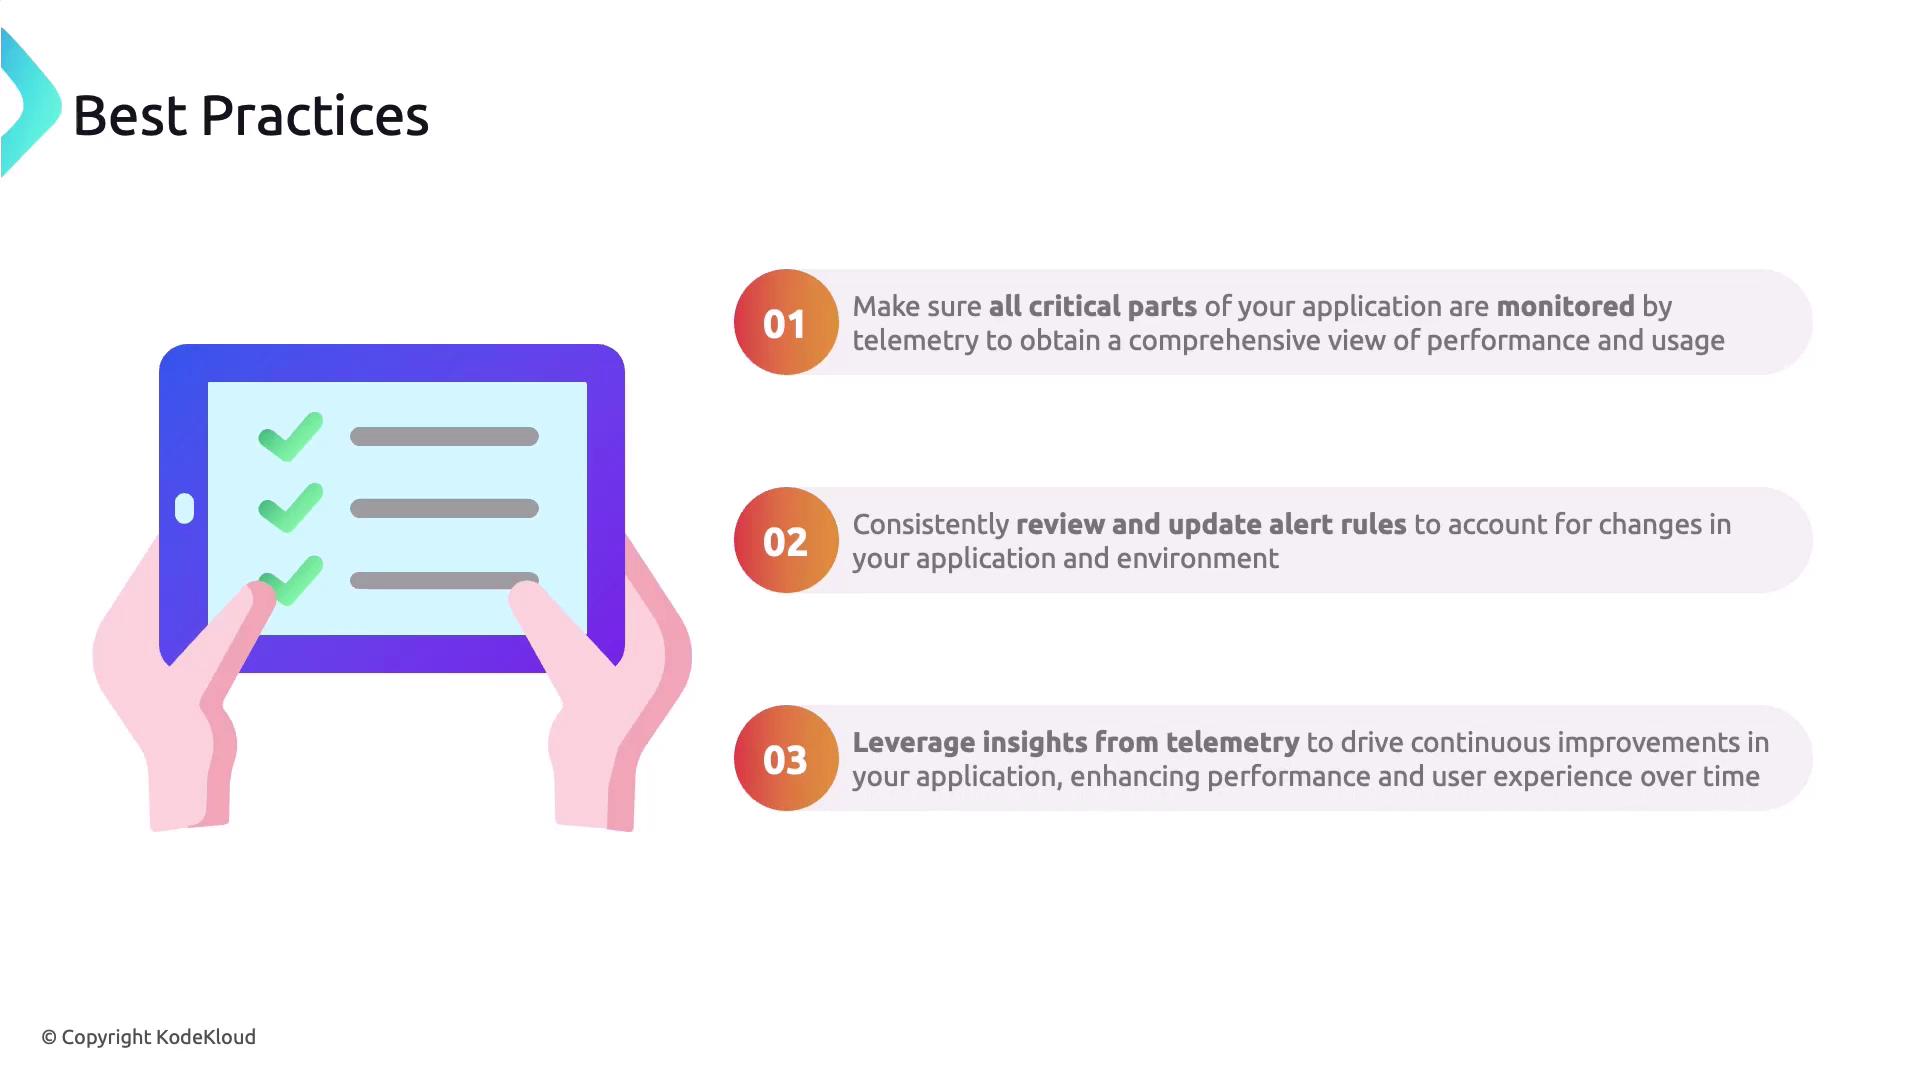
Best Practices for Azure Telemetry
- Comprehensive Coverage: Monitor all mission-critical services.
- Alert Tuning: Adjust thresholds based on load patterns.
- Regular Reviews: Update dashboards and rules as your architecture evolves.
- Data Retention: Balance retention periods with cost and compliance.
- Actionable Insights: Use telemetry to inform capacity planning and feature roadmaps.
References
- Azure Monitor Documentation
- Application Insights Overview
- Kusto Query Language (KQL) Guide
- AZ-400: Designing and Implementing Microsoft DevOps Solutions