

- Track critical infrastructure metrics (CPU, memory, disk, network)
- Configure Azure monitoring services and alerts
- Analyze usage and application performance telemetry
- Build custom dashboards and follow best practices for Azure performance management
Understanding core infrastructure metrics lets you proactively manage Azure resources and avoid bottlenecks.
Key Metrics Overview
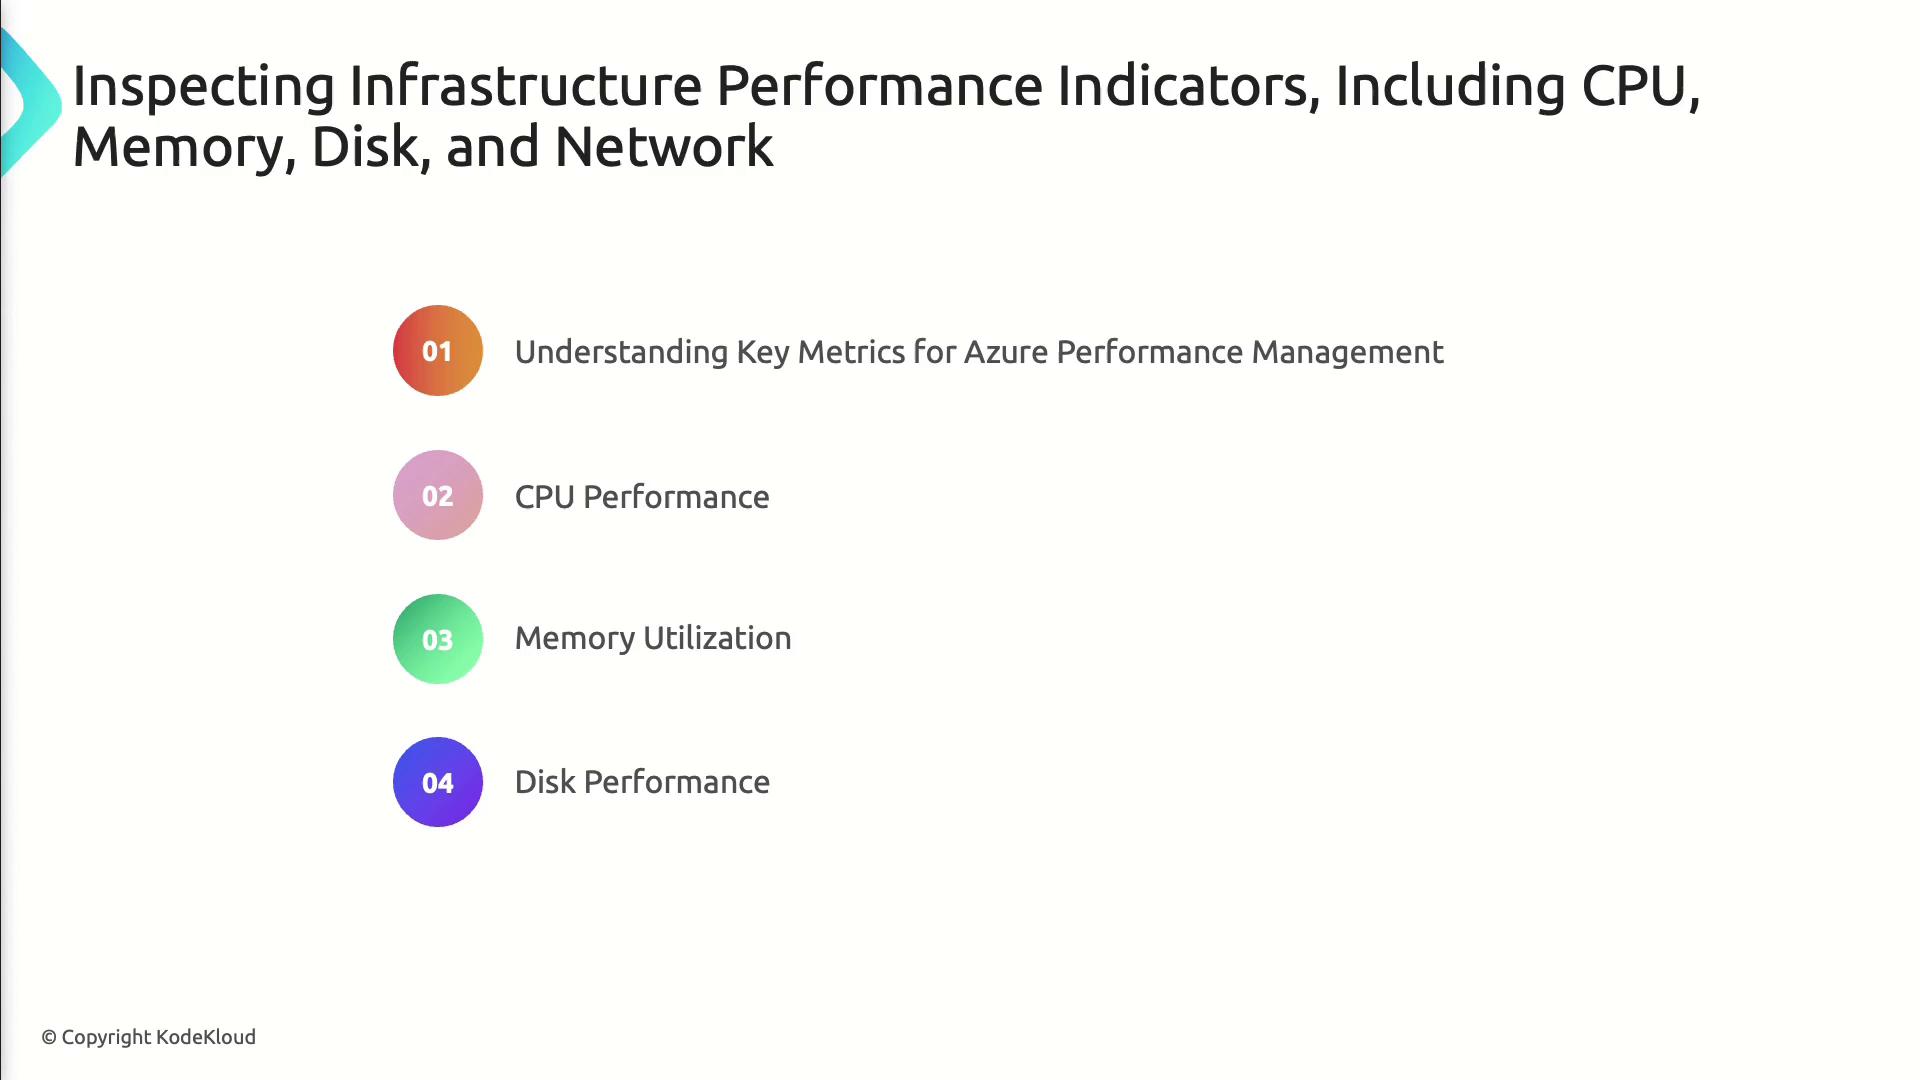
Import these metrics into Azure Monitor to visualize trends, set alerts, and automate scaling actions.
Practical Monitoring Scenarios
- Scenario 1: Scale out a compute cluster when CPU usage exceeds 75% for 5 minutes
- Scenario 2: Trigger an alert on sustained disk latency spikes in a database VM
- Scenario 3: Throttle network-intensive workloads to prevent bandwidth saturation
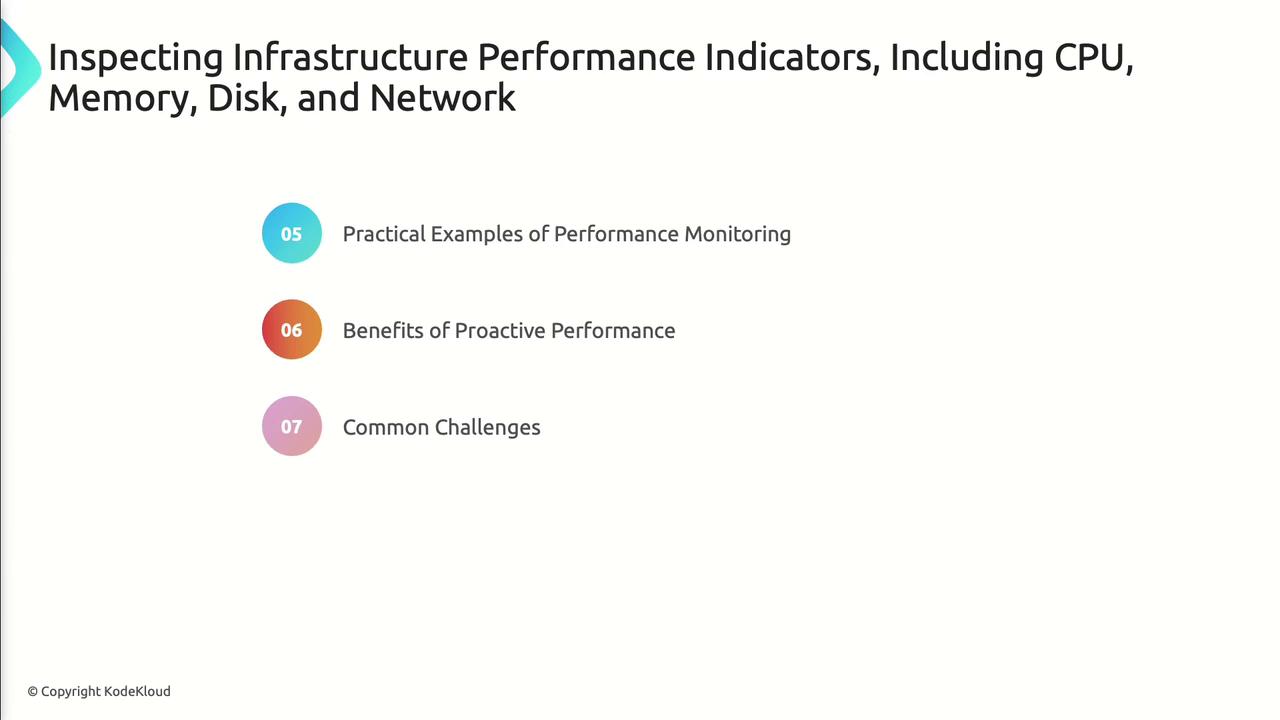
Benefits & Challenges
Telemetry data provides deeper insights into application usage and performance.
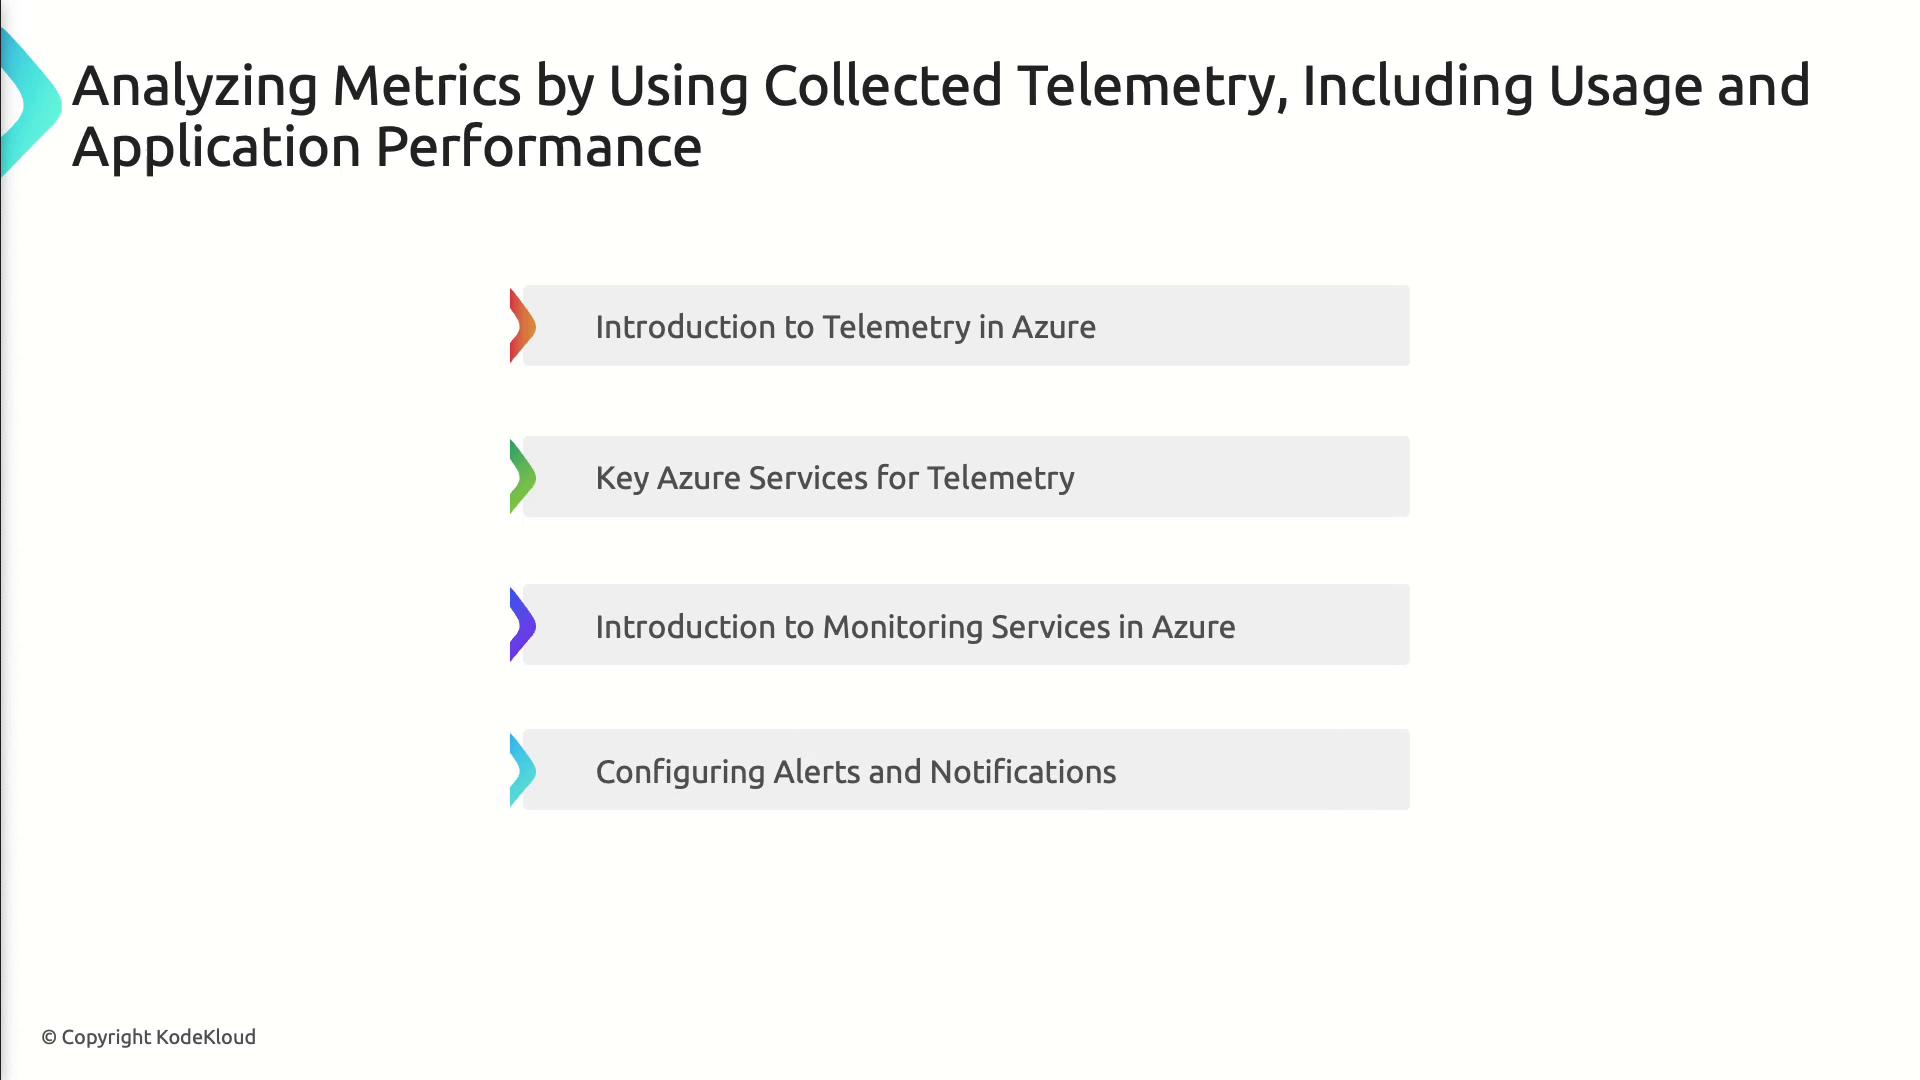
Configuring Alerts
- Navigate to Azure Monitor > Alerts
- Create an Alert Rule for a selected metric
- Define Action Groups to notify, log, or trigger automation
Avoid setting excessive alert rules. Prioritize critical metrics to reduce noise and ensure timely response.
Building Custom Dashboards
- Pin metric charts from multiple resources
- Use Workbooks for interactive reports
- Share dashboards with your team via Azure Portal
Monitor end-to-end application health by analyzing real usage metrics, dependencies, and response times.
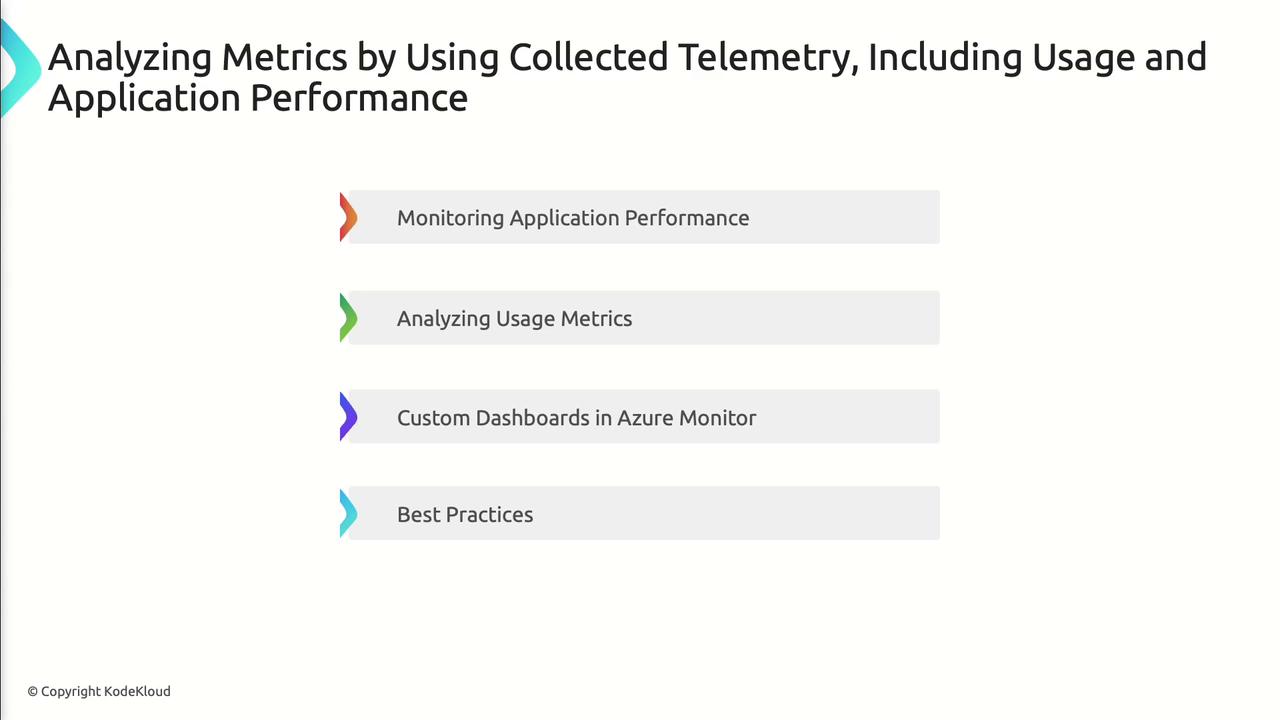
Best Practices
- Enable Application Insights for distributed tracing
- Define Failure Anomalies to catch performance regressions
- Leverage Live Metrics Stream during load testing
- Tag resources consistently for grouped telemetry analysis